RESEARCH ARTICLE
Metabolic Profiles of Obesity in American
Indians: The Strong Heart Family Study
Qi Zhao1☯, Yun Zhu1☯, Lyle G. Best2, Jason G. Umans3, Karan Uppal4, ViLinh T. Tran4, Dean P. Jones4, Elisa T. Lee5, Barbara V. Howard6, Jinying Zhao1*
1Department of Epidemiology, Tulane University School of Public Health and Tropical Medicine, New Orleans, LA, United States of America,2Missouri Breaks Industries Research Inc, Timber Lake, SD, United States of America,3MedStar Health Research Institute, Hyattsville, MD, United States of America,
4Division of Pulmonary Medicine, Emory University School of Medicine, Atlanta, GA, United States of America,5Center for American Indian Health Research, University of Oklahoma Health Science Center, Oklahoma City, OK, United States of America,6Medstar Research Institute and Georgetown and Howard Universities Centers for Translational Sciences, Washington, DC, United States of America
☯These authors contributed equally to this work.
Abstract
Obesity is a typical metabolic disorder resulting from the imbalance between energy intake and expenditure. American Indians suffer disproportionately high rates of obesity and dia-betes. The goal of this study is to identify metabolic profiles of obesity in 431 normoglycemic American Indians participating in the Strong Heart Family Study. Using an untargeted liquid chromatography–mass spectrometry, we detected 1,364 distinctm/zfeatures matched to
known compounds in the current metabolomics databases. We conducted multivariate analysis to identify metabolic profiles for obesity, adjusting for standard obesity indicators. After adjusting for covariates and multiple testing, five metabolites were associated with body mass index and seven were associated with waist circumference. Of them, three were associated with both. Majority of the obesity-related metabolites belongs to lipids, e.g., fatty amides, sphingolipids, prenol lipids, and steroid derivatives. Other identified metabolites are amino acids or peptides. Of the nine identified metabolites, five metabolites (oleoylethanola-mide, mannosyl-diinositol-phosphorylcera(oleoylethanola-mide, pristanic acid, glutamate, and kynurenine) have been previously implicated in obesity or its related pathways. Future studies are war-ranted to replicate these findings in larger populations or other ethnic groups.
Introduction
Overweight and obesity have become global epidemics [1]. Although substantial progress has been made to identify genetic and environmental factors, the mechanisms underlying obesity remain incompletely understood [2]. A comprehensive understanding of its metabolic path-ways is critical for developing effective preventive and therapeutic strategies against obesity and its related conditions.
PLOS ONE | DOI:10.1371/journal.pone.0159548 July 19, 2016 1 / 16
a11111
OPEN ACCESS
Citation:Zhao Q, Zhu Y, Best LG, Umans JG, Uppal K, Tran VT, et al. (2016) Metabolic Profiles of Obesity in American Indians: The Strong Heart Family Study. PLoS ONE 11(7): e0159548. doi:10.1371/journal. pone.0159548
Editor:Daniela Cota, INSERM, FRANCE
Received:December 18, 2015
Accepted:July 4, 2016
Published:July 19, 2016
Copyright:© 2016 Zhao et al. This is an open access article distributed under the terms of the Creative Commons Attribution License, which permits unrestricted use, distribution, and reproduction in any medium, provided the original author and source are credited.
Data Availability Statement:The data are owned by the American Indian tribes, and they do not allow unrestricted access to the data for ethical reasons. Data are available at the Coordinating Center at the University of Oklahoma Health Sciences Center and can be accessed following the procedures approved by the Strong Heart Study Publication and Presentation Committee (http://strongheart. ouhsc.edu/). Readers may contact Dr. Elisa T. Lee ([email protected]) to request access to the data.
American Indians suffer disproportionately higher rates of obesity and diabetes than other ethnic groups. For instance, the prevalence of obesity was over 40% in American Indians com-pared to about 27% in non-Hispanic whites [3]. In addition, American Indians are 2 to 3 times more likely to have diabetes than non-Hispanic whites [4]. The prevalence of heart disease among American Indians was also 20% higher than all other U.S. races [4], highlighting the importance of studying this high risk population.
Obesity is typically a metabolic disorder resulting from the imbalance between energy intake and expenditure [5]. Experimental research has demonstrated that altered levels of metabolites in multiple metabolic pathways were associated with obesity, e.g., glucose metabolism [6,7], lipid metabolism (cholesterol, betaine, acylcarnitines, and carnitine) [8], amino acids (leucine, alanine, ariginine, lysine, and methionine) [8], tricarboxylic acid cycle (pyruvate, citrate, acet-oacetate, and acetone) [7], cholines [9], and creatine metabolism (creatine and creatinine) [10]. Altered metabolic profiles, e.g., branched chain amino acids (BCAAs) [11,12], glutamine, gly-cine [13], and acylcarnitines [12,14] have also been associated with obesity and diabetes[15] in human populations. However, most existing studies employed targeted approaches by focusing on a subset of preselected metabolites, but this strategy has limited ability to discover novel dis-ease-related metabolites [11–13]. In addition, previous studies were primarily conducted in European populations. To date, no study has examined the metabolic profile of obesity in American Indians, an ethnically important but traditionally understudied population with high risk of obesity and diabetes [11,12].
Metabolomics is an emerging high-throughput‘omics’technology that can simultaneously quantify a large number of small metabolites in a biological sample. These metabolites serve as substrates or products in metabolic pathways, and are particularly suitable for studying meta-bolic disorders such as obesity or diabetes. A systematic metameta-bolic profiling using an untar-geted metabolomics approach provides a powerful tool to identify novel metabolites and metabolic pathways underlying obesity and related metabolic conditions. In this study, we used an untargeted high-resolution liquid chromatography-mass spectrometry (LC-MS) to identify metabolic profiles for obesity in American Indians participating in the Strong Heart Family Study (SHFS).
Material and Methods
Study participants
All study participants were American Indians participating in the SHFS, a family-based pro-spective study of genetic, metabolic, and behavioral factors for cardiovascular disease (CVD), diabetes, and their risk factors. A detailed description of the study design and methods of the SHFS was published previously [16]. Briefly, a total of 3,665 tribal members (aged 14 years and older) from 94 multiplex families were examined in 2001–2003. All living participants were re-examined about every 5 years and are currently being followed through 2018.
The current study included 431 normoglycemic participants who attended the SHFS clinical examination in 2001–2003. They were randomly selected from a total of 2,117 participants who were free of diabetes and overt CVD at the SHFS clinical examination in 2001–2003. Par-ticipants on medications were also excluded from this analysis. Details for the study design and inclusion/exclusion criteria has been described previously [17]. Except for body mass index (BMI) and waist circumference, participants included in the current analysis were not appre-ciably different from those not included (S1 Table). The SHFS protocol was approved by the Oklahoma Center Indian Health Service institutional review board (IRB), the Dakota Center Indian Health Service IRB, the Arizona Center Indian Health Service IRB, and the MedStar Health Research Institute IRB. It was also approved by the American Indian communities.
Metabolic Profiles of Obesity in American Indians
PLOS ONE | DOI:10.1371/journal.pone.0159548 July 19, 2016 2 / 16
R01AG038746 and cooperative agreement grants U01HL65520, U01HL41642, U01HL41652, U01HL41654, and U01HL65521. Dr. Qi Zhao is a Tulane University Building Interdisciplinary Research Careers in Women's Health (BIRCWH) scholar supported by Award K12HD043451 from the Eunice Kennedy Shriver National Institute of Child Health and Human Development of the National Institute of Health. The funder provided support in the form of salaries for authors [QZ, YZ, LGB, JGU, KU, VTT, DPJ, ETL, BVH, and JZ], but did not have any additional role in the study design, data collection and analysis, decision to publish, or preparation of the manuscript. The specific roles of these authors are articulated in the‘author contributions’section.
Competing Interests:Dr. Lyle G. Best is not an employee or own any interest in the Missouri Breaks Industries Research Inc (MBIRI) (http://www.mbiri. com). MBIRI is the grantee for the Dakota Center of the Strong Heart Study and Dr. Best is compensated as an independent consultant for his efforts as principal investigator for this study center. MBIRI has no plans to and has never engaged in
Informed consent was obtained from each participant or guardians of participants younger than 18 years of age.
Obesity measurements
Anthropometric measurements including body weight, body height, and waist circumference were conducted with participants wearing light clothing and without shoes using standard methods by trained study staff. BMI was calculated using body weight in kilograms divided by height in meters squared. Waist circumference was measured at the level of the umbilicus while the participant was supine. Participants were classified into three groups according to the WHO definition: normal weight (BMI<25 kg/m2), overweight (25 kg/m2BMI<30 kg/m2)
and obesity (BMI30 kg/m2). Abdominal obesity was defined as a waist circumference greater than 102 cm in men or greater than 88 cm in women [18].
Assessment of obesity risk factors
Information on demographics, socioeconomics, and medical history was collected using stan-dard questionnaires. Lifestyle factors including smoking, alcohol intake, physical activity, and habitual diet were examined by personal interview. Smokers were classified as current smokers, former smokers, and nonsmokers. Participants were categorized as current drinkers, former drinkers, and never drinkers by self-reported history of alcohol intake, the type of alcoholic beverages consumed, frequency of alcohol consumption, and average quantity consumed per day and per week. Physical activity was assessed by the mean number of steps per day calcu-lated by wearing a pedometer for 7 consecutive days. Dietary intake was assessed using the block food frequency questionnaire [19]. Fasting plasma glucose, insulin, and lipids were mea-sured by standard methods which were published previously [20]. Insulin resistance was assessed according to the formula: HOMA-IR = fasting glucose (mg/dL) × insulin (μU/mL)/
405 [21].
Metabolic profiling by LC-MS
Data acquisition. Relative abundance of fasting plasma metabolites was determined using an untargeted high-resolution LC-MS. Details for laboratory protocols have been previously validated and described elsewhere [22–26]. Briefly, 65μL plasma sample aliquots were treated
with 130μL acetonitrile (2:1 v/v) containing 3.5μL of an internal isotopic standard mix [26],
placed on ice for 30 min, and centrifuged for 10 min (16,100 x g at 4°C) to remove protein. The supernatant was then removed and placed into autosampler vials. Mass spectral data were acquired using 10μL of supernatant with a 10 min formic acid/acetonitrile gradient at a flow
rate of 0.35 mL/min for the initial 6 min and 0.5 mL/min for the remaining 4 min on a Thermo LTQ-Velos Orbitrap mass spectrometer (Thermo Fisher, San Diego, CA). The first 2-min period consisted of 5% solution A [2% (v/v) formic acid in water], 60% water, and 35% acetoni-trile. The final 4-min period was maintained at 5% solution A in acetoniacetoni-trile. Based on previous research [25], this protocol allows for the measurement of metabolites differing by more than seven orders of magnitude in abundance, and thus we should be able to detect metabolites with a wide range of abundances. The mass spectrometer was set to collect metabolic profile from mass/charge ratio (m/z)85 to 2000 in a positive ionization mode. Three technical replicates were run for each sample using C18 chromatography.
In this study, we used a positive electrospray ionization because previous studies have shown that this mode provides accurate mass matches to metabolites in most pathways included in the Kyoto Encyclopedia of Genes and Genomes (KEGG) human metabolites
Metabolic Profiles of Obesity in American Indians
database [27]. All samples included 14 stable isotopes: [13C6]-D-glucose, [15N]indole,
[2-15N]-L-lysine dihydrochloride, [13C5]-L-glutamic acid, [13C7]-benzoic acid, [3,4-13C2
]cho-lesterol, [15N]-L-tyrosine, [trimethyl-13C3]caffeine, [15N2]uracil, [3,3-13C2]cystine, [1,2-13C2]
palmitic acid, [15N,13C5]-l-methionine, [15N]choline chloride, and
2’-deoxyguanosi-ne-15N2,13C10-5’-monophosphate. Quality control was performed based on these internal
stan-dards to evaluate mass accuracy in ppm, reproducibility of detection of internal stanstan-dards and total ion intensity across all samples. To improve data quality, additional filtering steps, as described below, were also applied based on missing values and coefficient of variation (CV).
Data pre-processing and quality control. Peak extraction, data alignment, and feature quantification were performed using the adaptive processing software apLCMS, a computer package designed for high-resolution metabolomics data analysis [28]. Data filtering, normal-ization, and transformation were performed using the computer package MSPrep [29]. Miss-ing data were imputed usMiss-ing the half of the minimum observed value within each metabolite across all samples. Metabolites with extremely high analytical variance, e.g., CV of technical replicates>10%, in our samples were excluded from further analyses. Batch-effect was
cor-rected using the empirical Bayes method ComBat implemented in MSPrep [30]. Potential metabolite identities were determined by performing an online search (10 ppm accuracy) against the Metlin database, the Human Metabolomics Database [31], and the LIPID MAPS structure database [32]. Metabolite annotations were classified into different confidence levels based on the recommended confidence levels assignment for metabolite identification [33].
Statistical analysis
Prior to statistical analyses, abundance levels of all detected metabolites were log-transformed and standardized to unit variance and zero mean (z-scores). Other continuous covariables were also standardized to z-scores.
To examine the association of metabolites with continuous obesity indices (e.g., BMI or waist circumference), we constructed generalized estimating equation (GEE) models, adjusting for age, sex, study sites, lifestyle factors (smoking, alcohol drinking, and physical activity), and socioeconomic status (education level). The associations of each metabolite with obesity (yes/ no) or abdominal obesity (yes/no) were also tested by GEE. The relatedness between family members was accounted for in GEE models. In addition, we further controlled for dietary intake of total daily calories, protein and fat in the GEE models. We also adjusted for insulin resistance in these models because of the strong correlation between obesity and diabetes. Because of the potential high correlations among metabolites, we used the false discovery rate to account for multiple testing, and aq-value<0.05 was considered statistically significant
[34].
To test the combined effects of the metabolites showing significant associations with obesity, we constructed a multi-metabolites score using the sum of abundance levels of these metabo-lites weighted by their regression coefficients obtained from the GEE models. The association between this multi-metabolite score and each obesity measure was tested using GEE, adjusting for covariates listed above. To identify metabolic profiles associated with obesity, we conducted sparse partial least-squares discriminant analysis (sPLS-DA) using the computer package ‘mixOmics’implemented in R. The sPLS-DA is a supervised, multivariate technique to deter-mine metabolic groups associated with a disease. Compared to sparse discriminant analysis or other wrapper approaches, sPLS-DA is computationally efficient and facilitates interpretability of the results via graphical outputs. The sPLS-DA analysis also allows for adjustments of covariates.
Metabolic Profiles of Obesity in American Indians
Results
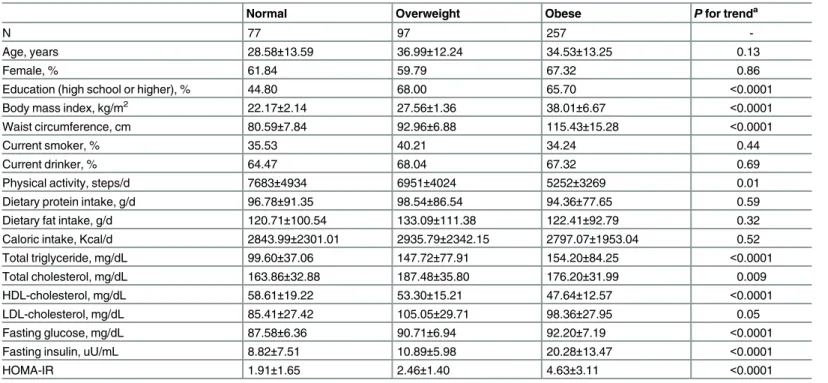
Table 1shows the clinical characteristics of study participants attending the SHFS clinical exam in 2001–2003. Compared to participants with normal body weight, those who were over-weight or obese had higher levels of triglyceride, total cholesterol, low-density lipoprotein cho-lesterol, fasting glucose, fasting insulin, and insulin resistance, but lower levels of high-density lipoprotein cholesterol and physical activity. There were no significant differences between the three groups in smoking, drinking, or dietary intake of total daily calories, protein or fat.
A total of 1,364 distinctm/zfeatures (CV10%) were detected and matched to known compounds in the current metabolomics databases. Five metabolites were significantly associ-ated with BMI and seven were significantly associassoci-ated with waist circumference. Among these significant metabolites, three were associated with both BMI and waist circumference [oleoy-lethanolamide (OEA), kynurenine, and mannosyl-diinositol-phosphorylceramide].
Table 2shows the multivariate associations between significant metabolites and BMI. Of the five metabolites associated with BMI, four metabolites were positively, whereas one was negatively, associated with BMI. In terms of chemical species, one metabolite is amino acids and the other four metabolites are lipids, e.g., fatty amides, sphingolipids, prenol lipids, or ste-roid derivatives.S2 Tableshows the multivariate-adjusted odds ratios (ORs) for obesity status (yes/no) associated with one standard deviation (SD) change in metabolites. The combined effects of these positively associated metabolites on obesity were also statistically significant. Additional adjustments for insulin resistance and dietary intake of fat, protein, and total calo-ries did not appreciably attenuate the observed associations (Table 2andS2 Table).
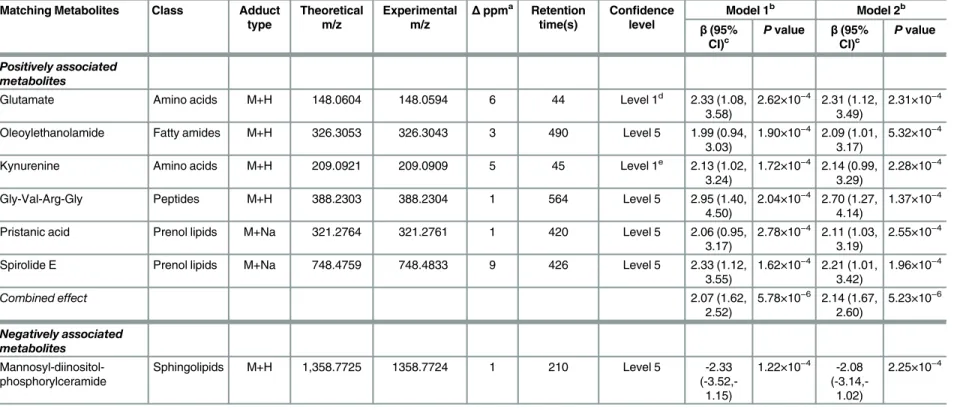
Table 3presents the multivariate-adjusted association of metabolites with waist circumfer-ence. Of the seven identified metabolites associated with waist circumference, six were
Table 1. Clinical characteristics of the study participants according to obesity (N = 431).
Normal Overweight Obese Pfor trenda
N 77 97 257
-Age, years 28.58±13.59 36.99±12.24 34.53±13.25 0.13
Female, % 61.84 59.79 67.32 0.86
Education (high school or higher), % 44.80 68.00 65.70 <0.0001
Body mass index, kg/m2 22.17±2.14 27.56±1.36 38.01±6.67 <0.0001
Waist circumference, cm 80.59±7.84 92.96±6.88 115.43±15.28 <0.0001
Current smoker, % 35.53 40.21 34.24 0.44
Current drinker, % 64.47 68.04 67.32 0.69
Physical activity, steps/d 7683±4934 6951±4024 5252±3269 0.01
Dietary protein intake, g/d 96.78±91.35 98.54±86.54 94.36±77.65 0.59
Dietary fat intake, g/d 120.71±100.54 133.09±111.38 122.41±92.79 0.32
Caloric intake, Kcal/d 2843.99±2301.01 2935.79±2342.15 2797.07±1953.04 0.52
Total triglyceride, mg/dL 99.60±37.06 147.72±77.91 154.20±84.25 <0.0001
Total cholesterol, mg/dL 163.86±32.88 187.48±35.80 176.20±31.99 0.009
HDL-cholesterol, mg/dL 58.61±19.22 53.30±15.21 47.64±12.57 <0.0001
LDL-cholesterol, mg/dL 85.41±27.42 105.05±29.71 98.36±27.95 0.05
Fasting glucose, mg/dL 87.58±6.36 90.71±6.94 92.20±7.19 <0.0001
Fasting insulin, uU/mL 8.82±7.51 10.89±5.98 20.28±13.47 <0.0001
HOMA-IR 1.91±1.65 2.46±1.40 4.63±3.11 <0.0001
Abbreviations: HOMA-IR, homeostatic model assessment of insulin resistance. aFamily relatedness was adjusted using GEE models.
doi:10.1371/journal.pone.0159548.t001
Metabolic Profiles of Obesity in American Indians
Table 2. Metabolites associated with body mass index in American Indians.
Matching metabolites Class Adduct type
Theoretical m/z
Experimental m/z
Δppma Retention
time(s)
Confidence level
Model 1b Model 2b
β(95%
CI)c
Pvalue Β(95% CI)c
Pvalue
Positively associated metabolites
Oleoylethanolamide Fatty amides M+H 326.3053 326.3043 3 490 Level 5 0.12 (0.05, 0.18)
4.46×10⁻⁴ 0.13 (0.02,
0.24)
5.77×10⁻⁴
Kynurenine Amino acids M+H 209.0921 209.0909 5 45 Level 1d 0.12 (0.05, 0.19)
1.03×10⁻⁴ 0.13 (0.06,
0.20)
1.83×10⁻⁴
Auxin A Prenol lipids M+H 329.2323 329.2319 1 29 Level 5 0.15 (0.07, 0.22)
1.13×10⁻⁴ 0.14 (0.07,
0.21)
2.28×10⁻⁴
12-Ketoporrigenin Steroid derivatives
M+Na 469.2924 469.2879 9 496 Level 5 0.18 (0.07, 0.28)
8.47×10⁻⁵ 0.15 (0.07,
0.23)
4.22×10⁻⁴
Combined effect 0.12 (0.07,
0.17)
4.41×10⁻⁶ 0.13 (0.08,
0.18)
1.86×10⁻⁶
Negatively associated Metabolites
Mannosyl-diinositol-phosphorylceramide
Sphingolipids M+H 1,358.7725 1358.7724 1 210 Level 5 -0.13
(-0.21,-0.06)
3.01×10⁻⁵ -0.12
(-0.18,-0.06)
2.28×10⁻⁴
a
Delta in parts per million.
bModel 1 adjusted for age, sex, site, lifestyle (smoking, alcohol drinking, and physical activity), and socioeconomic status (education level); Model 2 further adjusted for dietary caloric,
protein, and fat intakes and HOMA-IR. c
Change in BMI per SD change in log-ransformed abundance of metabolites. dPreviously validated with standard and MS/MS.
Table 3. Metabolites associated with waist circumference in American Indians.
Matching Metabolites Class Adduct type
Theoretical m/z
Experimental m/z
Δppma Retention time(s)
Confidence level
Model 1b Model 2b
β(95%
CI)c
Pvalue β(95% CI)c
Pvalue
Positively associated metabolites
Glutamate Amino acids M+H 148.0604 148.0594 6 44 Level 1d 2.33 (1.08, 3.58)
2.62×10⁻⁴ 2.31 (1.12,
3.49)
2.31×10⁻⁴
Oleoylethanolamide Fatty amides M+H 326.3053 326.3043 3 490 Level 5 1.99 (0.94, 3.03)
1.90×10⁻⁴ 2.09 (1.01,
3.17)
5.32×10⁻⁴
Kynurenine Amino acids M+H 209.0921 209.0909 5 45 Level 1e 2.13 (1.02, 3.24)
1.72×10⁻⁴ 2.14 (0.99,
3.29)
2.28×10⁻⁴
Gly-Val-Arg-Gly Peptides M+H 388.2303 388.2304 1 564 Level 5 2.95 (1.40, 4.50)
2.04×10⁻⁴ 2.70 (1.27,
4.14)
1.37×10⁻⁴
Pristanic acid Prenol lipids M+Na 321.2764 321.2761 1 420 Level 5 2.06 (0.95, 3.17)
2.78×10⁻⁴ 2.11 (1.03,
3.19)
2.55×10⁻⁴
Spirolide E Prenol lipids M+Na 748.4759 748.4833 9 426 Level 5 2.33 (1.12, 3.55)
1.62×10⁻⁴ 2.21 (1.01,
3.42)
1.96×10⁻⁴
Combined effect 2.07 (1.62,
2.52)
5.78×10⁻⁶ 2.14 (1.67,
2.60)
5.23×10⁻⁶
Negatively associated metabolites
Mannosyl-diinositol-phosphorylceramide
Sphingolipids M+H 1,358.7725 1358.7724 1 210 Level 5 -2.33
(-3.52,-1.15)
1.22×10⁻⁴ -2.08
(-3.14,-1.02)
2.25×10⁻⁴
aDelta in parts per million.
bModel 1 adjusted for age, sex, site, lifestyle (smoking, alcohol drinking, and physical activity), and socioeconomic status (education level); Model 2 further adjusted for dietary caloric,
protein, and fat intakes and HOMA-IR.
cChange in BMI per SD change in log-ransformed abundance of metabolites.
dThe m/z and RT matching with the internal standard.
ePreviously validated with standard and MS/MS.
positively whereas one was negatively associated with waist circumference.S3 Tableshows the ORs for abdominal obesity (yes/no) associated with a 1-SD change in metabolites. Most of the metabolites associated with waist circumference belong to lipids, e.g., fatty amides, prenol lip-ids, and sphingolipids. Others are amino acids or peptides.
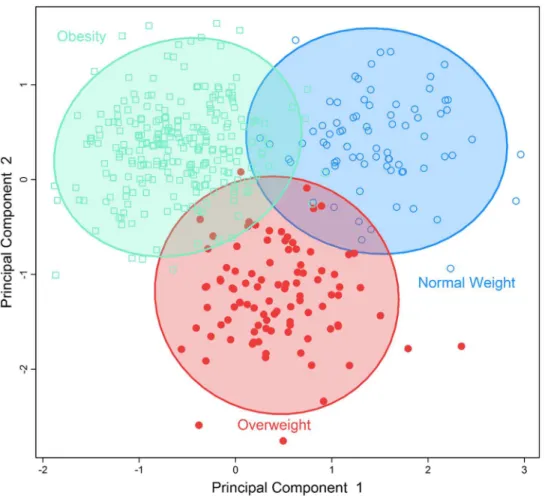
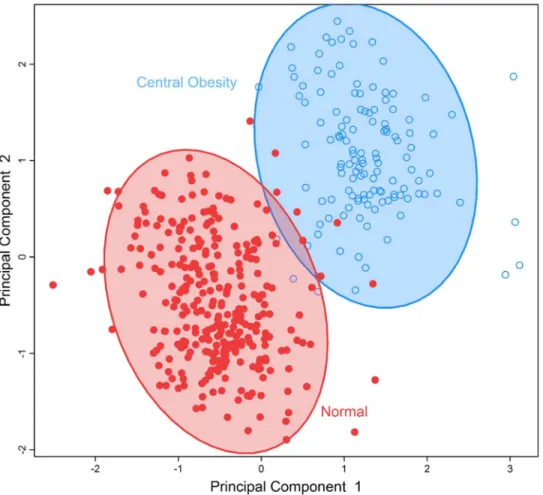
To identify obesity-related metabolic patterns and to examine the discriminant ability of the identified metabolites in differentiating obesevs. nonobese individuals, we conducted multivar-iate analysis by sPLS-DA.Fig 1demonstrates that participants who were obese, overweight, or normal body weight could be classified into three separate groups using the five metabolites significantly associated with BMI.Fig 2demonstrates that the seven metabolites associated with waist circumference could also separate participants into two groups: abdominal obesity vs. non-obese. These results revealed the different metabolic profiles of obese vs. nonobese individuals, and suggest that the identified metabolites could be used to differentiate obese vs. nonobese participants.
Discussion
Using an untargeted high-resolution LC-MS, we demonstrated that obese vs. nonobese Ameri-can Indian participants have clearly different metabolic profiles. Specifically, we identified nine plasma metabolites significantly associated with BMI or waist circumference or both. Of these,
Fig 1. Separation of individuals with normal bodyweight, overweight or obesity using a multi-metabolites score comprising of all multi-metabolites significantly associated with BMI using sparse partial least-squares discriminant analysis.
doi:10.1371/journal.pone.0159548.g001
Metabolic Profiles of Obesity in American Indians
six metabolites belong to the super class of lipids, including fatty acid amides, prenol lipids, sphingolipids, and steroid derives, and the remaining three are amino acids or peptides. Some of the metabolites, such as OEA, pristanic acid, mannosyl-diinositol-phosphorylceramide, and glutamate, have been previously implicated in obesity-related metabolic pathways [35–39]. Other identified metabolites could be involved in as yet unknown metabolic pathways related to obesity. Of note, the identified associations between metabolites and obesity were indepen-dent of known obesity indicators including age, lifestyle, dietary energy intake and insulin resistance. To the best of our knowledge, this is the first study to investigate the metabolic pro-files of obesity in American Indians.
In line with previous studies, we found that an elevated level of plasma OEA was positively associated with obesity (both BMI and waist circumference). First, OEA is a biologically active lipid amide synthesized by small intestinal enterocytes during absorption of dietary fat [37]. The release of OEA reduces food intake and induces satiety through activating peroxisome pro-liferator-activated receptor-α(PPAR-α), which is a transcription factor that belongs to the superfamily of nuclear hormone receptors [40]. PPAR-αis highly expressed in brown adipose tissue and the liver. It functions as a lipid sensor in the liver and recognizes and responses to the influx of fatty acids by stimulating the transcription of numerous genes related to lipid metabolism in the liver, including genes involved in mitochondrialβ-oxidation, fatty acid Fig 2. Separation of individuals with normal body weight versus those with abdominal obesity by a multi-metabolites score comprising of all metabolites significantly associated with waist
circumference using sparse partial least-squares discriminant analysis. doi:10.1371/journal.pone.0159548.g002
Metabolic Profiles of Obesity in American Indians
uptake and binding, and lipoprotein assembly and transport [41]. The activation of PPAR-α increases hepatic fatty acid oxidation and decreases the levels of circulating triglycerides that are responsible for adipose cell hypertrophy and hyperplasia, and thus reduces body weight [42]. Second, the identified association between OEA and obesity in our study is in agreement with evidence from experimental studies. For example, in one study, administration of OEA inhibited weight gain in rats [36,43]. Another study showed that PPARα-deficient mice devel-oped abdominal obesity [44]. Moreover, OEA levels in multiple tissues (e.g., liver, pancreas, adipose tissue) were found to be higher in obese rats compared to normal ones [45]. Third, a recent study in human has also shown that plasma OEA was positively correlated with BMI in obese individuals (BMI30 kg/m2), although no significant correlation was identified in non-obese individuals [37]. While our finding for the association of OEA with obesity corroborates previous evidence and further highlights the potential importance of OEA in body weight regu-lation or obesity, the precise mechanism underlying the reregu-lationship between OEA and obesity remains to be determined.
In this study, we also found a positive association of pristanic acid with abdominal obesity in American Indians. Pristanic acid is a branched chain fatty acid that an individual can obtain through the consumption of dairy products, ruminant animal fats, and certain fish [46]. Prista-nic acid is one of the natural ligands of PPARα[39], and represents the final product of alpha-oxidation of phytanic acid that accumulates in a variety of metabolic disorders [47,48]. In our study, an elevated level of plasma pristanic acid was significantly associated with abdominal obesity. As pristanic acid could serve as an efficient agonist of PPARα, it is possible that an increased level of pristanic acid could result in decreased activity of PPARα[38], which in turn causes dysregulation of lipid metabolism and body weight [42,49], thereby contributing to obesity pathogenesis. Further research is warranted to confirm or refute this hypothesis.
Besides OEA and pristanic acid as discussed above, we also found an association of sphingo-lipids (mannosyl-diinositol-phosphorylceramide) with obesity. Sphingosphingo-lipids are constituents of cellular membranes that have been involved in cellular signaling processes, vesicle traffick-ing, and membrane integrity [50,51]. Previous metabolomic studies have reported that a high level of serum sphingomyelin was associated with obesity in human [52]. Moreover, several plasma sphingolipid chemicals were found to be predictive of cardiovascular and total mortal-ity [53], suggesting a potential role of these lipids in obesmortal-ity and related conditions.
Amino acids have been previously implicated in obesity [11,12] and diabetes [12,15]. In this study, we also detected associations of several amino acids with obesity indices. For instance, an elevated level of plasma glutamate was positively associated with waist circumfer-ence in our study population. This finding is in agreement with a previous study showing that glutamate can distinguish lean from obese individuals [12]. Glutamate is an excitatory neuro-transmitter in the mammalian central nervous system, and plays an important role in both physiological and pathological processes [35]. Animal studies have shown that monosodium glutamate intake increases the risk of obesity [54], probably through increasing the palatability of food by disrupting the hypothalamic signaling cascade of leptin action [15,55].
In line with previous research, we also found that kynurenine was significantly associated with both BMI and waist circumference in our study population [56,57]. Kynurenine is a deg-radation product of the amino acid tryptophan. The kynurenine pathway is the main route of tryptophan degradation.[58] The enzyme indoleamine 2,3-dioxygenase (IDO) is the major enzyme in the kynurenine pathway that degrades tryptophan to kynurenine. IDO is expressed in many tissues including the adipose tissue and could be induced by pro-inflammatory kines, such as TNF-α, IL-1, and IFN-γ.[58] It is known that various pro-inflammatory cyto-kines could be synthesized and released in human adipose tissue.[59] IDO gene expression is increased in the adipose tissue of individuals with obesity.[60] Serum kynurenine/tryptophan
Metabolic Profiles of Obesity in American Indians
ratio reflects the activity of IDO and this ratio is increased in obesity.[60] Increased IDO activ-ity, essentially caused by chronic immune-mediated inflammation, has been suggested as a key component in the initiation and propagation of obesity. One of the possible mechanisms is that reduced tryptophan mediated by IDO may reduce serotonin production and cause mood disturbances, depression, and impaired satiety ultimately leading to increased caloric uptake and obesity [61].
Previous human studies have reported associations of branched chain amino acids (BCAAs, leucine/isoleucine and valine) with obesity [62], insulin resistance [12,63], and diabetes [15]. Our study, however, did not detect a significant association of BCAAs with obesity indices. This discrepancy could be attributed to the differences in genetic background and/or lifestyle factors between American Indians and other ethnic groups included in previous studies, because these factors could potentially lead to population-specific metabolic signatures. The lack of replication could also result from the inappropriate exclusion of a large number of metabolites (false negatives) due to multiple testing corrections. Future large-scale metabolo-mics studies should address this discrepancy.
In addition to the above discussed metabolites, we also found associations of certain prenol lipids (e.g., auxin A and spirolide E), steroid derivatives (e.g., 12-ketoporrigenin), and peptides (e.g., Gly-Val-Arg-Gly) with obesity measures. Biological functions of these metabolites are still unknown. Although these associations need further replication, our findings may unravel novel metabolic pathways implicated in obesity pathogenesis.
BMI is a measure of general obesity, whereas waist circumference reflects abdominal obe-sity. Waist circumference reflects intra-abdominal fat accumulation, a predictor of adverse metabolic or cardiovascular outcomes independent of BMI [64]. In this study, we identified that several metabolites associated with both types of obesity, but differential metabolomic pro-files of general obesityvs. abdominal obesity were also identified. These findings may suggest distinct but overlapping pathophysiological mechanisms between general obesity and abdomi-nal obesity. Our results corroborate the differential effects of generalvs. abdominal obesity on health outcomes [65].
Our study has several limitations. First, metabolites identified in our study are matched to molecular entities within the current metabolomics databases. The precise structures of these newly detected metabolites need to be determined in future studies. Second, although highly correlated, relative abundances instead of absolute concentrations were used as a surrogate for plasma metabolite levels. Third, although we controlled many known risk factors including dietary factors, residual confounding cannot be entirely excluded. Fourth, given the strong cor-relation between obesity and diabetes, it is highly likely that the identified obesity-associated metabolites might be also related to insulin resistance, a common mechanism underlying both obesity and diabetes. In this study, we additionally adjusted for insulin resistance in the model. It shows the association of the identified metabolites with obesity slightly attenuated but remained statistically significant. Further studies are necessary to clarify the roles of these metabolites in the pathogenesis of obesity and even other diseases. Finally, our results are very preliminary and should not be overinterpreted. In addition, the directions of causality between metabolites and obesity could not be determined in the cross-sectional analysis of the current study. Therefore, replication in larger populations and/or other ethnic groups and even longi-tudinal studies are warranted. The identified metabolites need to be confirmed by more advanced downstream analyses. Nonetheless, this is the first study to report metabolic profiles of obesity in American Indians. The untargeted high-resolution metabolomics approach enabled a comprehensive analysis of metabolic markers for obesity. The identification of chem-icals with known functions involved in body weight regulation, such as OEA, enhances the confidence that some of our findings may represent true metabolites associated with obesity.
Metabolic Profiles of Obesity in American Indians
Moreover, because some obesity-related metabolites identified in our study were also reported to be associated with obesity in other ethnic groups, it seems plausible to hypothesize that our findings could be generalized, at least partially, to other ethnicities.
In summary, this is the first study to identify novel metabolites and metabolic profiles of obesity in American Indians. Our findings highlight the importance of disturbed metabolic pathways, especially dysregulation of lipids, in body weight regulation or obesity pathogenesis. Replication in other populations and functional studies are required to confirm these findings.
Supporting Information
S1 Fig. Mass chromatogram for obesity-related metabolites.
(PPTX)
S1 Table. Clinical characteristics of SHFS participants who were included compared to those not included in this study.
(DOCX)
S2 Table. Association between obesity-related metabolites and general obesity in American Indians.
(DOCX)
S3 Table. Association between abdominal obesity-related metabolites and abdominal obe-sity in American Indians.
(DOCX)
Acknowledgments
The authors would like to thank the Strong Heart Study participants, Indian Health Service facilities, and participating tribal communities for their extraordinary cooperation and involve-ment, which has contributed to the success of the Strong Heart Study. The views expressed in this article are those of the authors and do not necessarily reflect those of the Indian Health Service.
Author Contributions
Conceived and designed the experiments: JZ. Performed the experiments: KU VTT LGB DPJ. Analyzed the data: QZ YZ. Contributed reagents/materials/analysis tools: JZ. Wrote the paper: JZ QZ YZ. Data interpretation, discussion, and manuscript review: LGB JGU ETL BVH.
References
1. Ng M, Fleming T, Robinson M, Thomson B, Graetz N, Margono C, et al. Global, regional, and national prevalence of overweight and obesity in children and adults during 1980–2013: a systematic analysis for the Global Burden of Disease Study 2013. Lancet. 2014; 384(9945):766–81. doi: 10.1016/S0140-6736(14)60460-8PMID:24880830.
2. Levian C, Ruiz E, Yang X. The pathogenesis of obesity from a genomic and systems biology perspec-tive. The Yale journal of biology and medicine. 2014; 87(2):113–26. PMID:24910557; PubMed Central PMCID: PMC4031785.
3. Services USDohaH. Summary Health Statistics for U.S.Adults: National Health Interview Survey, 2011. Centers for Disease Control and Prevention, 2012 Contract No.: 256.
4. Barnes PM, Adams PF, Powell-Griner E. Health Characteristics of the American Indian or Alaska Native Adult Population: United States, 2004–2008. Centers for Disease Control and Prevention 2010 Contract No.: 20.
5. Hill JO, Wyatt HR, Peters JC. Energy balance and obesity. Circulation. 2012; 126(1):126–32. doi:10. 1161/CIRCULATIONAHA.111.087213PMID:22753534; PubMed Central PMCID: PMC3401553.
Metabolic Profiles of Obesity in American Indians
6. Freemerman AJ, Johnson AR, Sacks GN, Milner JJ, Kirk EL, Troester MA, et al. Metabolic reprogram-ming of macrophages: glucose transporter 1 (GLUT1)-mediated glucose metabolism drives a proin-flammatory phenotype. The Journal of biological chemistry. 2014; 289(11):7884–96. doi:10.1074/jbc. M113.522037PMID:24492615; PubMed Central PMCID: PMC3953299.
7. Burgess SC, Hausler N, Merritt M, Jeffrey FM, Storey C, Milde A, et al. Impaired tricarboxylic acid cycle activity in mouse livers lacking cytosolic phosphoenolpyruvate carboxykinase. The Journal of biological chemistry. 2004; 279(47):48941–9. doi:10.1074/jbc.M407120200PMID:15347677.
8. Kim HJ, Kim JH, Noh S, Hur HJ, Sung MJ, Hwang JT, et al. Metabolomic analysis of livers and serum from high-fat diet induced obese mice. Journal of proteome research. 2011; 10(2):722–31. doi:10. 1021/pr100892rPMID:21047143.
9. Kim HY, Kim M, Park HM, Kim J, Kim EJ, Lee CH, et al. Lysophospholipid profile in serum and liver by high-fat diet and tumor induction in obesity-resistant BALB/c mice. Nutrition. 2014; 30(11–12):1433–41. doi:10.1016/j.nut.2014.04.013PMID:25280424.
10. Schirra HJ, Anderson CG, Wilson WJ, Kerr L, Craik DJ, Waters MJ, et al. Altered metabolism of growth hormone receptor mutant mice: a combined NMR metabonomics and microarray study. PloS one. 2008; 3(7):e2764. doi:10.1371/journal.pone.0002764PMID:18648510; PubMed Central PMCID: PMC2447874.
11. Morris C, O'Grada C, Ryan M, Roche HM, Gibney MJ, Gibney ER, et al. The relationship between BMI and metabolomic profiles: a focus on amino acids. The Proceedings of the Nutrition Society. 2012; 71 (4):634–8. doi:10.1017/S0029665112000699PMID:22863201.
12. Newgard CB, An J, Bain JR, Muehlbauer MJ, Stevens RD, Lien LF, et al. A branched-chain amino acid-related metabolic signature that differentiates obese and lean humans and contributes to insulin resis-tance. Cell Metab. 2009; 9(4):311–26. doi:10.1016/j.cmet.2009.02.002PMID:19356713; PubMed Central PMCID: PMC3640280.
13. Oberbach A, Bluher M, Wirth H, Till H, Kovacs P, Kullnick Y, et al. Combined proteomic and metabolo-mic profiling of serum reveals association of the complement system with obesity and identifies novel markers of body fat mass changes. Journal of proteome research. 2011; 10(10):4769–88. doi:10.1021/ pr2005555PMID:21823675.
14. Mihalik SJ, Goodpaster BH, Kelley DE, Chace DH, Vockley J, Toledo FG, et al. Increased levels of plasma acylcarnitines in obesity and type 2 diabetes and identification of a marker of glucolipotoxicity. Obesity (Silver Spring). 2010; 18(9):1695–700. doi:10.1038/oby.2009.510PMID:20111019; PubMed Central PMCID: PMC3984458.
15. He K, Du S, Xun P, Sharma S, Wang H, Zhai F, et al. Consumption of monosodium glutamate in relation to incidence of overweight in Chinese adults: China Health and Nutrition Survey (CHNS). The American journal of clinical nutrition. 2011; 93(6):1328–36. doi:10.3945/ajcn.110.008870PMID:21471280; PubMed Central PMCID: PMC3095503.
16. North KE, Howard BV, Welty TK, Best LG, Lee ET, Yeh JL, et al. Genetic and environmental contribu-tions to cardiovascular disease risk in American Indians: the strong heart family study. American journal of epidemiology. 2003; 157(4):303–14. PMID:12578801.
17. Zhao J, Zhu Y, Hyun N, Zeng D, Uppal K, Tran VT, et al. Novel metabolic markers for the risk of diabe-tes development in American Indians. Diabediabe-tes care. 2015; 38(2):220–7. doi:10.2337/dc14-2033 PMID:25468946; PubMed Central PMCID: PMC4302260.
18. Panel N. Clinical Guidelines on the Identification, Evaluation, and Treatment of Overweight and Obesity in Adults. Bethesda (MD): National Heart, Lung, and Blood Institute, 1998 Contract No.: 98–4083.
19. Willett W. Food frequency methods. Nutritional Epidemiology. 2nd ed. New York, NY: Oxford Univer-sity Press; 1998. p. 74–91.
20. Lee ET, Welty TK, Fabsitz R, Cowan LD, Le NA, Oopik AJ, et al. The Strong Heart Study. A study of cardiovascular disease in American Indians: design and methods. American journal of epidemiology. 1990; 132(6):1141–55. PMID:2260546.
21. Matthews DR, Hosker JP, Rudenski AS, Naylor BA, Treacher DF, Turner RC. Homeostasis model assessment: insulin resistance and beta-cell function from fasting plasma glucose and insulin concen-trations in man. Diabetologia. 1985; 28(7):412–9. PMID:3899825.
22. Johnson JM, Yu T, Strobel FH, Jones DP. A practical approach to detect unique metabolic patterns for personalized medicine. The Analyst. 2010; 135(11):2864–70. doi:10.1039/c0an00333fPMID: 20838665; PubMed Central PMCID: PMC3069708.
23. Soltow QA, Strobel FH, Mansfield KG, Wachtman L, Park Y, Jones DP. High-performance metabolic profiling with dual chromatography-Fourier-transform mass spectrometry (DC-FTMS) for study of the exposome. Metabolomics: Official journal of the Metabolomic Society. 2013; 9(1 Suppl):S132–S43. doi:10.1007/s11306-011-0332-1PMID:26229523; PubMed Central PMCID: PMC4517297.
Metabolic Profiles of Obesity in American Indians
24. Walker DI, Go Y, Liu K, Pennell KD, Jones DP. Population screening for biological and environmental properties of the human metabolic phenotype: implications for personalized medicine. In: Nicholson J, Darzi A, Holmes E, Lindon JC, editors. Metabolic Phenotyping in Personalized and Public Healthcare Elservier; 2016.
25. Go YM, Walker DI, Liang Y, Uppal K, Soltow QA, Tran V, et al. Reference Standardization for Mass Spectrometry and High-resolution Metabolomics Applications to Exposome Research. Toxicological sciences: an official journal of the Society of Toxicology. 2015; 148(2):531–43. doi:10.1093/toxsci/ kfv198PMID:26358001; PubMed Central PMCID: PMC4675836.
26. Osborn MP, Park Y, Parks MB, Burgess LG, Uppal K, Lee K, et al. Metabolome-wide association study of neovascular age-related macular degeneration. PloS one. 2013; 8(8):e72737. doi:10.1371/journal. pone.0072737PMID:24015273; PubMed Central PMCID: PMC3754980.
27. Park YH, Lee K, Soltow QA, Strobel FH, Brigham KL, Parker RE, et al. High-performance metabolic profiling of plasma from seven mammalian species for simultaneous environmental chemical surveil-lance and bioeffect monitoring. Toxicology. 2012; 295(1–3):47–55. doi:10.1016/j.tox.2012.02.007 PMID:22387982; PubMed Central PMCID: PMC3332037.
28. Yu T, Park Y, Li S, Jones DP. Hybrid feature detection and information accumulation using high-resolu-tion LC-MS metabolomics data. Journal of proteome research. 2013; 12(3):1419–27. doi:10.1021/ pr301053dPMID:23362826; PubMed Central PMCID: PMC3624888.
29. Hughes G, Cruickshank-Quinn C, Reisdorph R, Lutz S, Petrache I, Reisdorph N, et al. MSPrep— sum-marization, normalization and diagnostics for processing of mass spectrometry-based metabolomic data. Bioinformatics. 2014; 30(1):133–4. doi:10.1093/bioinformatics/btt589PMID:24174567; PubMed Central PMCID: PMCPMC3866554.
30. Johnson WE, Li C, Rabinovic A. Adjusting batch effects in microarray expression data using empirical Bayes methods. Biostatistics. 2007; 8(1):118–27. doi:10.1093/biostatistics/kxj037PMID:16632515.
31. Wishart DS, Jewison T, Guo AC, Wilson M, Knox C, Liu Y, et al. HMDB 3.0—The Human Metabolome Database in 2013. Nucleic acids research. 2013; 41(Database issue):D801–7. doi:10.1093/nar/ gks1065PMID:23161693; PubMed Central PMCID: PMC3531200.
32. Sud M, Fahy E, Cotter D, Brown A, Dennis EA, Glass CK, et al. LMSD: LIPID MAPS structure data-base. Nucleic acids research. 2007; 35(Database issue):D527–32. doi:10.1093/nar/gkl838PMID: 17098933; PubMed Central PMCID: PMC1669719.
33. Schymanski EL, Jeon J, Gulde R, Fenner K, Ruff M, Singer HP, et al. Identifying small molecules via high resolution mass spectrometry: communicating confidence. Environmental science & technology. 2014; 48(4):2097–8. doi:10.1021/es5002105PMID:24476540.
34. Storey JD. A direct approach to false discovery rates. J R Stat Soc B. 2002; 64:187–205.
35. Mattson MP. Glutamate and neurotrophic factors in neuronal plasticity and disease. Annals of the New York Academy of Sciences. 2008; 1144:97–112. doi:10.1196/annals.1418.005PMID:19076369; PubMed Central PMCID: PMC2614307.
36. Proulx K, Cota D, Castaneda TR, Tschop MH, D'Alessio DA, Tso P, et al. Mechanisms of oleoylethano-lamide-induced changes in feeding behavior and motor activity. American journal of physiology Regula-tory, integrative and comparative physiology. 2005; 289(3):R729–37. doi:10.1152/ajpregu.00029.2005 PMID:15879057.
37. Grosshans M, Schwarz E, Bumb JM, Schaefer C, Rohleder C, Vollmert C, et al. Oleoylethanolamide and human neural responses to food stimuli in obesity. JAMA psychiatry. 2014; 71(11):1254–61. doi: 10.1001/jamapsychiatry.2014.1215PMID:25229205.
38. Wanders RJ. Peroxisomes, lipid metabolism, and peroxisomal disorders. Molecular genetics and metabolism. 2004; 83(1–2):16–27. doi:10.1016/j.ymgme.2004.08.016PMID:15464416.
39. Zomer AW, van Der Burg B, Jansen GA, Wanders RJ, Poll-The BT, van Der Saag PT. Pristanic acid and phytanic acid: naturally occurring ligands for the nuclear receptor peroxisome proliferator-activated receptor alpha. Journal of lipid research. 2000; 41(11):1801–7. PMID:11060349.
40. Schwartz GJ, Fu J, Astarita G, Li X, Gaetani S, Campolongo P, et al. The lipid messenger OEA links dietary fat intake to satiety. Cell Metab. 2008; 8(4):281–8. doi:10.1016/j.cmet.2008.08.005PMID: 18840358; PubMed Central PMCID: PMC2572640.
41. Contreras AV, Torres N, Tovar AR. PPAR-alpha as a key nutritional and environmental sensor for met-abolic adaptation. Advances in nutrition. 2013; 4(4):439–52. doi:10.3945/an.113.003798PMID: 23858092; PubMed Central PMCID: PMC3941823.
42. Yoon M. The role of PPARalpha in lipid metabolism and obesity: focusing on the effects of estrogen on PPARalpha actions. Pharmacological research: the official journal of the Italian Pharmacological Soci-ety. 2009; 60(3):151–9. doi:10.1016/j.phrs.2009.02.004PMID:19646654.
Metabolic Profiles of Obesity in American Indians
43. Rodriguez de Fonseca F, Navarro M, Gomez R, Escuredo L, Nava F, Fu J, et al. An anorexic lipid medi-ator regulated by feeding. Nature. 2001; 414(6860):209–12. doi:10.1038/35102582PMID:11700558.
44. Escher P, Braissant O, Basu-Modak S, Michalik L, Wahli W, Desvergne B. Rat PPARs: quantitative analysis in adult rat tissues and regulation in fasting and refeeding. Endocrinology. 2001; 142(10):4195– 202. doi:10.1210/endo.142.10.8458PMID:11564675.
45. Izzo AA, Piscitelli F, Capasso R, Marini P, Cristino L, Petrosino S, et al. Basal and fasting/refeeding-reg-ulated tissue levels of endogenous PPAR-alpha ligands in Zucker rats. Obesity. 2010; 18(1):55–62. doi:10.1038/oby.2009.186PMID:19521349.
46. Brown PJ, Mei G, Gibberd FB, Burston D, Mayne PD, McClinchy JE, et al. Diet and Refsum's disease. The determination of phytanic acid and phytol in certain foods and the application of this knowledge to the choice of suitable convenience foods for patients with Refsum's disease. Journal of Human Nutri-tion and Dietetics. 1993; 6(4):295–305. doi:10.1111/j.1365-277X.1993.tb00375.x
47. Verhoeven NM, Jakobs C. Human metabolism of phytanic acid and pristanic acid. Progress in lipid research. 2001; 40(6):453–66. PMID:11591435.
48. van den Brink DM, Wanders RJ. Phytanic acid: production from phytol, its breakdown and role in human disease. Cellular and molecular life sciences: CMLS. 2006; 63(15):1752–65. doi:10.1007/ s00018-005-5463-yPMID:16799769.
49. Pawar A, Jump DB. Unsaturated fatty acid regulation of peroxisome proliferator-activated receptor alpha activity in rat primary hepatocytes. The Journal of biological chemistry. 2003; 278(38):35931–9. doi:10.1074/jbc.M306238200PMID:12853447.
50. Zheng W, Kollmeyer J, Symolon H, Momin A, Munter E, Wang E, et al. Ceramides and other bioactive sphingolipid backbones in health and disease: lipidomic analysis, metabolism and roles in membrane structure, dynamics, signaling and autophagy. Biochim Biophys Acta. 2006; 1758(12):1864–84. doi: 10.1016/j.bbamem.2006.08.009PMID:17052686.
51. Hannun YA, Obeid LM. Principles of bioactive lipid signalling: lessons from sphingolipids. Nat Rev Mol Cell Biol. 2008; 9(2):139–50. doi:10.1038/nrm2329PMID:18216770.
52. Hanamatsu H, Ohnishi S, Sakai S, Yuyama K, Mitsutake S, Takeda H, et al. Altered levels of serum sphingomyelin and ceramide containing distinct acyl chains in young obese adults. Nutrition & diabe-tes. 2014; 4:e141. doi:10.1038/nutd.2014.38PMID:25329603; PubMed Central PMCID:
PMC4217001.
53. Sigruener A, Kleber ME, Heimerl S, Liebisch G, Schmitz G, Maerz W. Glycerophospholipid and sphin-golipid species and mortality: the Ludwigshafen Risk and Cardiovascular Health (LURIC) study. PloS one. 2014; 9(1):e85724. doi:10.1371/journal.pone.0085724PMID:24465667; PubMed Central PMCID: PMC3895004.
54. Hermanussen M, Garcia AP, Sunder M, Voigt M, Salazar V, Tresguerres JA. Obesity, voracity, and short stature: the impact of glutamate on the regulation of appetite. European journal of clinical nutrition. 2006; 60(1):25–31. doi:10.1038/sj.ejcn.1602263PMID:16132059.
55. Hermanussen M, Tresguerres JA. Does high glutamate intake cause obesity? Journal of pediatric endocrinology & metabolism: JPEM. 2003; 16(7):965–8. PMID:14513871.
56. Mangge H, Summers KL, Meinitzer A, Zelzer S, Almer G, Prassl R, et al. Obesity-related dysregulation of the tryptophan-kynurenine metabolism: role of age and parameters of the metabolic syndrome. Obe-sity (Silver Spring). 2014; 22(1):195–201. doi:10.1002/oby.20491PMID:23625535.
57. Favennec M, Hennart B, Caiazzo R, Leloire A, Yengo L, Verbanck M, et al. The kynurenine pathway is activated in human obesity and shifted toward kynurenine monooxygenase activation. Obesity. 2015; 23(10):2066–74. doi:10.1002/oby.21199PMID:26347385.
58. Campbell BM, Charych E, Lee AW, Moller T. Kynurenines in CNS disease: regulation by inflammatory cytokines. Frontiers in neuroscience. 2014; 8:12. doi:10.3389/fnins.2014.00012PMID:24567701; PubMed Central PMCID: PMC3915289.
59. Coppack SW. Pro-inflammatory cytokines and adipose tissue. The Proceedings of the Nutrition Soci-ety. 2001; 60(3):349–56. PMID:11681809.
60. Wolowczuk I, Hennart B, Leloire A, Bessede A, Soichot M, Taront S, et al. Tryptophan metabolism acti-vation by indoleamine 2,3-dioxygenase in adipose tissue of obese women: an attempt to maintain immune homeostasis and vascular tone. American journal of physiology Regulatory, integrative and comparative physiology. 2012; 303(2):R135–43. doi:10.1152/ajpregu.00373.2011PMID:22592557.
61. Brandacher G, Hoeller E, Fuchs D, Weiss HG. Chronic immune activation underlies morbid obesity: is IDO a key player? Current drug metabolism. 2007; 8(3):289–95. PMID:17430117.
62. Bogl LH, Kaye SM, Ramo JT, Kangas AJ, Soininen P, Hakkarainen A, et al. Abdominal obesity and cir-culating metabolites: A twin study approach. Metabolism. 2016; 65(3):111–21. doi:10.1016/j.metabol. 2015.10.027PMID:26892522.
Metabolic Profiles of Obesity in American Indians
63. Tai ES, Tan ML, Stevens RD, Low YL, Muehlbauer MJ, Goh DL, et al. Insulin resistance is associated with a metabolic profile of altered protein metabolism in Chinese and Asian-Indian men. Diabetologia. 2010; 53(4):757–67. doi:10.1007/s00125-009-1637-8PMID:20076942; PubMed Central PMCID: PMC3753085.
64. Després J. Abdominal obesity: the most prevalent cause of the metabolic syndrome and related cardio-metabolic risk. Eur Heart J Suppl. 2006; 8:B4–B12.
65. Snijder MB, van Dam RM, Visser M, Seidell JC. What aspects of body fat are particularly hazardous and how do we measure them? International journal of epidemiology. 2006; 35(1):83–92. doi:10.1093/ ije/dyi253PMID:16339600.
Metabolic Profiles of Obesity in American Indians