Photosynthetic responses of four tropical tree species grown under gap
and understorey conditions in a semi-deciduous forest
GustaVo M. souza
1,4, aGnaldo M. sato
1, Rafael V. RiBeiRo
2and
CaRlos HenRique B. a. PRado
3(received: January 17, 2008; accepted: september 16, 2010)
ABSTRACT − (Photosynthetic responses of four tropical tree species grown under gap and understorey conditions in a semi-deciduous forest). Leaf CO2 assimilation (A) as a function of photosynthetic photon flux density (Q) or intercellular
Co2 concentration (Ci) and chlorophyll fluorescence measurements were carried out on four tropical woody species growing
in forest gap and understorey (Bauhinia forficata link. and Guazuma ulmifolia lam. as pioneers, and Hymenaea courbaril l. and Esenbeckia leiocarpa Engl. as non-pioneers). Chlorophyll fluorescence indicated similar acclimation capacities of photochemical apparatus to contrasting light environments irrespective to plant species. Maximum CO2 assimilation and
quantum yield derived from A/Q curves indicated higher photosynthetic capacity in pioneer than in non-pioneer species in
forest gap. However, the differences among species did not show a straightforward relation with their successional status regarding data derived from A/Q curves under understorey conditions. Both successional groups are able to sustain positive
carbon balance under contrasting natural light availabilities, modifying photochemical and biochemical photosynthetic traits with similar phenotypic plasticity capacity.
Key words - acclimation, chlorophyll fluorescence, forest succession, leaf gas exchange, photosynthetic response curves
RESUMO − (Respostas fotossintéticas de quatro espécies tropicais arbóreas crescidas sob condições de clareira e de sub-bosque em uma floresta semi-decídua). A assimilação de CO2 (A) em função da densidade de fluxo de fótons fotossintéticos (Q)
ou da concentração intercelular de CO2 (Ci), e medidas de fluorescência da clorofila foram realizadas em quatro espécies
tropicais arbóreas em uma clareira e um sub-bosque(Bauhinia forficata link. e Guazuma ulmifolia Lam. como espécies
pioneiras, e Hymenaea courbaril l. e Esenbeckia leiocarpa Engl. como espécies não pioneiras). Os dados de fluorescência da clorofila indicaram que ambos os grupos mostraram capacidade similar de aclimatação do aparato fotoquímico independente do ambiente luminoso. A assimilação máxima de CO2 e a eficiência quântica derivadas das curvas A/Q indicaram maior capacidade
fotossintéticas das espécies pioneiras do que as não-pioneiras na clareira. Entretanto, sob condições de sub-bosque, as diferenças observadas em relação às curvas A/Q não mostraram uma relação direta com o grupo funcional das espécies. Ambos os grupos
da sucessão foram capazes de manter um balanço de carbono positivo sob disponibilidades de luz contrastantes, modificando as características fotoquímicas e bioquímicas da fotossíntese com capacidade de plasticidade fenotípica similar.
Palavras-chave - aclimatação, curvas de resposta fotossintética, florescência da clorofila, trocas gasosas foliares, sucessão florestal
1. Universidade do Oeste Paulista, Laboratório de Ecofisiologia Vegetal, Rodovia Raposo Tavares km 572, 19067-175 Presidente Prudente, SP, Brazil.
2. Instituto Agronômico, Centro de Pesquisa e Desenvolvimento em Ecofisiologia e Biofísica, Caixa Postal 28, 13001-970 Campinas, SP, Brazil.
3. Universidade Federal de São Carlos, Departamento de Botânica, 13565-905 São Carlos, SP, Brazil.
4. Corresponding author: gustavo@unoeste.br
Introduction
Tropical forest environments often show a wide range of light availability either in spatial or temporal scales. Photosynthetic photon flux densities (Q)
varied from 25 µmol m-2 s-1 in early morning to
2,300 µmol m-2 s-1 around midday in gap conditions
while low and diffuse irradiance punctuated by sunflecks
is found in understorey (Bazzaz & Picket 1980, Chazdon
et al. 1996). Therefore, tropical tree species often experience substantial light variation during their life span in forest environments.
In general, tree species may be separated in two successional groups according to spatial and temporal plant distribution in tropical forests: i) early successional species, which are light demanding and named pioneer; ii) late successional species, which are shade tolerant and named late secondary species. These functional groups help to predict the plant community response to environmental changes without requiring detailed information from each species (Lavorel et al. 1997,
a functional group differs consistently on average from another group with respect to a set of target traits (Reich
et al. 2003). Functional group is especially attractive in tropical conditions reducing the number of species to reveal general processes or patterns in ecosystems
(ellis et al. 2000).
Pioneer species exhibit marked reduction of photosynthetic capacity when growing under low light availability as well as high responsiveness to increasing light intensity (Chazdon et al. 1996, strauss-debenedetti
& Bazzaz 1996). On the other hand, many species grown in forest understorey show little or no potential to increase maximum photosynthetic rates in response to increasing light availability (Strauss-Debenedetti & Bazzaz 1996, Ribeiro et al. 2005), which suggests high autonomy in relation to environmental light fluctuations (Souza et al. 2005).
Comparisons between low- and high-light specialists suggest that there are different capacities of light acclimation (Strauss-Debenedetti & Bazzaz 1996). Classical grouping in early and late successional is based essentially on sun/shade adapted dichotomy, through which it is possible to identify a continuum of photosynthetic traits between successional groups of trees. Early successional species would have higher physiological plasticity in relation to late successional species (Bazzaz 1979). However, some shade-adapted species can exhibit substantial photosynthetic plasticity across different light levels (Ellis et al. 2000). late
successional species eventually reach upper forest stratum that characterizes a great potential for photosynthetic acclimation (Pearcy 1987). There is increasing evidence that light-demanding and shade-tolerant species are capable of adjustments in photosynthetic apparatus
(turnbull 1991, Popma et al. 1992). However, leaves of
shade-tolerant species often have lower net photosynthesis
(Koike 1988, Raaimakers et al. 1995) and leaf mass per area (Popma et al. 1992) than light-demanding species,
regardless of light environment.
In general, the capacity of a given tropical tree species to render different phenotypes (plasticity) is possible after long-term exposure to a light environment, which enables plant acclimation. In fact, plant metabolism undergoes acclimation after a prolonged exposure to different growth conditions (Stitt & Hurry 2002, Atkin & Tjoelker 2003, Flexas et al. 2006) that may affect photosynthetic and respiratory rates. The objective of the present study was to test the hypothesis that pioneer and non-pioneer tropical tree species are able to adjust their photosynthetic processes (photochemical and biochemical ones) in both forest gap and understorey for sustaining positive carbon
balance in contrasting light environments. Moreover, considering that photosynthesis is dependent on plant nutritional status, the photosynthetic performance of pioneer species probably is related to a great capacity of nutrient uptake and use (Riddoch et al. 1991, Bazzaz 1996). Therefore, we may expect some variation in the interaction between photosynthetic performance and nutritional status when comparing species in contrasting environments such as forest gap and understorey. Classical pioneer and non-pioneer saplings were grown under natural conditions in forest gap and understorey for testing those hypotheses, evaluating leaf gas exchange, photochemistry, leaf nutritional status, and plant growth traits.
Material and methods
Experimental site, plant species and growth conditions − This study was carried out in a semi-deciduous seasonal forest with 5.5 ha located in Narandiba county, São Paulo, Brazil (22°24’ S; 51°31’ W, 354 m a.s.l.). The gap size was 34.5 m2,
corresponding to a small gap with canopy openness around 10%. Small gap is far more frequent in tropical forest than large ones (Martins & Rodrigues 2002). Soil samples were collected at 20 cm of depth for chemical analysis in both forest gap and understorey. The soil of the area is a ultisol type, and its nutritional status in forest gap and understorey were respectively: 0.3 and 1.1 mmolC K
+ dm-3; 1.0 and
4.0 mmolC Ca
+2 dm-3; 1.0 and 2.0 mmol C Mg
+2 dm-3; 9.6
and 8.7 mg S-SO4
-2 dm-3; 4.6 and 9.6 mg Mn dm-3; 70.1 and
87.5 mg Fe dm-3; and 8.0 mg P dm-3. The pH value (in CaCl 2)
of soil solution was 3.8 and 4.0 and the organic matter was 17 and 19 g dm-3 for soil samples collected in forest gap and
in understory respectively.
Four woody species from different successional groups were studied: Bauhinia forficata link (Caesalpinioideae) and
Guazuma ulmifolia lam. (sterculiaceae) are putative pioneer species, and Hymenaea courbaril l. (Caesalpinioideae) and Esenbeckia leiocarpa Engl. (Rutaceae) are considered late successional species (Lorenzi 1992). B. forficata and G.
ulmifolia grow in secondary forests up to 9 and 16 m tall,
respectively, being semi-deciduous and light demanding species. H. courbaril is a typical late secondary species growing up to 20 m tall with widespread distribution in semi-deciduous Brazilian forests. E. leiocarpa occurs in primary forests being shade tolerant with maximum height of 30 m and sensitive to high irradiance during initial development (Lorenzi 1992).
functional group. Ten saplings of each species were planted in forest gap and understorey with a minimum distance of 1.0 m from each other. Physiological measurements were taken six months after planting on fully expanded leaves developed in forest gap (G) or understorey (U). We considered that the
growth of new cohort of leaves was an evidence of plant acclimation to each forest site.
Physiological evaluations − The measurements of physiological variables were taken during sunny days, with air temperature (Tair), photosynthetic photon flux density (Q) and minimum relative humidity (RHmin) varying in forest
gap (G) and understory (U) as follows: Tair = 20 to 36 °C in G and 18 to 30 °C in U; Q = 1,600 ± 200 µmol m-2 s-1 in
G and 30 ± 5 µmol m-2 s-1 in U; and RHmin = 25 ± 3% in G
and 36 ± 4% in U. Non-significant changes were observed
in relation to gap openness or light conditions in each forest site during the period of evaluation. All physiological measurements were carried out when plants were not under water deficit, given by leaf water potential at pre-dawn around – 0.5 MPa measured with a pressure chamber (model PMS 1000, PMs instruments, usa).
Chlorophyll fluorescence was evaluated with a portable fluorescence system model FMS 2 (Hansatech Instruments, UK) in mature (but not senescent) fully expanded leaves without signals of herbivory and free of moss or fungi. Measurements light using a modulating beam (< 0.05 µmol m-2 s-1 with duration pulses of 1.8 µsec) and
saturating pulses (18,000 µmol m-2 s-1 during 1.5 s) were
provided by a fiber-optic placed in a grooved neck at 60° to the leaf surface. Maximal (Fm) and basal (F0) fluorescence
signals were measured after 30 min of dark adaptation. Variable fluorescence (Fv) was calculated as Fv = Fm – F0. instantaneous (Fs) and maximum (Fm’) fluorescence
signals were recorded in light-adapted leaves. Light-adapted variable fluorescence (∆F) was obtained as ∆F = Fm’ – Fs. The following chlorophyll fluorescence variables were calculated to evaluate photochemical performance under different light conditions: maximum (Fv/Fm) and actual (∆F/Fm’) quantum yield of primary photochemistry (Genty
et al. 1989) and apparent electron transport rate (ETR =
∆F/Fm’ x Q x 0.5 x 0.84) (Krall & Edwards 1992). For ETR
calculation it was adopted 0.5 as the fraction of excitation energy distributed to PSII and 0.84 was the fraction of total Q absorbed by leaves (Demmig & Björkman 1987).
Chlorophyll fluorescence was evaluated from 8h00 to 16h00 in both forest environments (gap and understorey) during a sunny day. Only maximum and minimum values of Fv/Fm, ∆F/Fm’ and ETR are shown because we did
not find any significant difference in diurnal dynamics of such photochemical variables when comparing the species in the same light environment. Environmental conditions during evaluations of chlorophyll fluorescence in forest gap (G) and understorey (U) in early morning
were, respectively: Tair = 22 ± 2 °C (G) and 20 ± 2 °C (U);
leaf-to-air vapor pressure difference (VPD) = 1.4 ± 0.2 kPa
(G) and 1.6 ± 0.1 kPa (U); Q = 50 ± 16 µmol m-2 s-1 (G) and
30 ± 5 µmol m-2 s-1 (U) in early morning;, and around midday;
tair = 30 ± 3 °C (G) and 27 ± 3 °C (U); VPD = 2.0 ± 0.5 kPa
(G) and 1.7 ± 0.2 kPa (U); and Q = 1600 ± 123 µmol m-2 s-1
(G) and 50 ± 23 µmol m-2 s-1 (U) around midday. air Co 2
concentration was 370 ± 10 µmol mol-1 in both sites.
Photosynthetic responses to increasing light (A/Q) and intercellular Co2 concentration (A/Ci) were evaluated with a
portable infrared gas analyzer model CIRAS-2 (PPSystems, UK) in the same leaves used in chlorophyll fluorescence measurements. Leaf CO2 assimilation (A) was measured
over a range of Q from 1500 to 0 µmol m-2 s-1, after 3 to
5 min. under each Q intensity. This period was enough to
reach a coefficient of variation (CV) regarding ∆Co2 lower
than 1.0%. A/Q curves were performed between 9h00 and
15h00 in a sunny day in both light environments. Leaf gas exchange was evaluated under air CO2 concentration of
370 ± 10 μmol mol-1, while T
air and VPD were not controlled
as our intention was to measure leaf gas exchange near to natural conditions.
The A/Ci response curves were also taken using
the CIRAS-2 system in the same leaves evaluated in A/Q
curves. intercellular Co2 concentration (Ci) was changed
by oversetting the air CO2 concentration (Ca) inside leaf
chamber between 0 and 100 Pa as described by Long &
Bernacchi (2003). Data were recorded when low CV values (< 1.0%) of A were observed, which occurred after 3 to 5 min
in each Ca concentration. A/Ci curves were performed in
both environmental conditions at Q = 1000 µmol m-2 s-1.
Some photosynthetic variables were derived from A/Ci
curves: photosynthetic capacity given by maximum CO2
assimilation; apparent carboxylation efficiency (k) estimated using the initial linear slope of A/Ci curves; and relative stomatal limitation of photosynthesis (Ls), as proposed by Farquhar & Sharkey (1982):
Ls = [(A’ – A)/A’]*100,
in which: A’ is the net CO2 assimilation when Ci is
370 μmol mol-1, A is the net CO
2 assimilation under regular
Ci (220 ± 10 μmol mol-1) when Ca = 370 µmol mol-1.
Both A/Q and A/Ci response curves were fitted using the
following equation (Prado & Moraes 1997):
A = Amax (1 – e-c(x – CP)),
in which: A is the CO2 assimilation, Amax is the maximum CO2
assimilation (named photosynthetic capacity in A/Ci curve), c is the constant related to the curve. The parameter x is Q or
Ci, and the parameter CP is the light or the CO2 compensation
point in A/Q and A/Ci response curves, respectively. tair
and VPD during A/Q and A/Ci curves were: 28 ± 2 °C and
1.6 ± 0.4 kPa in gap and 26 ± 4 °C and 1.7 ± 0.3 kPa in understorey. At least three A/Q and three A/Ci curves were
performed per species in each light environment.
with a digital planimeter (Li-3000A, Licor, USA). Afterwards, the leaf dry mass was determined and the ratio leaf dry mass per unit of leaf area (LMA) was calculated. Leaf dry mass was
obtained after drying leaf tissues at 60 °C until constant mass. The maximum CO2 assimilation on area (Aarea) and mass
(Amass) basis were calculated. Mass-based shows higher
relationship with plant growth than area-based photosynthesis (Reich et al. 1998) and are in accordance to the idea that mass-based evaluations are more relevant to measure plant energetics than area-based gas exchange rates (Reich et al. 1992).
Plant growth and leaf nutritional status – Plant growth was evaluated considering plant height (H) and stem diameter (D) at 5 cm above soil surface. Growth was estimated considering measurements taken in an interval of six months, starting at planting date. Plant height was measured with metric tape and stem diameter with a digital caliper.
Leaves similar to those evaluated for physiological traits were collected in five plants of each species at each forest site to determine the nutritional status. Leaf contents of nitrogen (N), phosphorus (P), calcium (Ca), magnesium (Mg), iron (Fe) and sulphur (S) were assessed. Leaf N content was determined by the Kjehldal method, i.e. digestion in concentrated sulfuric acid followed by distillation and titration. The other elements were determined by spectrophotometry of atomic absorption, according to Malavolta et al. (1997). Maximum CO2
assimilation values found in both A/Q and A/Ci curves were
calculated in both N (AN) and P (AP) basis for evaluating the
photosynthetic efficiency in relation to these nutrients (Reich et al. 1995) often limiting in tropical soils.
Data analysis − Physiological and nutritional data were subject to analysis of variance (ANOVA, P = 0.05), being
the mean values (n = 3 or 4 for physiological variables; n = 5 for nutritional data) compared by the Tukey test (P = 0.05) when statistical significance was detected. Phenotypic plasticity index (PPI) was estimated from data obtained in A/Ci and A/Q curves and from plant growth measures. PPI was
calculated for each single physiological parameter between the two forest environment (gap and understorey) following Rozendaal et al. (2006) and Valladares et al. (2006) as:
PPI = (maximum mean – minimum mean) (maximum mean)-1
Results
Leaf nutritional status and plant growth − In both sites, the highest leaf N content was found in pioneer
B. forficata and in the non-pioneer E. leiocarpa (table
1). Forest environments did not cause changes in leaf N content when considering the same species, except for G. ulmifolia that showed higher leaf N content in understorey than in gap. Leaf P content did not show any significant difference between forest environments or among species, ranging from 1.6 to 2.9 mg g-1. With
exception of G. ulmifolia, leaf S content was higher in plants grown in forest gap. The concentrations of Fe was remarkably higher in understorey for all species,
mainly in E. leiocarpa. Changes observed on Ca and Mg
leaf contents between environments were not related to
plant species (table 1).
Leaf mass per area (LMA) was significantly higher
in forest gap than in understorey for all species, except for the non-pioneer H. courbaril that exhibited low
PPI (0.04) of LMA between environments (table 2).
G. ulmifolia, H. courbaril and E. leiocarpa showed
higher and similar LMA in forest gap. Non-pioneers H.
courbaril and E. leiocarpa had higher LMA than pioneers
in understorey (table 2). In forest gap, pioneer species
B. forficata showed the tallest individuals as well as the greatest stem diameter. There was non-significant difference in plant height between pioneer G. ulmifolia
and non-pioneer E. leiocarpa in forest gap (table 2).
Table 1. Leaf contents of nitrogen (N), phosphorus (P), calcium (Ca), magnesium (Mg), iron (Fe) and sulphur (S) in pioneer (Guazuma ulmifolia, Bauhinia forficata) and non-pioneer (Hymenaea courbaril, Esenbeckia leiocarpa) tropical tree species grown under forest gap (G) and in understorey (U). Different capital letters indicate significant (P < 0.05) difference among
species in the same site and different small letters significant difference between sites for the same species. ns denotes non-significant differences (P > 0.05). Data refer to mean values (n = 5).
nutrient content
Pioneers non-pioneers
G. ulmifolia B. forficata H. courbaril E. leiocarpa
G U G U G U G U
N (mg g-1) 19.7Bb 024.4Ba 31.9aa 032.7aa 19.0Ba 017.4Ca 031.4aa 028.5aBa
P (mg g-1) 01.8ns 002.9 01.2 001.7 02.0 001.6 002.2 002.2
Ca (mg g-1) 08.0ab 012.5aa 04.8aBa 005.7Ba 02.1Bb 004.1Ba 010.0aa 006.2Bb
Mg (mg g-1) 04.8ab 005.9aa 03.0Ba 003.1Ba 02.1Ba 002.2Ba 002.2Bb 003.8aBa
S (mg g-1) 04.0aa 003.9aa 04.2aa 003.0ab 03.3Ba 002.3Bb 003.3Ba 001.9Bb
Individuals grown in understorey were shorter than those grown in gap, except for G. ulmifolia that showed the lowest PPI (0.03). Stem diameter was also higher
in gap than in understorey conditions, with exception
Table 2. Leaf mass per area (LMA), plant height (H) and stem diameter (D) in pioneer (Guazuma ulmifolia, Bauhinia forficata) and non-pioneer (Hymenaea courbaril, Esenbeckia leiocarpa) tropical tree species grown in forest gap (G) and understorey (U). Different capital letters indicate significant (P < 0.05) difference among species in same site while different small letters
indicate significant differences between sites for same species. Data refer to mean values (n = 5). Phenotypic plasticity index
(PPI) for each variable between environments is shown in italics.
Variables
Pioneers non-pioneers
G. ulmifolia B. forficata H. courbaril E. leiocarpa
G U G U G U G U
LMA (mg cm-2) 4.8aBa 2.4Bb 4.0Ba 1.7Bb 4.9aBa 4.7aa 5.8aa 3.1aBb
PPI 0.50 0.57 0.04 0.46
H (cm) 146Ba 142aa 225aa 77Bb 95Ca 78Bb 160Ba 68Bb
PPI 0.03 0.66 0.18 0.57
D (cm) 22Ba 13ab 27aa 7Bb 15Ca 13aa 21Ba 6Bb
PPI 0.41 0.74 0.13 0.71
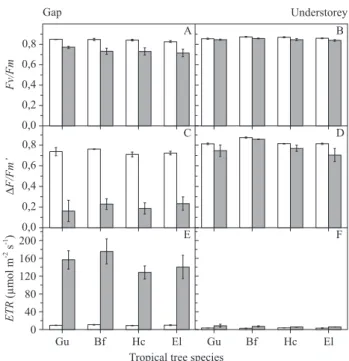
Figure 1. Maximum (Fv/Fm, in a-B) and actual (∆F/Fm’, in C-D) quantum yield of primary photochemistry and apparent electron transport rate (ETR, in E-F) in early morning (07h30,
white column) and around midday (11h00, grey column) in pioneer (Gu = Guazuma ulmifolia;Bf = Bauhinia forficata) and non-pioneer (Hc = Hymenaea courbaril;el = Esenbeckia leiocarpa) tropical tree species grown under forest gap (A, C, E) and understorey (B, D, F). Each column represents the mean value ± standard deviation (n = 3). Gray columns represent data recorded at midday and white columns represent data recorded at early morning.
of H. courbaril (table 2). Taking into account plant growth traits, H. courbaril showed low values of PPI,
while B. forficata and E. leiocarpa exhibited high PPI (table2).
Chlorophyll fluorescence in forest gap and understorey
− Irrespective to functional groups (pioneer and non-pioneer), diurnal light changes had similar effects on plant photochemistry in both forest environments. High light availability around midday in gap resulted in significant decrease of maximum (Fv/Fm) and actual (∆F/Fm’) quantum yield of primary photochemistry and
significant increase of apparent electron transport rate
(ETR) in all tree species (figure 1A,C,E). On the other
hand, tree species showed similar values of Fv/Fm,
∆F/Fm’ and ETR in early morning and around midday in
forest understorey, where there was low light availability throughout the daytime (figure 1B,D,F). Pioneer and non-pioneer species did not exhibit significant differences
about Fv/Fm, ∆F/Fm’ and ETR in both light environments
(figure 1).
Plasticity in photosynthetic response to light (A/Q curves)
− Differences in initial linear region, maximum A, and
light saturation of A were observed comparing a same
species in both environments (figure 2A, C, E, G and table 3). Maximum CO2 assimilation per area (Aarea), mass (Amass) and on leaf N content (AN) bases were
significantly higher in forest gap than in understorey in all species, with exception of non-pioneer E. leiocarpa
that showed relatively low PPI values (table 3). Pioneer
B. forficata showed the highest Aarea in forest gap. AN
Figure 2. Response of leaf CO2 assimilation to increasing photosynthetic photon flux density (A/Q curves in a, C, e, G) and
intercellular Co2 concentration (A/Ci curves in B, d, f, H) in pioneer (Guazuma ulmifolia, in a, B; Bauhinia forficata in C,
d) and non-pioneer (Esenbeckia leiocarpa, in e, f; Hymenaea courbaril, in G, H) tropical tree species grown in forest gap (open circles) and in understorey (closed circles). Each symbol is the mean value ± standard deviation (n = 3). ( = understorey,
no significant differences among tree species when considering Aarea and AN; but Amass was significantly
higher in B. forficata (table 3). The CO2 assimilation
per mol of leaf P (AP) was significantly higher in gap
(with exception of E. leiocarpa) despite non-significant differences in leaf P content among species in both sites (tables 1 and 3). Differences in AP among species were
smoothed in understorey (table 3) and the pioneer B. forficata showed the highest AP in both environments.
The overall quantum yield (α) was higher in plants of both functional groups growing in understorey, but G.
ulmifolia and E. leiocarpa showed the same efficiency
of light use between environments (table 3). Low α values were found in non-pioneer species in both forest gap (H. courbaril) and understorey (E. leiocarpa). Light compensation (LCP) and saturation (LSP) points were
consistently higher in plants grown in forest gap than in understorey. The highest and the lowest LCP were observed in non-pioneer species, E. leiocarpa and H.
courbaril, respectively (table 3). Regardless of tree species, leaf dark respiration (Rd) was at least two-fold
higher in forest gap than in understorey. The non-pioneer
species H. courbaril showed the lowest Rd values in
both environments (table 3).
Plasticity in photosynthetic response to intercellular
Co2 concentration (A/Ci curves) − In average (table
4), the non-pioneer species H. courbaril showed PPI
values (0.45) two-fold higher than the other species (0.25). Higher photosynthetic capacity (given by the maximum A value) was observed in forest gap, where A saturation by Ci and the initial linear slope of A/Ci
curve were usually higher than in understorey (figure 2). The pioneer B. forficata showed the highest Amass
in forest gap (table 4). However, net photosynthesis measured on area bases was similar in B. forficata and
H. courbaril, a non-pioneer species with relative high
AN in both forest sites. Non-pioneer species E. leiocarpa
exhibited the lowest values of Aarea, Amass and AN in
gap (table 4). In general, Amass was similar between
environments (table 4) whereas Aarea was consistently
lower in understorey than in gap for all tree species. One exception was H. courbaril that exhibited higher Amass and AN in gap than in understorey.
Table 3. Photosynthetic variables derived from A/Q curves performed in leaves of pioneer (Guazuma ulmifolia, Bauhinia
forficata) and non-pioneer (Hymenaea courbaril, Esenbeckia leiocarpa) species grown in forest gap (G) and understorey (U): maximum CO2 assimilation expressed on area (Aarea, µmol m-2 s-1), mass (Amass, nmol g-1 s-1), n (AN, µmol mol N-1 s-1) and P
content (AP, mmol mol P-1 s-1) basis; light compensation (LCP, µmol m-2 s-1) and saturation (LSP, µmol m-2 s-1) points; overall
quantum yield (α, µmol mol-1) and leaf dark respiration (Rd, µmol m-2 s-1). Different capital letters indicate significant (P < 0.05)
difference among species in same site and different small letters significant difference between sites for same species. Data refer to mean values (n = 3 or 4). Phenotypic plasticity index (PPI) for each variable between environments is shown in italics.
derived variables
Pioneers non-pioneers
G. ulmifolia B. forficata H. courbaril E. leiocarpa
G U G U G U G U
Aarea 15.1Ba 3.8ab 27.5aa 4.2ab 17.3Ba 5.9ab 6.9Ca 5.3aa
PPI 0.75 0.85 0.66 0.23
Amass 329.5Ba 161.6Bb 686.0aa 262.1ab 360.1Ba 126.9Bb 120.1Ca 170.8Ba
PPI 0.51 0.62 0.65 0.30
AN 234.6aa 94.2ab 301.4aa 114.2ab 262.2aa 102.4ab 54.1Ba 84.8aa
PPI 0.60 0.62 0.61 0.36
AP 5.7Ba 2.1Bb 17.7aa 5.3ab 5.6Ba 2.7Bb 1.7Ca 2.4Ba
PPI 0.63 0.70 0.52 0.29
α 0.032aa 0.032aa 0.022ab 0.043aa 0.015Bb 0.031aBa 0.024aa 0.026Ba
PPI 0.0 0.49 0.52 0.08
LCP 75Ba 29Bb 138aa 39Bb 118aa 20Cb 172aa 54ab
PPI 0.61 0.72 0.83 0.69
LSP 987aa 591ab 1192aa 527ab 1195aa 605ab 992aa 581ab
PPI 0.40 0.56 0.49 0.41
Rd 3.2aa 0.7Bb 3.2aa 1.7aa 1.7Ba 0.4Bb 3.1aa 1.3ab
Table 4. Photosynthetic variables derived from A/Ci curves performed on leaves of pioneer (Guazuma ulmifolia, Bauhinia
forficata) and non-pioneer (Hymenaea courbaril, Esenbeckia leiocarpa) tropical tree species grown under forest gap (G) and understorey (U): maximum CO2 assimilation on area (Aarea, µmol m
-2 s-1) on mass (Amass, µmol g-1 s-1) and n
(AN, µmol mol N-1 s-1) basis; apparent carboxylation efficiency (k, µmol m-2 s-1 Pa-1); and stomatal limitation of photosynthesis
(Ls, %). Different capital letters indicate significant (P < 0.05) difference among species in same site and different small letters
significant differences between sites for same species. Data refer to mean values (n = 3 or 4). Phenotypic plasticity index (PPI) for each variable between environments is shown in italics.
derived variables
Pioneers non-pioneers
G. ulmifolia B. forficata H. courbaril E. leiocarpa
G U G U G U G U
Aarea 19.5Ba 11.6ab 25.6aa 12.5ab 26.4aa 14.2ab 18.4Ba 12.1ab
PPI 0.40 0.51 0.46 0.34
Amass 415.6Ba 485.8Ba 645.2aa 778.0aa 547.5aBa 305.1Bb 327.5Ba 383.3Ba
PPI 0.14 0.17 0.79 0.15
AN 296.1Ba 278.9aBa 284.1Ba 338.5aa 406.0aa 246.3aBb 149.3Ca 188.9Ca
PPI 0.06 0.16 0.39 0.20
k 0.090aa 0.053ab 0.090aa 0.051ab 0.095aa 0.061ab 0.060Ba 0.058aa
PPI 0.41 0.43 0.36 0.03
Ls 16.2Ba 20.1aBa 20.2Ba 22.1aa 34.3aa 26.3ab 31.4aa 14.1Bb
PPI 0.19 0.09 0.23 0.55
All species had higher apparent carboxylation efficiency (k) in gap than in understorey, with exception of E. leiocarpa that had low PPI (0.03). The stomatal
limitation of photosynthesis (Ls) was high (> 30%) in
non-pioneer species grown in forest gap (table 4).
Discussion
Our results indicated that tree species of different successional status were able to acclimate under contrasting light availabilities, exhibiting changes in leaf morphology (table 2) and photosynthesis (tables 3 and 4), as well as in leaf nutritional contents (table 1). For instance, the non-pioneer species H. courbaril exhibited the same trend observed in pioneer species (figure 2G), with high photosynthetic plasticity and high acclimation capacity to high light availability under gap conditions. In fact, some shade-tolerant or non-pioneer species may have significant ability to increase photosynthetic capacity in response to increasing light availability but this adjustment has been observed within a restricted range of light conditions (Chazdon 1992, Chazdon et
al. 1996). Moreover, similar photochemical responses
(figure 1) indicated that pioneer and non-pioneer species have similar acclimation capacity of photochemical apparatus in contrasting light environments. This assumption is supported by the non-occurrence of chronic photoinhibition in non-pioneer species grown
in forest gap (given by high Fv/Fm in early morning
shown in figure 1) as well as by high A values found in
pioneer species grown in forest understorey (figure 2). Accordingly, Ribeiro et al. (2005) did not find patterns of photochemical response between pioneer and non-pioneer species when growing seven tropical tree species under contrasting irradiance regimes.
The phenotypic plasticity was variable among
species, as indicated by PPI. For instance, the non-pioneer species H. courbaril showed the lowest PPI
in growth traits (table 2), while it exhibited high PPI
values in photosynthetic traits, similar to those found
in pioneer species (tables 3 and 4). additionally, E.
leiocarpa (non-pioneer) showed high plasticity in growth (table 2) and relatively low plasticity in photosynthesis (table 3). The pioneer species B. forficata exhibited high plasticity in all physiological traits, while plasticity in
G. ulmifolia varied according to the set of physiological
traits observed.
Our data revealed that pioneer and non-pioneer tree species have similar photosynthetic plasticity despite the differences in their leaf nutritional status. This conclusion is in accordance with Turnbull (1991), Popma et al. (1992) and ellis et al. (2000). These authors reported
reported that short-lived pioneer species showed the lowest plasticity to irradiance.
Alternative hypotheses about plasticity in successional groups should be considered to understand forest dynamics. According to Popma et al. (1992),
plasticity is greater for all species that experience a large ontogenetic change in irradiance during life cycle. Another hypothesis states that plasticity in pioneer and non-pioneer species is greater for those leaf traits that are more important for successful performance in high or low light environment (Valladares et al. 2002). Accordingly, many shade-tolerant species have significant plasticity of photosynthetic capacity within a range from 1% to 20% of full sunlight, which is commonly found in small gaps (Chazdon et al. 1996). late successional
species in our study were grown under gap conditions with nearly 70% of full sunlight, indicating significant photosynthetic plasticity.
In conclusion, the data presented herein have ecophysiological relevance since small gaps are far more frequent than large ones, accounting for virtually a large part of the environment dynamics in a semideciduous forest (Martins & Rodrigues 2002). Furthermore, some phytossociological studies in tropical forest succession have shown that late successional species play a significant role in gap restoration, which clearly indicates the ability of such group to face the environmental fluctuations in forest gap (Tabarelli & Mantovani 1999, Martinez-Garza et al. 2005). Accordingly, our data support the assumption that some species considered as late successional could co-exist with pioneer species under similar environmental conditions. Therefore, the gap regeneration, mainly the small ones, would include the participation of pioneer and non-pioneer species (specially those with high phenotypic plasticity) at the same time, which could also be considered as a basis for recovery of degraded areas.
Acknowledgements – This study was supported by the Fundação de Amparo a Pesquisa do Estado de São Paulo (Fapesp, grant no 03/06939-5). G.M.s., R.V.R. and C.H.B.a.P.
are grateful to the Conselho Nacional de Desenvolvimento Científico e Tecnológico (CNPq) for fellowships granted.
References
ATKIN, O.K. & TjOELKER, M.G. 2003. Thermal acclimation and the dynamic response of plant respiration to temperature. trends in Plant science 8:343-351. Bazzaz, f.a. 1979. The physiological ecology of plant
succession. Annual Review of Ecology and Systematics 10:351-371.
Bazzaz, f.a. 1996. Plants in changing environment: linking physiological, population and community ecology. Cambridge University Press, Cambridge.
BAZZAZ, F.A. & PICKETT, S.T.A. 1980. Physiological ecology of tropical succession: a comparative review. Annual Review of Ecology and Systematics 11:287-310.
CHazdon, R.l. 1992. Photosynthetic plasticity of two rainforest shrubs across natural gap transects. Oecologia 92:586-595.
CHAZDON, R.L., PEARCY, R.W., LEE, D.W. & FETCHER, n. 1996. Photosynthetic responses of tropical forest plants to contrasting light environments. In tropical forest plant ecophysiology (S.S. Mulkey, R.L. Chazdon & A.P. Smith, eds.). Chapman & Hall, New York, p.5-55.
DEMMIG, B. & BjÖRKMAN, O. 1987. Comparison of the effects of excessive light on chlorophyll fluorescence and photon yield of O2 evolution in leaves of higher
plants. Planta 171:171-184.
ELLIS, A.R., HUBBELL, S.P. & POTVIN, C. 2000. In situ field measurements of photosynthetic rates of tropical tree species: a test of the functional group hypothesis. Canadian journal of Botany 78:1336-1347.
FARQUHAR, G.D. & SHARKEY, T.D. 1982. stomatal conductance and photosynthesis. Annual Review of Plant Physiology 33:317-345.
fleXas, J, Bota, J., GalMÊs, J., MedRano, H. & RIBAS-CARBÓ, M. 2006. Keeping a positive carbon balance under adverse conditions: responses of photosynthesis and respiration to water stress. Physiologia Plantarum 127:343-352.
GENTY, B., BRIANTAIS, j.M. & BAKER, N.R. 1989. The relationship between quantum yield of photosynthetic electron transport and quenching of chlorophyll fluorescence. Biochemica et Biophysica Acta 990:87-92. HooPeR, d. 1998. The role of complementarity and
competition in ecosystem responses to variation in plant diversity. Ecology 79:704-719.
KoiKe, t. 1988. Leaf structure and photosynthetic performance as related to the forest succession of deciduous broad-leaved trees. Plants Species Biology 3:77-87.
KRALL, j.P. & EDWARDS, G.E. 1992. Relationship between photosystem activity and CO2 fixation in leaves.
Physiologia Plantarum 86:180-187.
LAVOREL, S., MCINTYRE, S., LANDSBERG, j. & foRBes, t.d.a. 1997. Plant functional classifications: from general groups to specific groups based on response to disturbance. Trends in Ecology and Evolution 12:474-478.
loRenzi, H. 1992. Árvores brasileiras: manual de identificação e cultivo de plantas arbóreas nativas do Brasil. Plantarum, nova odessa.
MALAVOLTA, E., VITTI. G.C. & OLIVEIRA, S.A. 1997. Avaliação do estado nutricional das plantas: princípios e aplicações. 2a ed. Potafos, Piracicaba.
MaRtinez-GaRza, C., PeÑa, V., RiCKeR, M., CAMPOS, A. & HOWE, H.F. 2005. Restoring tropical biodiversity: leaf traits predict growth and survival of late-successional trees in early-late-successional environments. Forest, Ecology and Management 217:365-379. MARTINS, S.V. & RODRIGUES, R.R. 2002. Gap-phase
regeneration in a semideciduous mesophytic Forest, south-eastern Brazil. Plant Ecology 163:51-62.
PeaRCY, R.W. 1987. Photosynthetic gas exchange responses of Australian tropical forest trees in canopy, gap and understorey micro-environments. Functional Ecology 1:169-178.
POPMA, j., BONGERS, F. & WERGER, M.j.A. 1992. Gap-dependence and leaf characteristics of trees in a tropical rain forest in Mexico. Oikos 63:207-214.
PRADO, C.H.B.A. & MORAES, j.A.P.V. 1997. Photosynthetic capacity and specific leaf mass in twenty woody species of cerrado vegetation under field conditions. Photosynthetica 33:103-112.
RaaiMaKeRs, d., Boot, R.G.a., diJKstRa, P., Pot. s. & PONS, T. 1995. Photosynthetic rates in relation to leaf phosphorus content in pioneer versus climax tropical rain forest trees. Oecologia 102:120-125.
REICH, P.B., WALTERS, M.B. & ELLSWORTH, D.S. 1992. Leaf lifespan in relation to leaf, plant and stand characteristics among diverse ecosystems. Ecological Monographs 62:365-392.
REICH, P.B., KLOEPPEL, B.D., ELLSWORTH, D.S. & WalteRs, M.B. 1995. Different photosynthesis-nitrogen relations in deciduous hardwood and evergreen coniferous tree species. Oecologia 104:24-30.
ReiCH, P.B., WalteRs, M.B., tJoelKeR, M.G., VANDERKLEIN, D. & BUSCHENA, C. 1998. Photosynthesis and respiration rates depend on leaf and root morphology and nitrogen concentration in nine boreal tree species differing in relative growth rate. Functional Ecology 12:395-405.
ReiCH, P.B., BusCHeRa, C., tJoelKeR, M.G., WRaGe, K., KNOPS, j., TILMAN, D. & MACHADO, j.L. 2003. Variation in growth rate and ecophysiology among 34 grassland and savanna species under contrasting N supply: a test of functional group differences. New Phytologist 157:617-631.
RIBEIRO, R.V., SOUZA, G.M., OLIVEIRA, R.F. & MaCHado, e.C. 2005. Photosynthetic responses of tropical tree species from different successional groups under contrasting irradiance conditions. Revista Brasileira de Botânica 28:149-161.
RIDDOCH, I., LEHTO, T. & GRACE, j. 1991. Photosynthesis of tropical tree seedlings in relation to light and nutrient supply. New Phytologist 119:137-147.
ROZENDAAL, D.M.A., HURTADO, V.H. & POORTER, L. 2006. Plasticity in leaf traits of 38 tropical tree species in response to light; relationships with light demand and adult stature. Functional Ecology 20:207-216.
SOUZA, G.M., RIBEIRO, R.V., OLIVEIRA, R.F. & MaCHado, e.C. 2005. Network connectance and autonomy analyses of the photosynthetic apparatus in tropical tree species from different successional groups under contrasting irradiance conditions. Revista Brasileira de Botânica 28:47-59.
STITT, M. & HURRY, V.M. 2002. A plant for all seasons: alteration in photosynthetic carbon metabolism during cold acclimation in Arabidopsis. Current opinion in Plant Biology 5:199-206.
STRAUSS-DEBENEDETTI, S. & BAZZAZ, F.A. 1996. Photosynthetic characteristics of tropical trees along successional gradients. In Tropical forest plant
ecophysiology (S.S. Mulkey, R.L. Chazdon & A.P. Smith, eds.). Chapman & Hall, New York. p.162-186. TABARELLI, M. & MANTOVANI, W. 1999. A regeneração
de uma floresta tropical montana após corte e queima (São Paulo, Brasil). Revista Brasileira de Biologia 59:239-250.
tilMan, d. 1997. Community invisibility, recruitment limitations, and grassland biodiversity. Ecology 78:81-92.
tuRnBull, M.H. 1991. The effect of light quantity and quality during development on the photosynthetic characteristics of six Australian rain-forest tree species. Oecologia 87:110-117.
ValladaRes, f., CHiCo, J.M., aRanda, i., BalaGueR, l., dizenGReMel, P., MaRinque, E. & DREYER, E. 2002. Greater high light seedling tolerance of Quercus robur over Fagus sylvatica is linked to a greater physiological plasticity. Trees, Structure and function 16:395-403.