DOI: 10.4025/jphyseducx.v28i1.2813
Original Article
INFLUENCE OF CUT-POINTS TO MEASUER AND CLASSIFY THE PHYSICAL ACTIVITY LEVEL OF OLDER ADULTS
INFLUÊNCIA DOS PONTOS DE CORTE PARA MENSURAR E CLASSIFICAR O NÍVEL DE ATIVIDADE FÍSICA EM IDOSOS
Fernanda Christina de Souza Guidarini1, Samantha Nahas Guimarães2, Pablo Antonio Bertasso de Araujo1, Adriano Ferreti Borgatto3 and Tânia Rosane Bertoldo Benedetti3
1
Universidade do Estado de Santa Catarina, Florianópolis-SC, Brasil.
2
Fundação Catarinense de Educação Especial, São José-SC, Brasil.
3
Universidade Federal de Santa Catarina, Florianopólis-SC, Brasil.
RESUMO
O acelerômetro mede a intensidade de maneira indireta, tornando fundamental a escolha do ponto de corte (PC). O PC para intensidade moderada e vigorosa de ≥ 1952 counts está disseminado em estudos com idosos, apesar dos critérios para definição das intensidades terem sido realizados com indivíduos jovens. Por outro lado, o PC de ≥ 1041 counts, que foi desenvolvido com idosos, apresenta limitações pela ausência de esforço máximo durante o teste. O objetivo deste estudo foi comparar a atividade física (AF) semanal de idosas utilizando os PC de ≥ 1952 counts e de ≥ 1041 counts. A amostra foi composta por 108 idosas que participavam do grupo baile (n=69) ou do grupo bingo (n=39). A prevalência de idosas ativas variou conforme PC, passando de 56,9% com ≥1952 counts para 94,5% com ≥1041 counts no grupo baile (p<0,05); enquanto no grupo bingo passou de 35,9% para 74,4% respectivamente (p<0,05). Diferenças foram encontradas entre os grupos em passos por semana em counts (baile: 65.386 vs bingo: 46.527; p=0,05; TE: 0.91) e AF total em counts (baile: 3.199.913,2 vs bingo: 2.425.109,7; p=0,03; ES: 0.91). Faz-se necessária a padronização do PC em acelerômetro para futuras pesquisas com idosos devido às diferenças encontradas neste estudo para um mesmo grupo.
Palavras-chave: Acelerometria. Atividade motora. Idoso.
ABSTRACT
Accelerometers measure intensity in an indirect manner, a fact rendering the choice of cut-points (CP) fundamental. The CP for moderate and vigorous intensity of ≥ 1,952 counts is commonly used in studies on older adults, although the criteria for defining the intensities have been established for young subjects. On the other hand, the CP ≥ 1,041 counts, which was developed for older adults, is limited by the lack of maximum stress during the test. The aim of this study was to compare the weekly physical activity of older women using CP ≥ 1,952 counts and ≥ 1,041 counts. The sample consisted of 108 older women who participated in a dance group (n = 69) or in a bingo group (n = 39). The prevalence of active older women varied according to CP, increasing from 56.9% for CP ≥ 1,952 counts to 94.5% for CP ≥ 1,041 counts in the dance group (p<0.05) and from 35.9% to 74.4%, respectively, in the bingo group (p<0.05). Differences were found between groups for weekly step count (dance: 65,386 vs bingo: 46,527, p=0.05; ES: 0.91) and for total physical activity expressed as total count (dance: 3,199,913.2 vs bingo: 2,425,109.7; p=0.03; ES: 0.91). Standardization of accelerometer CP is necessary for future research involving older adults because of the differences found here for the same group.
Keywords: Accelerometry. Motor activity. Older adult.
Introduction
Guidarini et al.
Traditionally, the level of PA is measured using questionnaires5,6 because of their practicality and low cost for large population groups7. However, difficulties in determining the level of PA are encountered in older adults, which are related to problems of remembering what they have done during the week and to the adequate report of the intensity, type and duration of PA8.
On the other hand, accelerometers show high validity (r=0.89) in measuring PA9,10 and are more precise than questionnaires. However, these devices measure the volume of PA in a direct manner but require equations to define their different intensities11. With respect to the measurement of intensity used in accelerometers, the recent review of Gorman et al.12 showed that the cut-points proposed by Freedson et al.9 were commonly used in studies on older adults; however, the criteria for defining light, moderate and vigorous activity were established in a population of young adults exercising on a treadmill ergometer and do not represent the physical work capacity of the older age group.
The cut-point proposed by Freedson et al.9 identifies activities performed at an intensity of ≥ 1,952 counts as moderate/vigorous activity. This value has for a long time been used as a standard in calibration studies9,13, intervention studies14 and epidemiological surveys15,16. These publications make this cut-point widely used even though it is not specific for older adults.
On the other hand, Copeland and Esliger17 developed a specific cut-point for the elderly population. The authors used a treadmill ergometer to test 38 older adults with a mean age of 69 years at different velocities and defined a cut-point of ≥ 1,041 counts as moderate/vigorous activity in older adults. This cut-point for older adults has limitations because of the lack of maximum stress during the test, which would provide a more precise measure of moderate/vigorous intensity. Thus, the most appropriate accelerometer cut-point defining moderate/vigorous PA in older adults remains unknown.
In view of the difficulty in measuring the intensity of PA in older adults by questionnaires or accelerometers, it cannot be stated that the current low prevalences of active older adults are due to low PA or to measurement errors. In this respect, the objective of this study was to compare weekly PA levels of older adults using two cut-points, ≥ 1,041 and ≥ 1,952 counts, to measure moderate and vigorous PA.
Methods
Participants
Older women ≥ 60 years, who attended community centers in the metropolitan region of Florianópolis, were included in the sample. The dance group (DG) consisted of older women who regularly participated in dance events in the last 3 months, with a minimum participation of two times per week for at least 4 hours/dance. Older women participating in bingo groups were selected for the control group (CG).
Cut-points for physical activity in older adults
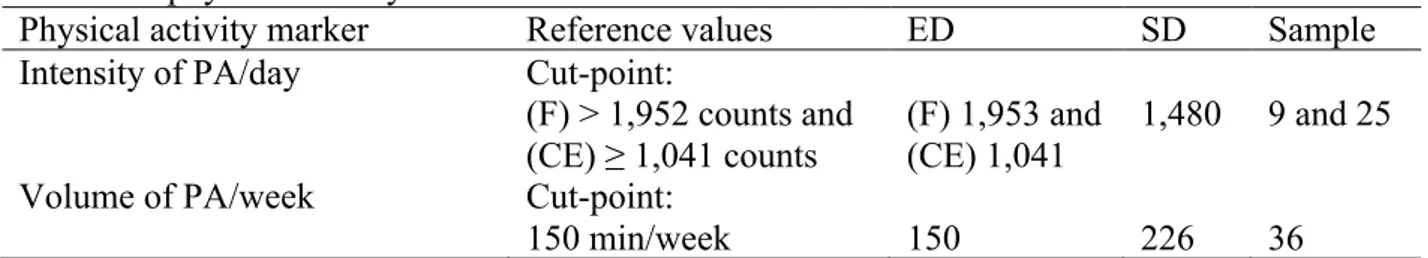
The sample size was calculated through the specific site of the Laboratory of Epidemiology and Statistics of the University of São Paulo19. The number of older adults to compose the sample for each marker is shown in Table 1.
Table 1. Calculation of the number of older women per group for each marker of weekly physical activity.
Physical activity marker Reference values ED SD Sample Intensity of PA/day Cut-point:
(F) > 1,952 counts and (CE) ≥ 1,041 counts
(F) 1,953 and (CE) 1,041
1,480 9 and 25 Volume of PA/week Cut-point:
150 min/week 150 226 36
Legend: PA: physical activity; F: Freedson et al. (1998); CE: Copeland and Esliger (2009); ED: expected difference; SD: standard deviation.
Source: The authors.
According to Table 1, DG and CG should contain at least 36 subjects/group to obtain a power of the test of 80% and to detect possible differences at a level of significance of 5%. First, 118 older women were included in the sample. However, 10 subjects were lost because they did not use the accelerometers adequately, resulting in a total sample of 108 older women, 69 in DG and 39 in CG.
Instruments
A questionnaire was elaborated by the researchers for characterization of the sample, which consisted of sociodemographic variables (age, education level, and household income), morbidities, medication use, risk behaviors (smoking and alcohol consumption), and participation in dance events (days of the week, time spent in the ballroom, and time spent dancing during the events).
Scale and stadiometer
Body weight was measured with a Plenna digital scale (model MEA-03140; capacity of 150 kg) to the nearest 0.1 kg. Height was measured with a Sanny anthropometric ruler (2 m) mounted on a tripod to the nearest 0.1 cm. The protocols proposed by Petroski20 were used for these measurements. Using the two measurements, the body mass index (BMI) was calculated as follows: BMI = body weight (kg)/(height (m) x height (m)) according to Petroski20.
Accelerometers
The Actigraph GT3X (512MB) monitoring system was used and the data were analyzed with the ActiLife 6 software. The accelerometers were calibrated prior to collection of the data at the Laboratório de Esforço Físico, Centro de Desportos, Universidade Federal de Santa Catarina (LAEF/CDS/UFSC), using a new accelerometer calibrated by ActiLife (USA) as recommended by Cain and Geremia21.
Intensity
Guidarini et al.
moderate-intensity activity of the cut-point proposed by Copeland and Esliger17, and moderate to vigorous physical activity (MVPA) corresponds to the moderate activity of the cut-point proposed by Freedson et al.9.
Volume
The volume of weekly PA of older women was determined from counts in minutes. The accelerometer records the number of movements (counts) performed by the subject during the time of use of the equipment.
Data collection
The data were collected from January to October 2014.
Ethical aspect
The older women signed the free informed consent form and the persons responsible for the dance events and community groups signed the agreement form of the institutions. The project was approved by the Ethics Committee on Research Involving Humans of UFSC (Protocol No. 773.718).
Data analysis
The SPSS 16.0 software was used for descriptive statistics and inferential analysis of the data. The distribution of frequencies (absolute and relative value), medians, means, and standard deviation were calculated for all variables of the study. Inferences about inter- and intragroup percent differences were made using the chi-squared test and differences between means of the groups were examined by the unpaired Student t-test. The effect size (ES) was calculated as the difference between magnitudes. An ES of ≤ 0.49 was classified as small, 0.50 to 0.79 as moderate, and ≥ 0.80 as high23. Multiple linear regression with backward selection was used for comparison of the outcomes between groups. A level of significance of ≤ 0.05 was adopted.
Results
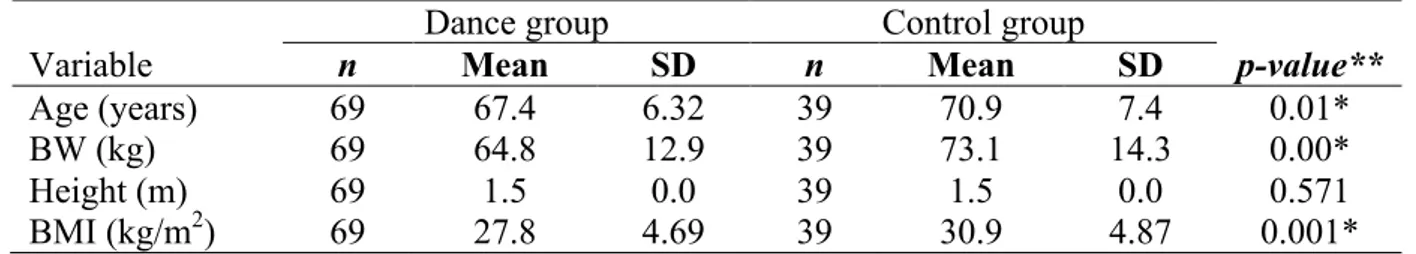
Table 2 shows the age, body weight, height and BMI of the older women. The ES between groups was -0.24 for age, -0.29 for body weight, and -0.30 for BMI.
Table 2. Anthropometric variables and age of older women.
Dance group Control group
Variable n Mean SD n Mean SD p-value**
Age (years) 69 67.4 6.32 39 70.9 7.4 0.01*
BW (kg) 69 64.8 12.9 39 73.1 14.3 0.00*
Height (m) 69 1.5 0.0 39 1.5 0.0 0.571
BMI (kg/m2) 69 27.8 4.69 39 30.9 4.87 0.001*
Legend: BW: body weight; BMI: body mass index; SD: standard deviation. **Unpaired Student t-test for comparison of means between groups. *p ≤ 0.05.
Source: The authors.
Cut-points for physical activity in older adults
Table 3 shows the history of diseases, medication use, and risk behaviors. Multiple manifestations were observed.
Table 3. History of diseases, medication use and risk behaviors of older women participating in the dance and control groups.
Variable Dance group Control group χ2**
n % f % p-value
Presence of disease 62 89.9 37 94.9 0.587*
Osteoarticular disease 29 42.0 20 51.3 0.468*
Cardiovascular disease 54 78.3 32 82.1 0.825*
SAH 46 66.7 30 76.9 0.367*
Dyslipidemia 23 33.3 13 33.3 1.00*
Diabetes 13 18.8 12 30.8 0.24*
Depression 13 18.8 6 15.4 0.849*
Neoplasm 2 2.9 0 0.0 0.741*
Medication for dyslipidemia 10 14.5 9 23.1 0.389*
Medication for SAH 43 62.3 30 76.9 0.179*
Smoker 7 10.1 2 5.1 0.587*
Excessive alcohol consumption 1 1.4 0 0.0 1.00*
Legend: SAH: systemic arterial hypertension. **Chi-squared test (χ2) to verify the proportional difference in the number of subjects per group. *p > 0.05.
Source: The authors.
For the analysis of weekly PA, the older women used the accelerometer on average 13.6±1.36 hours/day for 5 habitual days, including one weekend day. Statistically significant differences in weekly PA were observed between groups. As can be seen in Table 4, CG spent more time in sedentary activity than DG. Older women of DG were more active in terms of the total weekly volume of PA. Regarding intensity, a significant difference between groups was only observed for minutes of low-light activity, with subjects of DG spending more minutes per week in this activity.
Table 4. Volume and intensity of physical activities performed during one habitual week by
older women of the dance and control groups.
Variable Dance group Control group Linear regression**
Mean SD Mean SD B SE p
SedPA (min/week) 2,216.5 855.3 2,752.5 826.8 -503.27 183.31 0.007*
LLPA (min/week) 2,308.5 676.1 1,872.2 599.5 408.73 140.10 0.004*
HLPA (min/week) 383.4 227.6 289.2 193.0 66.73 47.63 0.164
MVPA (min/week) 220.4 164.0 147.1 156.6 52.36 34.86 0.136
HLMVPA(min/week) 590.8 354.2 436.4 319.8 111.52 75.92 0.145
Total PA (min/week) 2912.4 872.8 2308.6 826.6 527.8 185.26 0.005*
Total PA (counts) 3,199,913.2 175,916 2,425,109.7 175,079 615,558.6 287,841.5 0.035*
S (counts/week) 65,386.0 3,807.3 4,6527.0 4,540.3 1,2612.6 6,483.4 0.055*
SV (counts/min) 3.7 2.1 3.0 2.2 0.374 0.463 0.421
S (counts/day) 12,989.6 6,454.1 9,305.5 5,670.8 2,418.93 1,301.28 0.066
Guidarini et al.
The ES was calculated for each PA variable shown in Table 4. The ES was small for sedentary activity (min/week) -0.30; low-light PA (min/week) 0.32; high-light PA (min/week) 0.21; MVPA (min/week) 0.22; HLMVPA (min/week) 0.22; total PA (min/week) 0.33; step velocity (counts/min) 0.16, and number of steps (counts/day) 0.29. A high ES was observed for total PA (counts) (0.91) and number of steps/week (0.91).
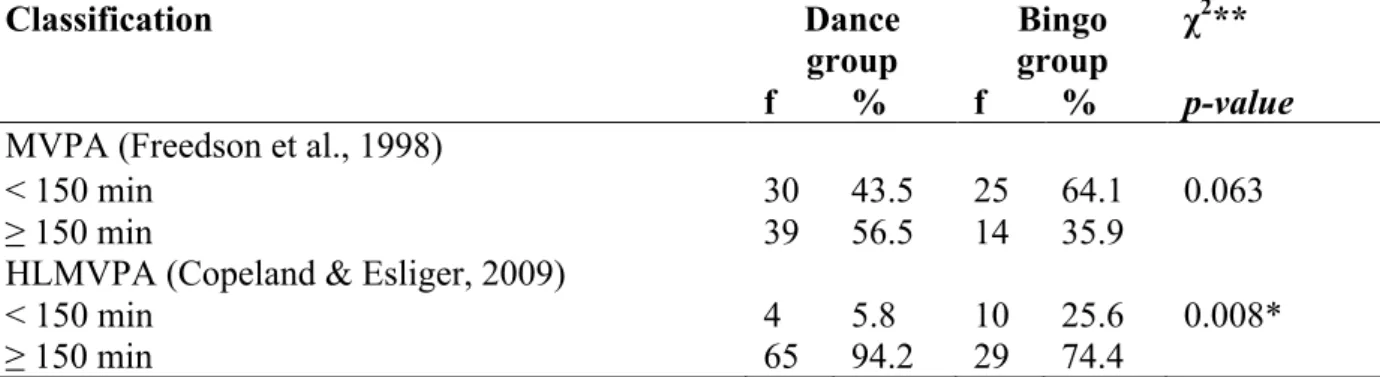
Table 5 shows the percentage of older women who achieved the global recommendation of the adequate amount of weekly PA necessary to provide health benefits.
Table 5. Classification of the volume of weekly moderate/vigorous physical activity according to the two different cut-points measured with accelerometers.
Classification Dance
group
Bingo group
χ2**
f % f % p-value
MVPA (Freedson et al., 1998)
< 150 min 30 43.5 25 64.1 0.063
≥ 150 min 39 56.5 14 35.9
HLMVPA (Copeland & Esliger, 2009)
< 150 min 4 5.8 10 25.6 0.008*
≥ 150 min 65 94.2 29 74.4
Legend: MVPA: moderate/vigorous physical activity; HLMVPA: high-light, moderate/vigorous physical activity. **Chi-squared (χ2) test to verify the proportional difference in the number of subjects per group that perform 150 min/week of moderate/vigorous physical activity.*p ≤ 0.05.
Source: The authors.
As shown in Table 5, the percentage of older women who achieved the recommendation of 150 min/week differs according to the cut-point used. The cut-point proposed by Freedson et al.9 showed a tendency of the percentages do differ statistically. For the cut-point proposed by Copeland and Esliger17, a statistically significant difference was observed in the percentages of the two groups, with a higher prevalence of physically active older women in DG when compared to CG.
Discussion
Regarding the profile of older women, DG and CG were similar in terms of sociodemographic characteristics (education level and income), frequency of diseases, and risk behaviors (smoking and alcohol consumption). These data agree with the majority of studies on the elderly population in Brazil. According to Bezerra et al.24, Brazilian older adults have a low education level and income and are affected by a large number of chronic-degenerative noncommunicable diseases. The two groups differed significantly in terms of age, body weight and BMI, with higher values in CG.
Analysis of weekly PA level showed that most older adults in DG and CG were physically active in terms of both steps per day (DG: 12,989.6; CG: 9,305.4; p=0.05) and total hours of daily PA (DG: 9.7 h/day; CG: 7.6 h/day; p=0.005). The amount of HLMVPA did not differ significantly between groups (DG: 2.36 h/day; CG: 1.45 h/day); however, we found high percentages of participation in PA with a volume ≥ 150 min/week at high-light, moderate to vigorous intensity (DG: 94.5%; CG: 74.4%; p=0.008).
Cut-points for physical activity in older adults
Florianópolis27, of 58% in a study conducted in the southern and northeastern regions of Brazil28, and ranged from 22.3 to 37.7% in the Vigitel survey4. International data demonstrated that 43% of the 1,860 older women comprising the sample of the Hordaland Health Study performed at least one hour of moderate and vigorous physical activities per day29.
The explanation for these differences might be related to the methodology adopted. These studies were conducted using questionnaires, a fact impairing comparison between the values found. Questionnaires are not sufficiently sensitive to detect daily PA; thus, when applied to older adults, these questionnaires tend not to estimate well the PA performed by the subjects because they are mainly of light intensity30. The difficulty in capturing PA with a questionnaire is related to limitations such as imprecise recalls and the arbitrary categorization cut-off points of each questionnaire proposed8.
On the other hand, in a study using pedometers, with PA being classified based on step count (a direct measure), the prevalence of active subjects was 84.9%, a rate that is closer to that found in this study26.
Studies using accelerometers reported that different cut-points modify the results31. Gorman et al.12 carried out a systematic review on accelerometry analysis of PA and sedentary behavior in older adults and identified that cut-points for MVPA ranged from 574 to 3,250 counts/min, with 1,952 counts/min being the most commonly used value. In another systematic review, Bento et al.32 were unable to compare the methodologies of different studies since they used different instruments, cut-points, time of accelerometer use, and type of PA. Thus, the lack of standardization impairs the measurement of PA, although the accelerometer is an equipment of high validity9.
In the present study, these differences in the results depend on the cut-points used to moderate/vigorous intensity. Using the cut-point proposed by Freedson et al.9, the following percentages of active older adults were observed: 56.9% in DG and 35.9% in CG. Very different data were found when the cut-point of Copeland and Esliger17 was used, which revealed a prevalence of 94.5% in DG and of 74.4% in CG.
The cut-point proposed by Freedson et al.9 overestimates the moderate intensity for older adults because it was validated for a sample of young adults with a mean age of 23 years. Another aggravating factor of this cut-point for older adults is related to the spectrum of light activities which is very wide, ranging from 100 to 1,951 counts, i.e., an interval comprising activities that range from standing and domestic activities to walking 4 km/h22. Thus, using the cut-point of Freedson et al.9, studies show that older adults spend more time in light PA and little time in moderate and vigorous activities33, a finding that could be different if the cut-point had a lower magnitude.
In this respect, the cut-point proposed by Copeland and Esliger17 establishes ≥ 1,041 counts as moderate PA for older adults, which Buman et al.22 denominate high-light PA and demonstrated that this intensity has health benefits for older adults. The cut-points for older adults proposed by Copeland and Esliger17 were developed using a sample of older adults and three treadmill velocities (2.2, 3.2 and 4.8 km/h), with 6 min of walking and a 5-min interval as done in other validation studies9,34. The correlation between METs measured by spirometry and counts/min was moderate (r=0.60). The authors found a strong correlation between counts and treadmill velocity (r=0.87).
With respect to the relationship between METs and cut-points, the literature raises questions about the standardization of METs. Copeland and Esliger17 questioned the establishment of cut-points based on VO2max used by Freedson et al.9 and Troiano et al.16, in
Guidarini et al.
In a study involving adults older than 65 years, Kwan et al.35 established 1 MET to correspond to 2.8 ml/kg/min for this group. Using the study of Kwan et al.35 as a basis, Copeland and Esliger17 correlated this discovery with their accelerometer validation for older adults and proposed that moderate activity represents a treadmill walk at 3.2 km/h, corresponding to 4.6 METs (if 1 MET were equal to 2.8 ml/kg/min). In that study, the authors verified that 3.2 km/h would correspond to 1,041 counts/min, which was proposed as a cut-point for moderate PA in older adults. Importantly, the equivalence should be higher than 4 METs because PA above this intensity is associated with a reduced risk of mortality and morbidity in older adults36.
However, the study of Copeland and Esliger17 was criticized because of the lack of maximum stress during the test, which would provide a more precise measure of moderate and vigorous intensity. The maximum velocity used in the validation test of Copeland and Esliger17 was 4.8 km/h, different from the protocol tested by Freedson et al.9 which employed test velocities of 4.8, 6.4, and 9.7 km/h.
Within this context, the study of Miller et al.37 highlighted the importance of a specific cut-point for older adults. The authors tested a treadmill protocol, comparing the physical capacity of young adults (24.6 years), adults (44.6 years), and older adults (64.3 years). The test consisted of walking or running at velocities of 3.22 km/h, 4.02 km/h, 4.82 km/h, 5.63 km/h, 6.44 km/h, 9.66 km/h, 11.3 km/h, and 12.3 km/h. The results showed no difference in mean counts per age group for the velocities of 3.22 and 6.44 km/h. The authors observed differences only from the velocity of 9.66 km/h on, when most older adults were unable to complete the test. This velocity corresponded to the moderate PA cut-point for adults, demonstrating the fragility of using the cut-point for adults in assessments of older adults. Miller et al.37 found that the maximum velocity achieved by older adults on the treadmill was 6.44 km/h, corresponding to 5,440 counts/min; in parallel, the authors observed that 5,500 counts/min corresponded to moderate PA in young adults. It can thus be understood that the cut-point for young adults is not the same for older adults and that the use of accelerometer cut-points should take into consideration the age range of the initial sample tested for its proposal.
The present study is relevant since it clearly demonstrates the differences when two different cut-points for older adults are used, which change the prevalence of active older adults for the same group. The present results highlight the need for further studies that develop or reformulate specific cut-points for older adults in order to fill this gap in the literature.
The limitations of the study are related to the sample used, which was mainly classified as active in both DG and CG, a fact minimizing differences between cut-points. Differently classified sample groups may reveal a greater discrepancy in the use of the two cut-points for the same group.
Conclusions
Cut-points for physical activity in older adults
The present results and discussion suggest the cut-point of ≥ 1,041 counts to be more adequate for this population. However, further studies on the topic are important to evaluate and consolidate an appropriate cut-point for older adults.
References
1. Malta DC, Moura L, Prado RR, Escalante JC, Schmidt MI, Duncan BB. Mortalidade por doenças crônicas não transmissíveis no Brasil e suas regiões, 2000 a 2011. Epidemiol Serv Saúde 2014;23(4):599-608. Doi:
10.5123/S1679-49742014000400002.
2. World Health Organization (WHO). Global action plan for the prevention and control of noncommunicable
diseases 2013-2020.World Health Organization 2013:1-103.
3. Hallal PC, Andersen LB, Bull FC, Guthold R, Haskell W, Ekelund U, et al. Global physical activity levels: surveillance progress, pitfalls, and prospects. Lancet 2012;380(9838):247-257. Doi: 10.1016/S0140-6736(12)60646-1.
4. Ministério da Saúde. Secretaria de Vigilância em Saúde. Vigitel Brasil 2013: vigilância de fatores de risco e proteção para doenças crônicas por inquérito telefônico; 2014.
5. Garcia LMT, Osti RFI, Ribeiro EHC, Florindo AA. Validação de dois questionários para avaliação da atividade física em adultos. Rev Bras Ativ Fis Saúde 2013;18(3):317-318.
6. Rabacow FM, Gomes MA, Marques P, Benedetti TRB. Questionários de medidas de atividade física em idosos. Rev Bras Cineantropm Desempenho Hum 2006;8(4):99-106.
7. Torquato ED, Gerage AM, Meurer ST, Borges RA, Silva MC, Benedetti TRB. Comparação do nível de atividade física medido por acelerômetro e questionário IPAQ em idosos. Rev Bras Ativ Fis Saúde 2016;21(2):144-153.
8. Bertoni AG, Whitt-Glover MC, Chung H, Le KY, Barr RG, Mahesh M, et al. The association between physical activity and subclinical atherosclerosis: the Multi-Ethnic Study of Atherosclerosis. Am J Epidemiol 2009;169(4):444–454. Doi: 10.1093/aje/kwn350.
9. Freedson PS, Melanson E, Sirard J. Calibration of the Computer Science Applications, Inc. accelerometer. Med Science Sports Exerc 1998;30(5):777-781.
10. Brage S, Wedderkopp N, Franks PW, Andersen LB, Froberg K. Reexamination of validity and reliability of the CSA monitor in walking and running. Med Science Sports Exerc 2003;35(8):1447–1454. Doi:
10.1249/01.MSS.0000079078.62035.EC.
11. Welk GJ. Principles of design and analyses for the calibration of accelerometry-based activity monitors. Med Sci Sports Exerc 2005;37(11 Suppl):S501-511.
12. Gorman E, Hanson HM, Yang PH, Khan KM, Liu-Ambrose T, Ashe MC. Accelerometry analysis of physical activity and sedentary behavior in older adults: a systematic review and data analysis. Eur Rev Aging Phys Act 2014;11(1):35-49. Doi: 10.1007/s11556-013-0132-x.
13. Nichols JF, Morgan CG, Chabot LE, Sallis JF, Calfas KJ. Assessment of physical activity with the Computer Science and Applications, Inc., accelerometer: laboratory versus field validation. Res Q Exerc Sport
2000;71(1):36-43. Doi: 10.1080/020701367.2000.10608878.
14. Opdenacker J, Boen F, Coorevits N, Delecluse C. Effectiveness of a lifestyle intervention and a structured exercise intervention in older adults. Prev Med 2008;46(6):518-524. Doi: 10.1016/j.ypmed.2008.02.017. 15. Matthews CE, Chen KY, Freedson PS, Buchowski MS, Beech BM, Pate RR, et al. Amount of time spent in
sedentary behaviors in the United States, 2003–2004. Am J Epidemiol 2008;167(7):875-881. Doi: 10.1093/aje/kwm390.
16. Troiano RP, Berrigan D, Dodd KW, Mâsse LC, Tilert T, McDowell M. Physical activity in the United States measured by accelerometer. Med Sci Sports Exerc 2008;40(1):181-188. Doi:
10.1249/mss.ob013e31815a51b3.
17. Copeland JL, Esliger DW. Accelerometer assessment of physical activity in active, healthy older adults. J Aging Phys Act 2009;17(1):17-30.
18. Choi, L, Liu Z, Matthews CE, Buchowski MS. Validation of accelerometer wear and nonwear time
classification algorithm. Med Sci Sports Exerc 2011;43(2):357-364. Doi: 10.1249/MSS.0b013e3181ed61a3.
Guidarini et al.
21. Cain KL, Geremia CM. Accelerometer data collection and scoring manual. For adult & senior studies. San Diego State University. James Sallis Active Living Research Lab; 2012.
22. Buman MP, Hekler EB, Haskell WL, Pruitt L, Conway TL, Cain Kl, et al. Objective light-intensity physical activity associations with rated health in older adults. Am J Epidemiol 2010;172(10):1155-1165. Doi: 10.1093/aje/kwq249.
23. Cohen J. Statistical power analysis for the behavioral sciences. 2.ed. New Jersey: Lawrence Erlbaum; 1988.
24. Bezerra FC, Almeida MI, Nóbrega-Therrien SM. Estudos sobre Envelhecimento no Brasil: Revisão Bibliográfica. Rev Bras Geriatr Gerontol 2012;15(1):155-167. Doi: 10.1590/S1809-98232012000100017. 25. Zaitune MPA, Barros MBA, César CLG, Carandina L, Goldbaum M, Alves MCGP. Fatores associados à
prática de atividade física global e de lazer em idosos: Inquérito de Saúde no Estado de São Paulo (ISA-SP), Brasil. Cad Saúde Pública 2010;26(8):1606-1618. Doi: 10.1590/S0102-311X2010000800014.
26. Azevedo MR, Araújo CLP, Reichert FF, Siqueira FV, Silva MC, Hallal PC. Gender differences in leisure-time physical activity. Int J Public Health 2007;52(1):8-15.
27. Benedetti TRB, Borges LJ, Petroski EL, Gonçalves LHT. Atividade física e estado de saúde mental de idosos. Rev Saúde Pública 2008;42(2):302-307. Doi: 10.1590/S0034-89102008005000007.
28. Siqueira FV, Facchini LA, Piccini RX, Tomasi E, Thumé E, Silveira DS, et al. Atividade física em adultos e idosos residentes em áreas de abrangência de unidades básicas de saúde de municípios das regiões Sul e Nordeste do Brasil. Cad Saúde Pública 2008;24(1):39-54. Doi: 10.1590/S0102-311X2008000100005.
29. Theofylaktopoulou D, Midttun O, Ulvik A, Ueland PM, Tell GS, Vollset SE, et al. A community-based study on determinants of circulating markers of cellular immune activation and kynurenines: the Hordaland Health Study. Clin Exp Immunol 2013;173(1):121-130. Doi: 10.1111/cei.12092.
30. Bonnefoy M, Normand S, Pachiaudi C, Lacour JR, Laville M, Kostka T. Simultaneous validation of ten physical activity questionnaires in older men: a doubly labeled water study. J Am Geriatr Soc 2001;49(1):28-35.
31. Sun F, Norman IJ, While AE. Physical activity in older people: a systematic review. BMC Public Health 2013;13:449. Doi:10.1186/1471-2458-13-449.
32. Bento T, Cortinhas A, Leitão JC, Mota MP. Actividade física em adultos e idosos avaliados por acelerometria. Rev Saúde Pública 2012;46(3):561-570. Doi:10.1590/S0034-89102012005000022.
33. Davis MG, Fox KR. Physical activity patterns assessed by accelerometry in older people. Eur J Appl Physiol 2007;100(5):581-589. Doi:10.1007/s00421-006-0320-8.
34. Lopes VP, Magalhães P, Bragada J, Vasques C. Actigraph calibration in obese/overweight and type 2 diabetes mellitus middle-aged to old adult patients. J Phys Act Health 2009;6(suppl.1):S133-140.
35. Kwan M, Woo J, Kwok T. The standard oxygen consumption value equivalent to one metabolic equivalent (3.5 ml/min/kg) is not appropriate for elderly people. Int J Food Sci Nutr 2004;55(3):179-182.
Doi:10.1080/096374804100011725201.
36. Paterson DH, Jones GR, Rice CL. Ageing and physical activity: evidence to develop exercise recommendations for older adults. Can J Public Health 2007;98(Suppl 2):S69-108.
37. Miller NE, Strath SJ, Swartz AM, Cashin SE. Estimating absolute and relative physical activity intensity across age via accelerometry in adults. J Aging Phys Act 2010;18(2):158-170.
Received on, Mar, 01, 2016. Reviewed on, Jul, 26, 2016. Accepted on Dec, 21, 2016.
Address for correspondence:Fernanda Christina de Souza Guidarini. Servidão Recanto Verde 155, Apt: 321, Itacorubi, SC,