N
o
ta
T
é
c
ni
c
a
*e-mail: [email protected]
HPLC-DAD DETERMINATION OF BERBERINE, CHELERYTHRINE AND SANGUINARINE IN THE MEXICAN PRICKLY POPPY (Argemone mexicana L. PAPAVERACEAE), A MEDICINAL PLANT
Jorge F. Xool-Tamayoa,b, Manlio Graniel-Sabidoa, Gumersindo Mirón-Lópeza,Gonzalo J. Mena-Rejóna, Miriam Monforte-Gonzálezb and Felipe Vázquez Flotab,*
aFacultad de Química, Universidad Autónoma de Yucatán, Calle 43 No. 613 x Calle 90 Col. Inalámbrica, Mérida Yucatán 97069 México
bUnidad de Bioquímica y Biología Molecular de Plantas, Centro de investigación Científica de Yucatán, Calle 43 No. 130 Chuburná de Hidalgo, Mérida Yucatán 97205, México
Recebido em 10/05/2017; aceito em 11/06/2017; publicado na web em 22/08/2017
A sensitive, simple, rapid and reliable HPLC-DAD method for the analysis of the benzylisoquinoline alkaloids (BIA’s) content in Argemone mexicana (Papaveraceae) is presented. This method allows the simultaneous separation and quantitation of berberine (Bn), chelerythrine (C) and sanguinarine (S) in extracts from A. mexicana tissues, reducing time of analysis in comparison to previous reports. Alkaloids were separated on a C18 Hypersil Gold column using an acetonitrile gradient (20 to 70%) in 1% acetic acid in water. Alkaloids were identified based on retention times and UV spectra and quantified at 254 nm. Linearity between 0.5-20 µg mL-1 was observed for Bn, C and S, with limits of detection (LOD) and quantitation (LOQ) of 0.11 and 0.33 for Bn, 0.10 and 0.30
for C and 0.05 and 0.15 for S, respectively. Maximal intra- and inter-day variation values were < 0.49% in all cases, with alkaloids’ recoveries higher than 95%. System suitability tests (SST), including resolution (Rs), retention factor (K’), selectivity (α), tailing factor and number of theoretical plates were performed according to the United States Pharmacopeia (USP), fulfilling recommended values. The method proved to be efficient and reproducible when analyzing different tissues of field-collected A. mexicana plants. Keywords: Argemone mexicana; berberine; chelerythrine; prickly poppy; sanguinarine.
INTRODUCTION
Argemone mexicana (Papaveraceae), commonly known as Mexican prickly poppy, is a plant widely used in traditional medicine as an analgesic, diuretic, antimicrobial and antiparasitic agent.1-3 Such properties have been associated to the presence of benzylisoquinoline alkaloids (BIA’s), which are distributed through the entire plant4. The main Argemone alkaloids are berberine (Bn), chelerythrine (C) and sanguinarine (S), which belong to the protoberberine (Bn) and benzophenanthridine (C and S) types.4 Bn supplements are employed as insulin sensitizers in treatments for diabetes type 2 patients, as well as for dyslipidemia. Furthermore, it has been included in the formulation of environmentally friendly agrochemicals.1,5 On the other hand, formulations containing S are administered as supplements to livestock diets, since it promotes better nutrient absorption and digestion.3,5 There also studies showing good antimicrobial activity of C against multi-drug resistant, methicillin-resistant Staphylococcus aureus strains (mdr-MRSA).1,5 Moreover, Bn, C and S might play a defensive role in plants that produce them given their antimicrobial, anti-herbivory and allelopathic properties.1,5
Interestingly, in only a few plant species, S and Bn are simultaneously present4,5 and, perhaps for that reason, there are just a few methods for the analysis of these alkaloids in a single chromatographic run. Methods for the analysis of BIA’s include chromatographic separation using paper or silica plates (TLC), as well as non-polar columns for liquid chromatography (HPLC).6-8 However, some of these require a long time of analysis or have been used mainly for qualitative purposes.9-12 In here, we have implemented a simple method for the efficient separation and quantitation of the main alkaloids present in A. mexicana tissues. This method, which fulfills validation parameters of the United States Pharmacopeia (USP)13 and
the International Conference for Harmonization (ICH),14 has been employed for the analysis of roots and leavesof A. mexicana. Main alkaloids were properly resolved and time of analysis was reduced in comparison to previously reported methods.
EXPERIMENTAL
Plant material
Mature plants of Argemone mexicana L., with flowers and open seed capsules, were collected in the outskirts of Mérida, México (20º58’00’’N/89º37’00’’W) and taxonomically identified at the Regional Botanical Garden of Centro de Investigación Científica de Yucatán. Juvenile plants, before stem elongation, and developing seedlings were also collected. After collection, plants were dissected into roots and leaves and fresh tissues were frozen and lyophilized (Labconco FreeZone 4.5, Kansas City MO). In all cases, tissue samples were collected and pooled to form a single batch from where three independent portions were used for individual alkaloid extraction and processing.
Chemicals and reagents
Alkaloid extraction and analysis
Freeze-dried tissues were ground using a mechanical mill (IKA, Wilmington NC) to render fine powders, which were stored in sealed plastic bags in a desiccator, away from the light, until analysis. For alkaloid extraction, 200 mg of powdered tissue were mixed with 10 mL of methanol and incubated for two hours at room temperature. After separating debris by filtration, the methanol extract was reduced to dryness under vacuum and the residue was dissolved in 6 mL of a 1:3 (v/v) mixture of methanol-water. Alkaloid content in this solution was enriched by acid-base extraction. First, pH of the methanol-water resuspended alkaloids was dropped below 5 with 1 mol L-1 H
2SO4 and then, mixed with an equal volume of ethyl acetate in a separation funnel. After shaking up, the organic phase was discarded and the remaining aqueous phase was further extracted twice. Residual aqueous phase pH was raised to above 10 with 1 mol L-1 NaOH and three further ethyl acetate extractions were carried out as described above, but now keeping the organic phase each time. The resulting organic fractions were pooled out and dried under reduced pressure. The residue thus obtained was resuspended in 20% A in B (see below), filtered through a 0.45 µm pore size nylon membrane and adjusted to 1 mg mL-1 with the same solvent.
Instrumentation and chromatographic separation
Analysis was performed using an Agilent HPLC System 1200 (Agilent Technologies, Santa Clara, CA), equipped with a quaternary pump (G1311A), and 1260 Infinity autosampler (G1329B). The equipment was controlled by Agilent ChemStation LC. Alkaloids were detected with a diode array detector (DAD; G1315B). Samples were loaded into the column using an injection valve fitted with a 20 µL loop. Alkaloid mixtures and plant extracts were separated on a C-18 Hypersil Gold 4.6 x 100 mm, 5 µm column (Thermo, Waltham, MA), using as mobile phase an incremental gradient of acetonitrile (A) in 1% acetic acid in water (B). A multistep gradient was applied initiating with 20% of A in B, and increasing A to 60 % during the first 9 min, then to 70% from 9 to 20 min; and then returning to the initial conditions from 20 to 23 min (20% of A in B). Total analysis time was 25 min (flow rate of 1.2 mL min-1; 30 ºC). Alkaloids’ identities were
assigned by comparing retention time and UV spectra (190-500 nm) to those of commercial standards. For quantitation, chromatograms were acquired at 254 nm. A 20% solution of A diluted in B was used as reading blank.
Validation
Validation of the HPLC method15 was performed according to criteria proposed by USP13 and ICH.14 Resolution (Rs), retention factor (K’), selectivity (α), tailing factor and number of theoretical plates were determined according to USP.13 Linearity and range were evaluated by constructing a calibration curve for each alkaloid (0.5, 2.0, 4.0, 6.0, 8.0, 10.0, and 20.0 µg mL−1), using peak areas versus nominal concentrations. Accuracy was established by calculating the percentage of recovery of known amounts of alkaloid standards added to plant extracts. Different volumes from standard solutions of 8, 10 and 12 µg mL-1 of each alkaloid were added to the alkaloidal residue diluted in a mixture of acetonitrile 1% with aqueous acetic acid (2:8, v/v). Samples were analyzed in triplicates for each concentration tested, as described above. Precision of the method was determined as the relative standard deviation (RSD) of six replicate measurements of intra and inter-day injections. Fresh 10 µg mL-1 alkaloid solutions were analyzed each day during two nonconsecutive days to obtain these data. RSD was estimated as 10σ/µ, where σ and
µ corresponded to the standard deviation and mean of six detector readings respectively.
Limits of quantification (LOQ) and detection (LOD) were established according to ICH guidelines, as 10σ/m and 3.3σ/m, respectively, where σ and m correspond to the standard deviation and the slope of the alkaloid calibration curves (y-intercepts), respectively.
RESULTS AND DISCUSSION
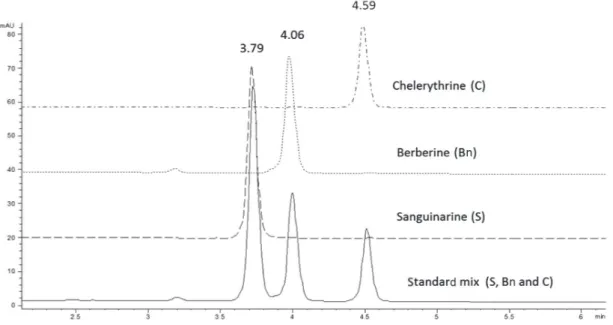
In order to develop a method capable of separating the main alkaloids present in A. mexicana tissues, a mixture of commercial standards of Bn, C and S was injected on a C18 Hypersil Gold column using a stepwise incremental gradient of acetonitrile (A) in diluted acetic acid (1% in water; B). By increasing acetonitrile concentration, as described in Experimental, proper separation of the
three standards in the mixture was achieved (Figure 1). Clear signals with good resolution and factor tailing were detected at 3.79, 4.06 and 4.59 min for S, Bn and C, respectively (Table 1). A flow rate of 1.2 mL min-1 provided an optimal signal-to-noise ratio, as well as shorter retention times than previously reported.9,16-17 It is important to note that variations in retention times were within the 0.01 min order (RSD lower than 2%). Hence, this method allows performing a complete alkaloid analysis from raw mixtures in fewer than 5 min, reducing in this way the cost of analysis.
Linearity and detection limit
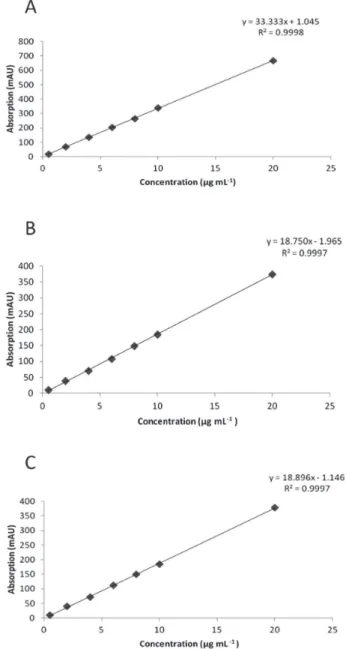
Linearity of response for Bn, C and S under the same chromatographic conditions was established. Seven different concentrations of each standard were injected in triplicates to construct a calibration curves, observing linear responses between 0.5-20 µg mL-1 and high regression coefficients (r2) for each one of the three alkaloids (Figure 2). Variance analysis for these linear regressions confirmed the strong relationships between y and x values (low p values; Table 2), confirming the linearity and sensitivity of the model for each alkaloid.
LOQ and LOD were estimated for the three main alkaloids found in Argemone tissues. LOQ for S, Bn and C were 0.15, 0.33 and 0.30 µg mL-1 respectively, whereas LOD values were 0.049, 0.11 and 0.10 µg mL-1 for S, Bn and C, respectively (Table 2). Noticeable, LOQ values were lower than the first point of the calibration curves (≤ 0.5 µg mL−1) confirming the linearity, accuracy and precision of the method within the working range. The low values of minimal detection would allow the precise quantitation alkaloids, even using tiny tissue samples for extraction, such as those obtained from developing Argemone seedlings.13,14
Precision and accuracy
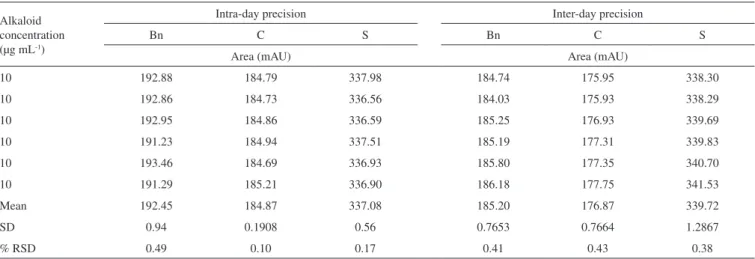
Precision of the method was determined for the three alkaloids (Bn, C and S) by performing six inter- and intra-day independent injections of fixed, freshly prepared 10 µg mL-1 alkaloid standard solutions during two non-consecutive days. Low RSD values were
observed in all cases both in intra- and inter-day repetitions (Table 3), indicating the high precision and repeatability of the analytical method proposed in here.
The accuracy was validated by spiking blanks with known amounts of the standard alkaloid solutions (8, 10 and 12 µg mL-1). The spiked mixtures were injected in two different experiments, recovering between 95-104% in all cases (Table 4). Moreover, similar recoveries were recorded when root extracts were spiked with the alkaloid standard solutions. It is important to mention that extraction procedure was also reproducible, since three independent samples
Table 1. Values of the system suitability tests performed of the proposed method for berberine (Bn), chelerythrine (C) and sanguinarine (S)
Alkaloid Retention time (min) Retention Factor (K´) Selectivity (α) Resolution (RS) Tailing Factor Theoretical plates/m
Bn 4.065±0.25 2.7426 1.1017a 1.57b 1.33 66081
C 4.590±0.12 3.2261 - - 1.33 37446
S 3.790±0.28 2.4896 1.2658c 3.93d 0.85 102121
a,b α and Rs values refer to those calculated between Bn and C. c,d α and Rs values refer to those calculated between S and Bn.
Figure 2. Calibration curves for sanguinarine (A), berberine (B) and che-lerythrine (C). Curves were constructed from 0.5 to 20 µg/mL of alkaloid standards. Each point represents the average of triplicates
Table 2. Regression statistics and sensitivity of the proposed method for berberine (Bn), chelerythrine (C) and sanguinarine (S). LOQ, limit of quan-titation; LOD, limit of detection
Parameter Bn C S
Lineal range (µg/mL)
0.5-20 0.5-20 0.5-20
Correlation coefficient (r2)
0.9997 0.999 0.9998
Intercept (a) -1.9650 -1.1458 1.0453
Slope (b) 18.750 18.896 33.333
from a single batch of the different tissues yielded similar alkaloid amounts (Table 5). The average standard deviation for alkaloid yield, as mg per g of dry weight (DW), was 12, 10 and 11% of the mean alkaloid value recovered from mature, juvenile and seedlings tissues (Table 5).
Alkaloid quantitation in tissue extracts from A. mexicana
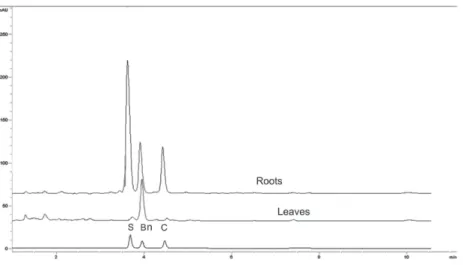
Once the method was validated, it was employed to analyze alkaloid contents in roots and leaves of A. mexicana plants at three different developmental stages. These tissues were selected since
they present high alkaloid contents5,6 and variations along the plant´s life cycle had been observed.5,6 Tissues were extracted as described under Experimental. The main alkaloids (Bn, C and S) were clearly separated in root extracts from mature plants, where significant amounts of the three alkaloids have been found (Figure 3). Besides Rt values, alkaloid identity was confirmed comparing spectral data of the alkaloid standards to those of the peaks matching the corresponding Rt’s. Hence, peak at 3.79 min showed the three absorbance bands observed for the S standard (λ379, λ406 and λ459). Similarly, peak at 4.06 min, displayed the four bands as the Bn standard (λ220, λ260, λ313 and λ446) and peak at 4.59, the three absorbance bands produced by the C standard, (λ267, λ329 and
λ358) (Figure 4). Root tissues accumulated the three analyzed alkaloids at the three determined developmental stages (Table 5). In leaves, Bn was the main alkaloid and the presence of C and S was detected only in low amounts and at early developmental phases (see seedlings in Table 5). In general, contents for the analyzed alkaloids were between 1 and 2 mg g DW-1, depending on tissue and developmental stage (Table 5). These values accounted for about 40% of the total alkaloid fraction, gravimetrically estimated in all cases. These alkaloid values were consistent to those previously determined in our laboratory6 and comparable to other plants, such as Chelidonium and Fumaria.16,17
CONCLUSIONS
BIA’s are taxonomically distributed among plants of eleven families grouped in the Magnoliflorae and Ranunculiflorae
Table 3. Intra and inter precisionresults of the proposed method for berberine (Bn) and chelerythrine (C) sanguinarine (S). Values refer to the DAD response as peak area set a 259 nm. RSD, relative standard deviation.
Alkaloid concentration (µg mL-1)
Intra-day precision Inter-day precision
Bn C S Bn C S
Area (mAU) Area (mAU)
10 192.88 184.79 337.98 184.74 175.95 338.30
10 192.86 184.73 336.56 184.03 175.93 338.29
10 192.95 184.86 336.59 185.25 176.93 339.69
10 191.23 184.94 337.51 185.19 177.31 339.83
10 193.46 184.69 336.93 185.80 177.35 340.70
10 191.29 185.21 336.90 186.18 177.75 341.53
Mean 192.45 184.87 337.08 185.20 176.87 339.72
SD 0.94 0.1908 0.56 0.7653 0.7664 1.2867
% RSD 0.49 0.10 0.17 0.41 0.43 0.38
Table 4. Recovery test (accuracy) of the proposed method for berberine (Bn), chelerythrine (C) and sanguinarine (S). Initial alkaloid concentration was 0 µg
DW-1 in all cases
Alkaloid concentration (µg mL-1)
Alkaloid amount (µg) Recovery (%) 1RSD (%)
Bn C S Bn C S Bn C S
Added Experiment 1
8 7.8 + 0.07 7.98 + 0.03 7.79 + 0.05 97 99 97 0.67 0.33 0.62
10 10.0 + 0.05 9.50 + 0.03 10.11 + 0.02 100 95 101 0.33 0.32 0.24
12 12.0+ 0.08 12.00 + 0.03 12.00 + 0.06 100 100 100 0.66 0.27 0.45
Experiment 2
8 8.3 + 0.06 8.14 + 0.01 7.93 + 0.02 103 102 99 0.76 0.14 0.292
10 10.0 + 0.02 10.33 + 0.01 10.42 + 0.04 102 103 104 0.16 0.12 0.405
12 12.4 + 0.01 12.29 + 0.01 12.26 + 0.07 101 102 102 0.12 0.10 0.060
1 Relative standard deviation
Table 5. Contents (in mg DW-1) of berberine (Bn), chelerythrine (C) and
sanguinarine (S), in A. mexicana tissues collected from plants at different developmental phases. Average of triplicates with standard deviation.
Type of plants Tissue Bn C S
mg g DW-1
Mature Leaves 1.12 + 0.13 < 0.1 < 0.1 Roots 0.91 + 0.07 0.84 + 0.12 1.16 + 0.20 Juvenile Leaves 1.21 + 0.15 < 0.1 < 0.1
Figure 3. Chromatographic separation of berberine (Bn) chelerythrine (C) and sanguinarine (S) in extracts from roots and leaves from mature A. mexicana plants. Column and mobile phase were as in Figure 1
Figure 4. UV absorbance spectra (190-500 nm) of standards of sanguinari-ne (A); berberisanguinari-ne (B) and chelerythrisanguinari-ne (C) compared to peaks at 3.79 (A), 4.06 (B) and 4.59 (C) min from root extracts. Solid and dashed lines correspond to standards and extracts respectively. Absorbance data were collected after chromatographic separation using a diode array detector (DAD)
superorders.18 Bn, C and S, the most abundant alkaloids in A. mexicana tissues, are simultaneously present in only a few species. Therefore, most chromatographic methods have not been developed to specifically separate and quantify them.19,20 In here, we have developed a method that allows the resolution of these three alkaloids from a mixture in a single run in under 25 min. This is notably shorter time than those in previous reports.16-19 Moreover; the method has been validated according to standards in the USP and ICH.
ACKNOWLEDGMENTS
JFX-T was granted scholarships for PhD studies by the National Council of Science and Technology (CONACYT, México) and by the Autonomous University of Yucatán (UADY). The authors thank Dr. M.L. Miranda-Ham (CICY) for her critical review of the MS. This work was supported by CONACYT (México), grant CB-2012-01-0181880.
REFERENCES
1. Brahmachari, G.; Dilip, G.; Rajiv, R. B.; Braz. J. Pharmacogn. 2013, 23, 559.
2. Xool-Tamayo, J.F.; Serrano-Gamboa, J.G.;,Monforte-González, M.; Mirón-López, G.; Vázquez-Flota, F.; Biotechnol. Lett. 2017, 39, 323. 3. Robbins, R. C.; Artuso-Ponte, V. C.; Moeser, A. J.; Morrow, W. E.;
Spears, J. W.; Gebreyes, W. A.; Am. J. Vet. Res. 2013, 74, 1530. 4. Lan, J.; Zhao, Y. Dong, F.; Yan, Z.; Zheng, W.; Fan, J.; Sun, G.; J.
Ethnopharmacol. 2015, 161, 69.
5. Rubio-Piña, J.; Vázquez-Flota, F.; Curr. Top. Med. Chem. 2013, 13, 2200.
6. Monforte-González, M.; Guízar-González, C.; Rubio-Piña, J.; Carrillo-Pech, M.; Vázquez-Flota, F.; J. Planar Chromatogr.--Mod. TLC 2012, 4, 358.
7. Díaz-Chávez, M. L.; Rolf, M.; Gesell, A.; Kutchan, T. M.; Arch. Biochem. Biophys. 2011, 507, 186.
8. Farrow, S. C.; Hagel, J. M.; Facchini, P. J.; Phytochemistry 2012, 77, 79. 9. Kursinszki, L.; Sárközi, Á.; Kéry, Á.; Szöke, E.; Chromatographia 2006,
63, S131.
10. Lu, B.; Liu, Y.; Yin, L.; Wang, X.; Peng, J.; Phytochem. Anal. 2009, 5, 385.
11. Cheng, X.; Wang, D.; Jiang, L.; Yang, D.; Phytochem. Anal. 2008, 5, 420.
13. United States Pharmacopeia; Validation of Compendial Methods, Section [1225], United States Pharmacopeal Convention: Rockville MD, 1999. 14. International Conference on Harmonization, Guidance for Industry, Q2B
Validation of Analytical Procedures: Methodology. ICH: Rockville MD, 1996.
15. Huber, L; Validation and Qualification in Analytical Laboratories, Interpharm, Informa Healthcare: New York, 2007.
16. Gu, Y.; Qian, D.; Duan, J. A.; Wang, Z.; Guo, J.; Tang, Y.; Guo, S.; J. Sep. Sci. 2010, 33, 1004.
17. Paltinean, R.; Toiu, A.; Wauters, J. N.; Frederich, M.; Tits, M.; Angenot, L.; Tamas, M., Crisan, G.; Digest Journal of Nanomaterials and Biostructures 2013, 8, 817.
18. Chen, X.; Dang, T-T., T.; Facchini, P. J.; Phytochemistry 2015, 11, 7. 19. Liu, Q.; Zhou, B.; Wang, X.; Ke, Y.; Jin, Y.; Yin, L.; Liang, X.; J. Sep.
Sci. 2012, 35, 3317.