Article
0103 - 5053 $6.00+0.00*e-mail: [email protected]
Gunshot Residues: Screening Analysis by Laser-Induced Breakdown Spectroscopy
Maria José Silva,a Juliana Cortez,b Celio Pasquini,b Ricardo S. Honorato,c
Ana Paula S. Paima and Maria Fernanda Pimentel*,d
aDepartamento de Química Fundamental, Universidade Federal de Pernambuco, 50740-540 Recife-PE, Brazil
bInstituto de Química, Universidade Estadual de Campinas, CP 6154, 13084-971 Campinas-SP, Brazil
cDepartamento da Polícia Federal, Superintendência Regional em Pernambuco, 50030-230 Recife-PE, Brazil
dDepartamento de Engenharia Química, Universidade Federal de Pernambuco, 50740-521 Recife-PE, Brazil
A espectroscopia de emissão em plasma induzido por laser (LIBS) foi avaliada para a detecção de resíduos de disparo de arma de fogo (GSR) nas mãos de um suspeito. Para desenvolver o procedimento, 114 amostras foram obtidas pressionando um pequeno pedaço de ita adesiva contra a região dorsal das mãos de não-atiradores, atiradores após o disparo e de atiradores após terem lavado as mãos com sabão e água. As itas foram analisadas diretamente em um equipamento LIBS baseado em um policromador echelle com resolução temporal construído em laboratório. Os espectros foram obtidos a partir da aplicação de um único pulso de laser em 20 locações diferentes, espalhadas uniformemente sobre a superfície da ita, para assegurar uma amostragem eiciente na detecção de resíduos de disparo. Os espectros mostram uma assinatura com linhas de emissão características de bário e chumbo. Quando os dados espectrais foram submetidos à técnica de reconhecimento de padrão SIMCA (Modelagem Independente e Flexível por Analogia de Classe), atiradores e não-atiradores foram corretamente classiicados. O método baseado em LIBS e SIMCA demonstrou ser não-destrutivo da evidência do crime e permitiu discriminar as amostras coletadas de voluntários não-atiradores e atiradores, mesmo após a lavagem das mãos.
Laser induced breakdown spectroscopy (LIBS) is further developed for the detection of gunshot residue (GSR) on the hands of a suspected shooter. To develop the procedure, 114 samples were obtained by pressing a small piece of adhesive tape against the dorsal region of the hands of non-shooters, of shooters just after iring a weapon, and of shooters after washing their hands with soap and water. The tapes were analyzed directly in a time-resolved echelle based LIBS system, assembled in the laboratory, and 20 single laser pulses, spread uniformly on the tape surface, were shown to be enough to ensure the detection of true positives. The spectra obtained by LIBS from the tape present a signature with emission lines that are attributed to barium and lead. After the spectral data was submitted to a pattern recognition method SIMCA (Soft Independent Modeling of Class Analogy), shooters and non-shooters were corrected classiied. The method based on LIBS and SIMCA has been demonstrated to be non-destructive of crime evidence and enabled discrimination between the samples collected from non-shooter volunteers and shooter volunteers before and after washing their hands.
Keywords: laser-induced breakdown spectroscopy, gunshot residues, SIMCA, screening analysis, LIBS
Introduction
Gunshot residues (GSR) evidence has been considered essential during recent decades in forensic science as it makes it possible to determine if a suspect has ired, been in crime location or come into contact with a irearm.
Despite the recent advances in the production of the so called clean ammunitions and well sealed guns, the use of cheap and widespread standard ire arms and propulsive charge remains associated with the majority of hand-armed crimes.1 At the moment of shooting an assortment of vapors
are expelled.2 It is now common knowledge that these
residues are mainly composed of lead (from the initiator), barium (from the oxidant), and antimony and lead (from the fuel), when common ammunition is employed. In addition to these predominant elements (Sb, Ba and Pb), shot residues can also contain trace amounts of Cu, Si, Al, Fe, S, P (rare), K, Cl, Mg, Zn (if Cu is also present) and Ni (rare and only together with Cu and Zn).1,3,4
Gunshot residues (GSR) are formed from a mixture of partially molten and vaporized bullet and primer materials, produced under the speciic conditions of high temperature (1500-2000 °C) and pressure (104 kPa) after the detonation
of the primer mixture, which occurs within ten thousandth of a second. These “speciic” conditions contribute to rapid condensation of GSR particles in their characteristic surface morphology, as also in their inner distribution of Pb, Sb and Ba. Due to cohesive intermolecular forces, these particles are predominantly spherical in shape, ranging in size from 1 to 10 µm.5,6 The type of ammunition may have inluence
on the amount of residue formed, on its composition and dispersion and deposition on the shooter body and clothes.6
Part of the residues produced can be found on the back of the hand, face, hair, and clothing of of the shooter and on nearby objects. Normally, only trace amounts are deposited, but these could be suficient to determine if an individual has recently discharged a weapon. Generally there is a greater quantity of these elements on the hand just after a handgun has been ired. The amount of these elements on the hands of a shooter depends, however, on several factors: the type of the weapon, the munitions used, the age and condition of the weapon, the suspect’s personal hygiene, the time elapsed since the iring, the environment and the routine occupational habits of the shooter.6 This
is a delicate question, however, because of the possibility of incriminating innocent people in criminal occurrences. With respect to this, studies have conirmed that, in the majority of cases, people with automobile-related jobs such as mechanics (batteries, motors, tyres), automotive electricians, users of cartridge-operated industrial tools, and people who work with ireworks have been shown to have higher levels of Ba, Pb and Sb on their hands, which, in some cases, may cause “false-positive” results.2,3,7,8 For
criminal justice, however, evidence of gunshot residue is only taken into consideration when “unique” GSR particles with the following elemental compositions: (1) Pb-Ba-Sb, (2) Sb-Ba or (3) Pb-Ba-Ca-Si-Sn are found.
Chemical tests, based on color reactions to identify suspects at crime scenes, such as the “dermal nitrate test”,9 Griess reagent10 and sodium rhodizonate,11 but due
to numerous incidences of false positive results these tests were abandoned by forensic scientists. Nowadays,
the investigation of gunshot residue particles in forensic laboratories is usually performed by scanning electron microscopy-energy-dispersive X-ray spectroscopy (SEM-EDS),12,13 using the tape-lift method for sample
collection.14-17 SEM-EDS has been used to carry out
concurrent analysis of both elemental composition and morphology of single particles. The main disadvantage of SEM-EDS, however, is the excessive time required to search and locate the particles on a large area of a tape-lift. Moreover, this technique is expensive and only available in a limited number of Police Crime Laboratories.
Several others techniques have also been evaluated to determine elements in gunshot residues collected from a specific area of a hand, each exhibiting advantages and drawbacks, such as neutron activation analysis (NAA),18 lame
atomic absorption spectrometry (FAAS),19 graphite furnace
atomic absorption spectrometry (GFAAS),20 anodic stripping
voltammetry (ASV),21 differential pulse anodic stripping
voltammetry (DPASV),22 proton-induced X-ray emission
(PIXE),23 inductively coupled plasma mass spectrometry
(ICP-MS),24,25 inductively coupled plasma optical emission
spectrometry (ICP OES),26 photoluminescence spectroscopy27
and luorescence microscopy.28
Due to the need for a rapid and sensitive method at low cost, there has been great interest in alternative methods capable of furnishing simultaneous elemental analysis of higher speciicity for gunshot residue. Laser induced breakdown spectroscopy (LIBS) appears an attractive tool for screening analyses that can be used to determine whether or not a person has discharged a irearm.
LIBS provides some advantages over traditional methods of elemental analysis, such as rapid measurement, sufficient detectability, and the possibility for non-destructive simultaneous multi-element analysis. Moreover, it is a relatively simple method and little or no sample preparation is required. The technique utilizes a pulsed laser focused on a small spot of the sample surface.29 The
Despite extensive use of LIBS, only three works can be found in the specialized literature reporting on its use in forensic elemental analysis to identify GSR.14-16 Dockery
and Goode showed the potential of the LIBS method to identify trace amounts of gunshot residue (mainly Ba and Pb) on the hands of a suspected shooter.15 They employed,
during the test iring, 6 shooters, obtaining 42 possible positive tests and also 20 blanks. Only one type of weapon and ammunition was employed, limiting the sources of variability associated with the amount of GSR. All spectra consisted of the emission observed from one laser pulse. The sampling tape was probed by the laser in 20 locations and a “maximum spectrum” created, consisting of the largest observed signal found at each wavelength in any of the 20 individual spectra obtained from the sample. The error rates associated with LIBS identiication of a subject who ired one shot were evaluated by Monte Carlo simulation techniques, and criteria were proposed for deining positive or negative test result.15 In a more recent work, the same
group investigated the lifetime of detectable amounts of gunshot residue on the hands of a shooter.16 The authors used
the univariate approach based only on the barium emission line at 455.403 nm. Statistically signiicant results, positive for GSR, were found 5.27 days after a irearm discharge.
The present work reports the results of a broad investigation on the application of LIBS to detect GSR on the hands of a suspected shooter. For instance, different types of cartridges and ammunition, ired using two types of weapons were employed. SIMCA was applied to the spectral data in order to classify samples as produced by shooters and nonshooters. In addition, the non-destructive characteristic of the LIBS protocol for GSR detection regarding the preservation of the crime evidence is demonstrated.
Experimental
Ammunition and irearms
A sequence of 51 tests of shots was carried out using 9 volunteers, on different occasions, at the Shooting Association of Recife. In each occasion, the number of shots varied from 1 to 5 consecutive detonations. Cartridges with extension jacketed, semi-jacketed and unjacketed projectiles and twelve types of the ammunition (original and rechargeable) with a 9 mm Luger, a .380 AUTO, a .38 SPL and a .357 Magnum ire guns were used. The majority of the ammunition used was produced by CBC (Brazilian Cartridge Company), and only one type was manufactured by FCC (Federal Cartridge Company) and WCC (Western Cartridge Company) both from the USA.
Collection of sample and shot tests
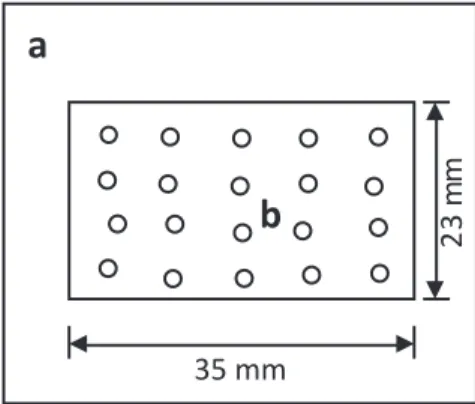
The collection of samples was carried out using an adhesive tape (3M Scotch), which was later adhered to a plastic frame (used for projection slides), with external dimensions of 50 × 50 mm and internal dimension of 23 × 35 mm, as shown in Figure 1. Tapes of two different widths (25 mm and 45 mm) were employed. Nine volunteers were used to make shots on different ocassions and 97 samples were collected from their hands. The collection procedure for each sample consisted in pressing and removing the same tape piece 10 times each on the dorsal region of both right and left hand of the volunteer. Samples (S) were collected after each session of shots. In order to investigate the permanence of the residues, samples were also collected after the volunteers had washed their hands with soap and water (W). For preliminary evaluation of the persistence of gunshot residue over time, 2 samples were colleted after 16 h of iring 1 or 2 shots. To avoid contamination of GSR, the weapons used were carefully cleaned between uses. For 6 samples, instead of adhesive tape, a liquid polymeric resin, composed of alginate, was used.38 A swab was used to spread
the resin over the dorsal region of the volunteers’ hands, which were then covered with gauze until completely dry. Then, the resin was removed from the hands of the volunteer. Samples were also collected from the hands of 15 volunteers who had never shot a weapon and had not participated in the shooting sessions (N). Three additional samples were taken from the hands of a automobile brake repair workers, in order to investigate possible false positive results of GSR.
Instrumentation and detection of GSR
A schematic diagram of the LIBS instrument, assembled in Instituto de Química-UNICAMP, can be found in Pontes et al.39 A pulsed Q-switched Nd:YAG laser
of 5.5 ns at FWHM) was employed. The laser pulse was relected at 45o by a dichroic mirror and sent to a biconvex
lens of 10 cm focal length, which focused the laser on the surface of the adhesive tape. The nominal irradiance of the system is around 1.5 × 10¹⁰ Wcm-2. The focal point was set
6 mm below the sample surface to minimize breakdown over the sample. The radiation emitted by the plasma was collected by a quartz biconvex lens, with a focal length of 30 mm, coupled to an optical iber of 50 μm diameter (Ceram Optec), which delivers it to an echelle spectrometer (Mechelle 5000, Andor Tehnology) for detection by an ICCD camera (iStar DH734, Andor Technology). The emission signals for Ba, Pb and Sb were identiied using the NIST Atomic Spectra.40
The spectra were displayed and analyzed using the software Andor iStar versão 4.1.0.0 12C. To avoid the effect of the high background intensity of continuum emission, a delay of 3 µs was employed before detection was started.
The emission spectra resulted from 30 µs integration of the
emitted radiation after the initial delay.
For the scanning electron microscopy energy-dispersive X-ray spectroscopy (SEM-EDS) analysis, a model JEOL JSM-6360 instrument was used
Sampling procedure
The exposed area of the adhesive tape or resin was probed by iring 20 single laser shots distributed more or less equidistantly as shown in Figure 1. Following sampling of the irst pulse and the acquisition of the emission spectrum, 5 dummy pulses were ired in the same location in order to mark the sampled spot in a way that it could be recognized by the naked eye. This procedure avoids that the same location of the tape might be probed again in a further test by LIBS or by a complementary technique such as SEM-EDS.
Two samples, collected from the hands of a gun-shooter, earlier measured by LIBS, as described above, were re-sampled by iring two additional sets of 20 laser shots in between the spots previously sampled. The two additional sets of spectra were employed to verify if the tape samples are preserved for further analysis, after being irstly probed by LIBS.
One sample was also analyzed using SEM-EDS, in accordance with ASTM 1588-95 (Analysis of GSR by scanning electron microscopy energy-dispersive X-ray spectroscopy).
SIMCA
SIMCA is a well-known tool in multivariate data analysis for supervised pattern recognition, based on principal
component analysis (PCA).41,42 PCA can simplify data by
reducing the number of variables into a smaller number of orthogonal variables, which are linear combinations of the original variables (wavelength) and maximize the variability contained within them, thereby displaying most of the original variability in a smaller number of dimensions. SIMCA modeling consists in building one PCA model for each class, which describes the structure of that class as well as possible. The modeling stage needs enough samples as members of each class to be able to build a reliable model. It also requires enough variables to describe the samples accurately. The actual classiication stage uses signiicance tests, where the decisions are based on statistical tests performed on the object-to-model distances. SIMCA was mainly employed to verify the possibility of distinguishing samples collected from the hands of those volunteers who had ired a gun (S) or had ired a gun and had washed their hands (W), or had not ired a gun for at least one week before sample collection named here as non-shooters (N).
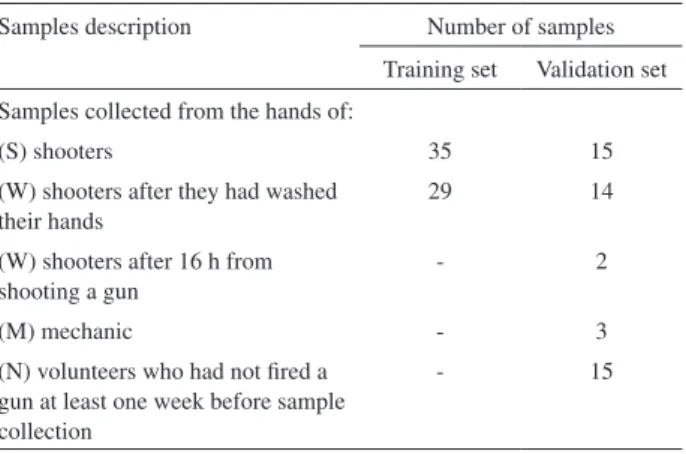
In the modeling stage was employed a training set containing samples collected from the hands of those volunteers who had ired a gun (S) plus samples collected from the hands of those who had ired a gun and had washed their hands (W), totalizing 64 samples (Table 1). Just one class was modeled, named here as shooter class. The optimal number of PCs was chosen using full-cross validation. The external validation set was composed by 49 samples, as described in Table 1.
The data matrix was composed of the average spectra (average of the spectra obtained from 20 locations, for each sample). Five spectral regions (405.4219 to 406.5749 nm; 454.3076 to 456.1812 nm; 492.5487 to 494.1394 nm; 612.8567 to 614.9184 nm; and 649.2721 to 651.0392 nm) have been selected in order to produce a data set (containing 264 variables) which includes the strongest emission peaks of Ba and Pb (according with NIST) and a surround portion Table 1. Training and external validation set description
Samples description Number of samples
Training set Validation set
Samples collected from the hands of:
(S) shooters 35 15
(W) shooters after they had washed their hands
29 14
(W) shooters after 16 h from shooting a gun
- 2
(M) mechanic - 3
(N) volunteers who had not ired a gun at least one week before sample collection
of the background signal, close to each peak. No background correction was found to be necessary. Spectral regions for Sb were not employed because the signal for this element was too low for most of the samples. After this selection, the resultant spectra were normalized by the maximum intensity.
Results and Discussion
Figure 2 shows a typical average LIBS emission spectrum obtained from the hands of a volunteer who had not ired a gun within at least one week before sampling (blank or non-shooter). Predominant emission lines are attributed to Ca, Na and K. Emission lines of Ba, Pb and Sb were not observed.
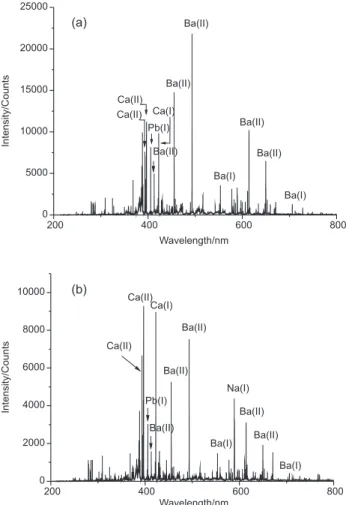
A typical average spectrum of a sample collected from the hands of a volunteer after iring ive shots (using a .380 AUTO pistol and cartridge manufactured by CBC) is presented in Figure 3a.The predominant lines of Ba and Pb, which are typically present in GSR, can be observed.
A sample collected from the hands of the same volunteer after he had washed his hands with soap and water is shown in Figure 3b. Emission lines of Ca and Na are present again, but intense emission lines from Ba and Pb, typical of GSR, were still observed.
Samples collected using the polymeric resin showed spectra similar to those presented in Figure 3, which demonstrates that this procedure is as eficient as the tape-lift method for removing the GSR from the hands of a shooter. The drawback of the resin based protocol is the time required for polymerization (about 20 min) and its very irregular morphology which makes analysis more dificult.
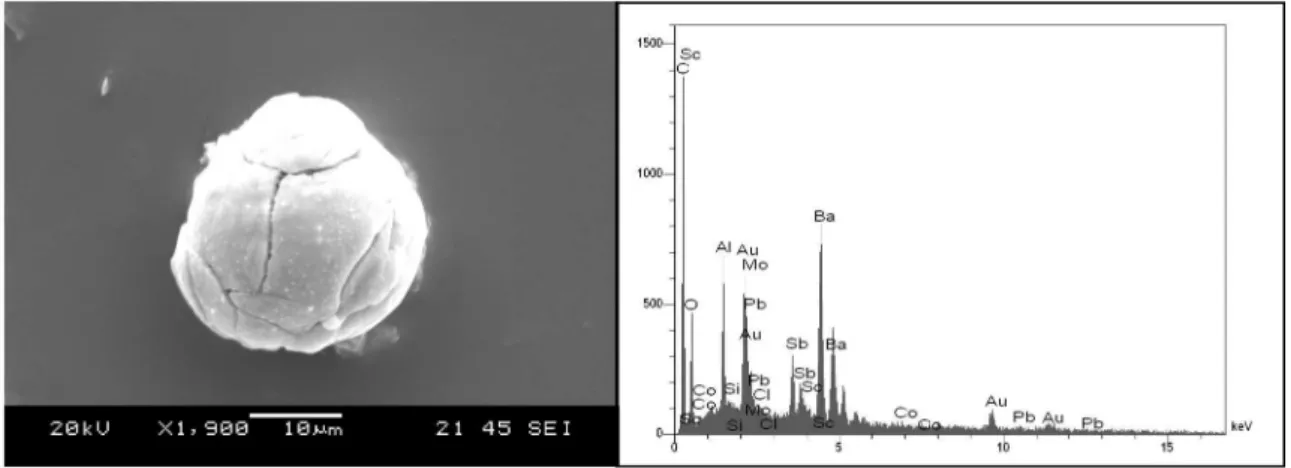
The sample whose spectrum is presented in Figure 3a was analyzed using SEM-EDS (Figure 4). The scanning was carried out on the surface of the sample and the chemical composition of the particles found, showing a consistent morphology with GSR, was determined. Lines of the three elements Pb, Ba and Sb in a single residual particle were observed.
The results found in the present study are in accordance with an early work on the same subject.14 On the other
hand, the eficiency of the LIBS technique was effectively evaluated by extending the study to the GSR generated by different types of guns and ammunitions. Also, the eficiency of the sampling protocol and other potential inluential factors (such as washing hands) were evaluated. In addition, the results found in the present investigation are in accordance with Rosenberg and Dockry,16 and even
Figure 2. Representative average emission spectrumfrom a sample collected from the hands of a volunteer who had not ired a gun within 48 h before sampling. Predominant emission lines emission were attributed to Ca (I) 422.67 nm, Ca (II) 393.36 nm, Ca (II) 396.85 nm, Na (I) 588.99 nm and K (I) 769.89 nm.
16 h after iring, it is possible to identify typical emission spectra from GSR on the hands of shooters.
It is known that some professional activities can induce false-positive results for GSR. This aspect was evaluated collecting samples from the hands of a mechanic, who works specifically with automobile brake pads. Representative average emission spectra are shown in Figure 5. In Figure 5a, Ca and Ba lines are predominant. After washing the hands with water and soap (Figure 5b), intense Ba and Pb lines are still present.
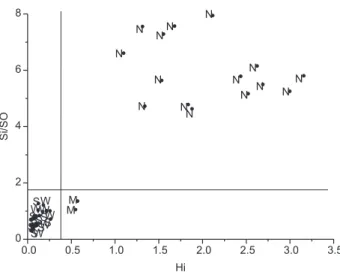
SIMCA classiication was carried out on the LIBS spectral data. Figure 6 shows the relative distance from the validation samples (Si/S0) versus leverage plot (Hi). The sample-to-model distance (Si) is a measure of how far the sample lies from the modeled class. It is computed as the square root of the sample residual variance. It can be compared to the overall variation of the class (referred as S0), and this is the basis of the statistical criterion used to decide whether a new sample can be classiied as a member of the class or not. The sample leverage is a measure of how far the projection of a sample onto the model is from the class center, i.e. it expresses how different the sample is from the other class members, regardless of how well it can be described by the class model. This plot includes the class membership limits for both measures. Samples which fall within both limits for a particular class are said to belong to that class. The level of the limits is governed by the signiicance level used in the classiication. In this work the level was 5%.
It can be seen that all samples collected from the hands of who had ired a gun was corrected classiied, even if they had washed their hands. The samples collected from the hands of the 2 volunteers 16 h after iring a gun were also corrected classiied. No false negative results were found. One of the 3 samples collected from the hands of a volunteer who works with automobile brake pads were also included in the shooter class, conirming the
problem of false-positives results. Two samples, however, were not classiied as shooters. These two samples fall Figure 4. SEM image and EDS spectrum of an “unique” GSR particle.
out of the class leverage limit, probably due to different ratio between the intensities of the spectral lines of the elements associated with GSR. All samples collected from the hands of who had not ired a gun were not classiied as shooters.
GSR is composed by well defined tiny spherical particles. The number of particles sampled from the hands of a shooter should depend on the number of shots ired. However, the analytical signal is composed only by the laser shots which reach a particle of GSR. In this work was demonstrated that 20 laser shots will take to a 100% correct detection of a true-positive sample. The signal intensity is consequence of statistically deined number of laser shots reaching the GSR. Therefore, there is a reasonable probability to attain an analytical signal for a sample collected after one gun shot that is stronger than a signal obtained after 5 gun shots, for instance. This was in fact observed in some cases in the development of this work.
These results demonstrate that is possible to classify shooters and non-shooters (even after hand washing). The problem of possible false-positive results due to the type of professional activity is also conirmed. However, LIBS can be proposed as a screening analysis method for identiication of GSR. Only samples classiied in the shooter group would be then submitted, for instance, to the more expensive and slower SEM-EDS analysis. In this case it is important to guarantee that the method would not give false negative results.
Another relevant aspect of any GSR screening technique is related to the preservation of the crime evidence. Of course, the use of LIBS for identiication of the elements
associated with GSR causes the vaporization and removal of the GSR particles from the sample spot irradiated by the laser pulse. However, the 20 pulses employed in the present study, considered of to be enough to eficiently detect all the true-positive cases, leave the sampling tape with a large non-probed area. This area can be used for additional screening (see Figure 1), via a counter-proof assay made by LIBS or another analytical technique. The additional screening analysis (2 for each 2 samples) showed the presence of GSR and the samples were again properly classiied as being collected from the hands of shooters.
Conclusions
Laser induced breakdown spectroscopy (LIBS) was found to be very eficient for detection of gunshot residues (GSR) common ammunition on the hands of a suspected shooter.
The spectra obtained presented a clear signature with emission lines attributed mainly to barium and lead. A SIMCA classiication using the spectral data showed that is possible to discriminate the samples collected from volunteers who had not ired a gun from those who ired a gun, even after washing their hands with soap. The false positive problem was also conirmed, but no false negative result was found. Thus, the methodology proposed in this work could be used as a screening analysis for GSR.
Although the LIBS screening procedure proposed can not be considered strictly non-destructive, the evidence is preserved due the micro-analytical capability of the technique. This allows for additional tests to be performed on the same sample after a irst LIBS result indicates the presence of GSR. Additional tests can be performed by using LIBS again or another approved technique.
The eficiency and accuracy of the technique could be further improved by coupling the LIBS system to an optical microscope to locate and characterize the typical shape of the GSR particles while orienting the focusing spot of the laser pulse on such particles. Then, unequivocal information regarding particle shape and its chemical composition could be employed, in a complementary way, to ensure better accuracy for GSR detection and possibly excluding some false-positives detected by the method.
Further studies may reveal the potentiality of LIBS for detection of GSR produced by clean ammunition by searching for ingerprints associated with the ratios of the intensities of elements associated with the residue of the organic compounds employed as primers (mainly C, O, N). However, the sampling protocol and sampling material substrate to collect the GSR from the shooter hands need to be developed before.
Acknowledgments
Authors are grateful to CAPES/PROCAD, CNPq, INCTAA and FAPESP for inancial support. Professor C. H. Collins is also kindly acknowledged for manuscript revision. CP is grateful to FAPESP for inancial support for the LIBS system.
References
1. Martiny, A.; Campos, A. P. C.; Sader, M. S.; Pinto, M. A. L.;
Forensic Sci. Int. 2008,177, 9.
2. Romolo, F. S.; Margot, P.; Forensic Sci. Int.2001,119, 195. 3. Wolten, G. M.; Nesbitt, R. S.; Calloway, A. R.; Loper, G. L;
Jones, P. F.; J. Forensic Sci. 1979, 24, 409. 4. Brozek-Mucha, Z.; X-Ray Spectrom. 2007,36, 398. 5. Zeichner, A.; Anal. Bioanal. Chem. 2003, 376, 1178. 6. Meng, H. H.; Caddy, B.; J. Forensic Sci. 1997, 42, 553. 7. Wolten, G. M.; Nesbitt, D. S.; Calloway, A. R.; Loper, G. L.;
J. Forensic Sci.1979, 24, 423.
8. Garofano, L.; Capra, M.; Ferrari, F.; Bizzaro, G. P.; Di Tullio, D.; Dell’Olio, M.; Ghitti, A.; Forensic Sci. Int.1999, 103, 1. 9. Heard, B. J.; Handbook of Firearms and Ballistics: Examining
and Interpreting Forensic Evidence, Wiley: Chichester, 1997. 10. Steinberg, M.; Leist, Y.; Goldschmidt, P.; Tassa, M.; J. Forensic
Sci.1984, 29, 464.
11. Tugcu, H.; Yorulmaz, C.; Karslioglu, Y.; Uner, H. B.; Koc, S.; Ozdemir, C.; Ozaslan, A.; Celasun, B.; Am. J. Forensic Med. Pathol.2006, 27, 296.
12. Germani, M. S.; J. Forensic Sci. 1991, 36, 331.
13. Cardinetti, B.; Ciampini, C.; D’Onofrio, C.; Orlando, G.; Gravina, L.; Ferrari, F.; Di Tullio D.; Torresi, L.; Forensic Sci. Int. 2004, 143, 1.
14. Goode, S. R.; Dockery, C. R.; Bachmeyer, M. F.; Nieuwlan, D. A. A.; Morgan, S. L.; Trends Opt. Photonics 2002, 81, 175. 15. Dockery, C. R.; Goode, S. R.; Appl. Opt.2003, 42, 6153. 16. Rosenberg, M. B.; Dockry, C. R.; Appl. Spectrosc.2008, 62,
1238.
17. Zeichner, A.; J. Forensic Sci.2001, 46, 1447.
18. Capannesi, G.; Ciavola, C.; Sedda, A. F.; Forensic Sci. Int.1993,
61, 75.
19. Koons, R. D.; Havekost, D. G.; Peters, C. A.; J. Forensic Sci.
1987, 32, 846.
20. Dahl, D. B.; Lott, P. F.; Microchem. J. 1987, 35, 347. 21. Briner, R. C.; Chouchoiy, S.; Webster, R.W.; Popham, R. E.;
Anal. Chim. Acta1985, 172, 31.
22. Woolever, A. C.; Dewald, H. D.; Forensic Sci. Int.2001, 117, 185.
23. Warren, M. W.; Falsetti, A. B.; Kravchenko, I. I.; Dunnam, F. E.; Van Rinsvelt, H. A.; Maples, W. R.; Forensic Sci. Int. 2002,
125, 37.
24. Sarkis, J. E. S.; Negrini Neto, O.; Viebig, S.; Durrant, S. F.;
Forensic Sci. Int.2007, 172, 63.
25. Steffen, S.; Otto, M.; Niewoehner, L.; Barth, M.; Brożek-Mucha, Z.; Biegstraaten, J.; Horváth, R.; Spectrochim. Acta, Part B
2007, 62, 1028.
26. Molina, D. K.; Martinez, M.; Garcia, J.; DiMaio, V. J. M.;
Am. J. Forensic Med. Pathol. 2007, 28, 191.
27. Jones, P. F., Nesbitt, R. S.;J. Forensic Sci. 1975, 20, 231. 28. Bird, D. K; Agg, K. M.; Barnett, N. W.; Smith, T. A.; Trevor,
A.; J. Microscopy2007, 226, 18.
29. Song, K.; Lee, Y.; Sneddon, J. In Advances in Atomic Spectroscopy-Vol. 7; Sneddon, J., ed.; Elsevier Science: Amsterdam, 2002, ch. 6.
30. Trevizan, L. C.; Santos, D.; Samad, R. E.; Vieira, J. N. D.; Nomura, C. S.; Nunes, L. C.; Ruini, I. A.; Krug, F. J.;
Spectrochim. Acta, Part B2008, 63, 1151.
31. Lee, W. B.; Wu, J. Y.; Lee, Y.; Sneddon, J.; Appl. Spectrosc. Rev.2004, 39, 27.
32. Pasquini, C.; Cortez, J.; Silva, L. M. C.; Gonzaga, F. B.; J. Braz. Chem. Soc.2007, 18, 463.
33. Winefordner, J. D.; Gornushkin, I. B.; Correll, T.; Gibb, E.; Smith, B. W.; Omenetto, N.; J. Anal. At. Spectrom.2004, 19, 1061.
34. Anzano, J. M.; Villoria, M. A.; Ruíz-Medina, A.; Lasheras R. J.; Anal. Chim. Acta2006, 575, 230.
35. Fortes, F. J.; Cortés, M.; Simón, M. D.; Cabalín, L. M.; Laserna, J. J.; Anal. Chim. Acta2005, 554, 136.
36. Moreno, C. L.; Palanco, S.; Laserna, J. J.; DeLucia, J. F.; Miziolek, A. W.; Rose, J.; Waltersc, R. A.; Whitehoused, A. I.;
J. Anal. At. Spectrom.2006, 21, 55.
37. Harmon, R. S.; DeLucia, F. C.; McManus, C. E.; McMillan, N. J.; Jenkins, T. F.; Walsh, M. E.; Miziolek, A.; Appl. Geochem.
2006, 21, 730.
38. http://peritocriminal.net/mambo/index2.php?option=com_ content&do_pdf=1&id=175, acessed in June 2006.
39. Pontes, M. J. C.; Cortez, J.; Galvão, R. K. H.; Pasquini, C.; Araújo, M. C. U.; Coelho, R. M.; Chiba, M. K.; Abreu, M. F.; Madari, B. E.; Anal. Chim. Acta 2009, 642, 12.
40. NIST Atomic Spectra Database, http://physics.nist.gov/ PhysRefData/ASD/lines_form.html, accessed in October 2008. 41. Naes, T.; Isaksson, T.; Fearn, T.; Davies, T.; A User-Friendly
Guide to Multivariate Calibration and Classiication, NIR Publications: Chichester, 2002.
42. Martens, H.; Russwurm, J. H.; Food Research and Data analysis, Applied Science Publishers: London, 1982.
Received: April 29, 2009
Web Release Date: November 12, 2009