Restriction in social participation and satisfaction with
hearing aids - a study on post-fitting
Restrição de participação social e satisfação com o uso de
aparelho de amplificação sonora individual - um estudo
pós-adaptação
Taís de Azevedo Picinini1, Liese Loureiro Weigert2, Camila Zander Neves3, Adriane Ribeiro Teixeira2,3
ABSTRACT
Introduction: Social integration is hampered by hearing loss. Purpose:
To identify the benefit and assess the satisfaction with the use of hearing aids and perception of limited social participation caused by hearing loss in adult and elderly hearing aids users. Another aim is to check whether there is a correlation between such measures. Methods: The
study included both male and female individuals who were assisted in a public hospital. The participants were asked to assign a score between 1 and 10 to their hearing level before and after starting to use hearing aids. They answered instruments that measure social participation restriction and satisfaction with use of hearing aids: the International Outcome Inventory for Hearing Aids (IOI-HA), the Hearing Handicap Inventory for Adults (HHIA) or the Hearing Handicap Inventory for the Elderly Screening Version (HHIE-S).Statistical analysis was performed. The level of statistical significance was 5%. Results: Of the42 individuals, 64.3% were elderly. IOI-HA total instrument scores, its factors 1 and 2 and HHIE-S presented a correlation with the Numerical Rating Scale (NRS) before amplification. There was correlation between the total IOI-HA instrument and its factor 2 with HHIE-S, total HHIA emotional and social domains. Conclusion: Adults and elderly are satisfied with
their hearing aid, and there was no difference between both groups. There is a directly inverse relationship between hearing loss levels and self-perception of hearing loss after hearing aid fitting. Also, the less restricted social participation is, the more benefits of using hearing aids are perceived by users.
Keywords: Hearing aids; Surveys and questionnaires; Auditory perception; Hearing loss; Hearing
RESUMO
Introdução: A integração social é dificultada pela perda auditiva. Objetivo: Verificar o benefício, a satisfação e a percepção da restrição de participação social, em função da perda auditiva, em adultos e idosos usuários de aparelho de amplificação sonora individual (AASI), bem como averiguar a correlação entre essas medidas. Métodos: O estudo
incluiu indivíduos de ambos os sexos, acompanhados em hospital público. Solicitou-se aos participantes que atribuíssem uma nota de 1 a 10 para sua audição, antes e após adaptação de AASI. Aplicaram-se os seguintes instrumentos para mensuração da restrição de participação social e da satisfação com o uso de AASI: International Outcome Inventory for Hearing Aids (IOI-HA) e Hearing Handicap Inventory for Adults (HHIA), nos adultos, e Hearing Handicap Inventory for the Elderly Screening Version (HHIE-S), nos idosos. O nível de significância
estatística adotado foi de 5%. Resultados: Dos 42 indivíduos participantes, 64,3% eram idosos. As pontuações dos instrumentos IOI-HA total, seus fatores 1 e 2 e o HHIE-S apresentaram correlação com a Escala de Classificação Numérica (ECN), antes da amplificação. Houve correlação entre o instrumento IOI-HA total e seu fator 2 com o HHIE-S, HHIA total e domínios emocional e social. Conclusão: Adultos
e idosos demonstraram satisfação com seus AASI e não houve diferença entre os grupos. Quanto mais acentuado o grau da perda auditiva, melhor foi a autopercepção da audição pós-adaptação de AASI. Quanto menor a restrição de participação, mais os benefícios do uso de AASI foram percebidos pelos usuários.
Palavras-chave: Auxiliares de audição; Inquéritos e questionários; Percepção auditiva; Perda auditiva; Audição
Study conducted at Speech-Language Pathology and Audiology Course, Universidade Federal do Rio Grande do Sul – UFRGS – Porto Alegre (RS), Brazil, and in the Hospital de Clínicas de Porto Alegre – HCPA – Porto Alegre (RS), Brazil.
(1) Post-Graduate in Human Communication Disorders, Universidade Federal de São Paulo – UNIFESP – São Paulo (SP), Brazil. (2) Speech-Language Pathology and Audiology Service, Hospital de Clínicas de Porto Alegre – HCPA – Porto Alegre (RS), Brazil. (3) Speech-Language Pathology and Audiology Course, Universidade Federal do Rio Grande do Sul – UFRGS – Porto Alegre (RS), Brazil.
Conflict of interests: No
Authors’ contribution: TAP conception and design of the study, data collection, data input into the database, data analysis and interpretation, drafting the article, critical revision of the article; LLW conception and design of the study, data analysis, drafting the article, critical revision of the article; CZN data collection, drafting the article, critical revision of the article; ART (advisor of the study): conception and design of the study, data analysis, drafting the article, critical
revi-sion of the article.
Corresponding author: Adriane Ribeiro Teixeira. E-mail: [email protected]
INTRODUCTION
Hearing is an essential sensory channel for human communication(1). Hearing loss has a negative impact on
people’s quality of life because auditory deficit can give rise to difficulty in understanding speech, especially by the elderly, who may suffer psychosocial consequences and feel unable to protect themselves in life-threatening situations. For these reasons, re-establishing audibility thresholds in the adult and elderly population is crucial. For that purpose, the use of a hearing aid(2) is highly recommended.
A hearing aid is an electronic device whose function is to amplify sound and stimulate residual hearing, thereby improving people’s hearing capacity(1). Hearing aids can be
purchased in private hearing clinics and also in hearing health care clinics accredited by Brazil’s Unified Health System (SUS) as of the year 2000.
Hearing loss may cause adult and elderly people to feel feel isolated and restrict their participation in daily life activities(3).
Despite the evolution of hearing aid technology in recent years, successful amplification of sound remains a challenge(1). The
selection and fitting of hearing aids will only be effective and produce good results if people actually use these devices on a regular basis(4). Therefore, research is required on the factors that
contribute to successful amplification(5). Validated self-evaluation
questionnaires are reliable, easy-to-apply tools for assessment of level of user satisfaction; they can also be used to assess the benefits achieved when limitations and social participation restrictions are reduced through the use of hearing aids(6). These
devices assist in research on areas that require improvement and enhancement; moreover, they enable an assessment of both the impact of hearing loss and the quality and effectiveness of hearing aids(7). As noted above, further research is required in
this field. Thus, the present study is relevant because it addresses limited social participation, individual satisfaction with the use of hearing aids, and self-perception of hearing before and after hearing aid fittings. Assessments of user satisfaction with hearing aids are essential in order to create new technologies that can increase the quality of sound amplification. In addition, it is imperative that speech-language therapists be aware of factors that can influence the success of sound amplification in order to increase user satisfaction and achieve more effective results with the use of hearing aids.
Therefore, the objective of the present study was to identify benefits and user satisfaction concerning the use of hearing aids, and self-perception of social participation restrictions caused by hearing loss in adults and elderly patients assisted in a public university hospital. Another aim was to investigate the correlation between these variables.
METHODS
The study was approved by the Research Ethics Committee
of the Hospital de Clínicas of Porto Alegre (HCPA), under
Protocol no. 1.760.868. Patients who volunteered to participate in the study were selected after they received proper guidance and signed an informed consent form. The sample included male and female adult and elderly individuals who are assisted in a hearing health care program in a general public university hospital. All the participants had previously undergone fitting to hearing aids. The following inclusion criteria were used: subjects had to be at least 18 years old; their hearing aid had to be provided at the hospital through the hearing health care program; they had to have been using the hearing aid regularly for at least 15 days at the time of evaluation. Subjects were excluded from the sample when diagnosed with neurological, language, psychiatric and/or cognitive disorders that could compromise the accuracy of responses. Exclusion factors were found in the diagnoses reported in the patients’ records, written by the health care teams of the hospital.
Data were collected during a follow-up appointment at the Speech-Language Pathology Clinic of the hospital. The first step of the assessment protocol was a case history interview designed by the researchers especially for the study. Afterwards, the participants were asked to assign a score from 1 to 10 to their hearing level before and after hearing aid fittings. They used a Numerical Rating Scale (NRS) to evaluate their self-perception about their hearing capacity: 1 represented the worst capacity and 10 represented the best capacity. NRS scales are reliable and commonly used for assessing the levels of pain and tinnitus. They can replace formal questionnaires for estimation of successful sound amplification and, therefore, they should be used together with other methods(8).
Subsequently, the International Outcome Inventory for Hearing Aids (IOI-HA) questionnaire was applied after being validated(9) and translated into Brazilian Portuguese(10). It
evaluates patients’ performance and satisfaction with the use of a hearing aid in daily activities. IOI-HA contains seven questions with five answer choices each. Each possible answer received a score from 1 to 5, where 1 is the worst result and 5 is the best result. The maximum score (sum of all items) is 35 points. A high score is indicative of a positive evaluation of hearing aid performance and the low score indicates a negative evaluation. Two factors were taken into account for the total score and the relative score: factor 1, which reflects a patient’s interaction with their hearing aid (questions 1, 2, 4, and 7, with a score ranging from 4 to 20) and factor 2, relative to the interaction between a patient and other people in their environment (questions 3, 5 and 6, with a score ranging from 3 to 15).
HHIA contains 25 questions, 13 of which are focused on the emotional consequences of hearing impairment while 12 refer to situational and social effects of this disability(11). The score
for the responses has the following answer choices: yes (each
answer is worth 4 points), no (0 points) and sometimes (each
answer is worth 2 points). The criterion for analysis of the answers to the questionnaire was that the higher the score, the greater a patient’s perception of their hearing impairment; in other words, the greater their perception of restrictions posed by hearing impairment(12).
HHIE-S is a reduced version of the Hearing Handicap Inventory for the Elderly (HHIE); it is easier to apply and easy to understand hence it is suitable for use with the elderly(13).
The questionnaire is composed of ten questions, divided into two scales (social/emotional and situational, with five items each). It uses the same scoring system of HHIA. Total scores between 0 and 8 points indicate absence of participation restriction; between 10 and 23, mild to moderate restriction. Total scores between 24 and 40 points are indicative of significant participation restriction. Both instruments were translated into Brazilian Portuguese and adapted to the Brazilian scenario in order to check both the benefits and the reduction of participation restrictions that may result from the use of a hearing aid(14). Type and level of hearing loss were
determined according to the classification of the World Health Organization(15), and the four-tone average of hearing thresholds
was calculated (500 Hz to 4000 Hz).
After collection, the data were entered into a Microsoft Excel® spreadsheet. Based on a similar study(16), sample
size was calculated through the software Programs for
Epidemiologists for Windows (WinPEPI), version 11.43 For the significance level of 5%, power of 80% and minimum correlation coefficient of 0.44 between the HHIE-S and IOI-HA scales, sample size was at least 39 subjects. Quantitative variables were expressed as mean and standard deviation, or median and interquartile range. Qualitative variables were expressed as absolute and relative frequencies.
The independent samples t-test was used to compare the means between age groups, and the Mann-Whitney test was applied when there was asymmetrical distribution. Pearson’s chi-square or Fisher’s exact tests were used for comparison of proportions. The paired samples t-test was used to compare auditory self-perception (using the Visual Analogue Scale, VAS) before and after hearing aid fittings. Spearman’s rank correlation was applied to measure the correlation between continuous and ordinal variables. The significance level was set at 5% (p≤0.05) and the analyses were performed in the Statistical Package for the Social Sciences (SPSS), version 21.0.
RESULTS
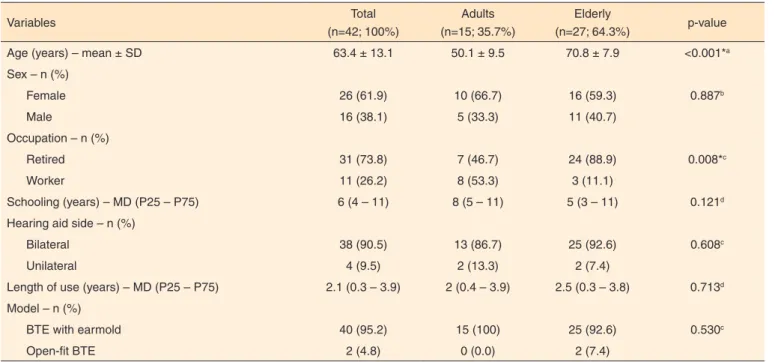
The study sample consisted of 42 individuals, mostly elderly (64.3%). Among the variables, only age and occupation were correlated in the adult and elderly groups. Therefore, it was inferred that the profile of both groups was homogeneous (Table 1).
Sensorineural hearing loss was the most prevalent type of loss in both ears. Moderate and severe levels of hearing loss were predominant in the right ear while a moderate degree was most frequently found in the left ear. There was no difference
Table 1. Characterization of the sample
Variables Total
(n=42; 100%)
Adults (n=15; 35.7%)
Elderly
(n=27; 64.3%) p-value
Age (years) – mean ± SD 63.4 ± 13.1 50.1 ± 9.5 70.8 ± 7.9 <0.001*a
Sex – n (%)
Female 26 (61.9) 10 (66.7) 16 (59.3) 0.887b
Male 16 (38.1) 5 (33.3) 11 (40.7)
Occupation – n (%)
Retired 31 (73.8) 7 (46.7) 24 (88.9) 0.008*c
Worker 11 (26.2) 8 (53.3) 3 (11.1)
Schooling (years) – MD (P25 – P75) 6 (4 – 11) 8 (5 – 11) 5 (3 – 11) 0.121d
Hearing aid side – n (%)
Bilateral 38 (90.5) 13 (86.7) 25 (92.6) 0.608c
Unilateral 4 (9.5) 2 (13.3) 2 (7.4)
Length of use (years) – MD (P25 – P75) 2.1 (0.3 – 3.9) 2 (0.4 – 3.9) 2.5 (0.3 – 3.8) 0.713d
Model – n (%)
BTE with earmold 40 (95.2) 15 (100) 25 (92.6) 0.530c
Open-fit BTE 2 (4.8) 0 (0.0) 2 (7.4)
* Significant values (p≤0.05): a Student’s t-test; c Fisher’s exact test b Pearson’s Chi-square test (p≤0.05); d Mann-Whitney Test (p≤0.05)
between the groups of adults and the elderly for average hearing thresholds, degree and type of hearing loss in both ears (Table 2).
The score for HHIE-S was 10 points in the elderly (P25 and P75: 6-16) and the score for HHIA was 30 points in adults (P25 and P75: 4-60). The emotional domain of HHIA was 16 points (P25 and P75: 0-26) while the social domain was 14 points (P25 and P75: 2-26).
There was no difference between the group of adults and
the group of the elderly in the total scores of the IOI-HA questionnaire, and neither for factors “1” (interaction of the patient with HA) and “2” (interaction of the patient with other people in their environment) (Table 3).
On the NRS, there was a difference in the scores assigned to hearing both before and after amplification in both age groups (p<0.001). However, there was no difference between age groups (p=0.710) (Figure 1).
Before and after the use of hearing aids, the NRS was
Table 2. Average of hearing thresholds, degree and type of hearing loss in adults and the elderly
Variables Total
(n=42; 100%)
Adults (n=15; 35.7%)
Elderly
(n=27; 64.3%) p-value
Four-tone average - mean ± SD
RE 57.3 ± 19.1 54.4 ± 19.8 58.9 ± 18.9 0.478a
LE 62.4 ± 21.8 62.7 ± 24.5 62.2 ± 20.7 0.948a
Type of loss – n (%)
RE
Sensorineural 30 (71.4) 12 (80.0) 18 (66.7) 0.173b
Mixed 11 (26.2) 2 (13.3) 9 (33.3)
Conductive 1 (2.4) 1 (6.7) 0 (0.0)
LE
Sensorineural 27 (65.9) 10 (71.4) 17 (63.0) 0.254b
Mixed 13 (31.7) 3 (21.4) 10 (37.0)
Conductive 1 (2.4) 1 (7.1) 0 (0.0)
Degree of loss – n (%)
LE
Normal 0 (0.0) 0 (0.0) 0 (0.0) 0.980b
Mild 9 (21.4) 3 (20.0) 6 (22.2)
Moderate 15 (35.7) 6 (40.0) 9 (33.3)
Severe 15 (35.7) 5 (33.3) 10 (37.0)
Profound 3 (7.1) 1 (6.7) 2 (7.4)
RE
Normal 1 (2.4) 0 (0.0) 1 (3.7) 0.508b
Mild 8 (19.0) 3 (20.0) 5 (18.5)
Moderate 15 (35.7) 7 (46.7) 8 (29.6)
Severe 8 (19.0) 1 (6.7) 7 (25.9)
Profound 10 (23.8) 4 (46.7) 6 (22.2)
a Student’s t-test; b Pearson’s Chi-square Test (p<0.05)
Subtitle: SD = standard deviation; RE = right ear; LE = left ear
Table 3. Scores of Questionnaire International Outcome Inventory for Hearing Aids in adults and the elderly
Questionnaire Total
(n=42; 100%)
Adults (n=15; 35.7%)
Elderly
(n=27; 64.3%) p-value
IOI-HA
Total mean ± SD 32.0 ± 3.6 32.2 ± 4.2 31.9 ± 3.2 0.815
Factor 1 mean ± SD 17.6 ± 2.0 18.1 ± 1.9 17.3 ± 2.1 0.266
Factor 2 mean ± SD 12.7 ± 2.2 12.3 ± 2.8 12.9 ± 1.8 0.412
Student’s t-test (p≤0.05)
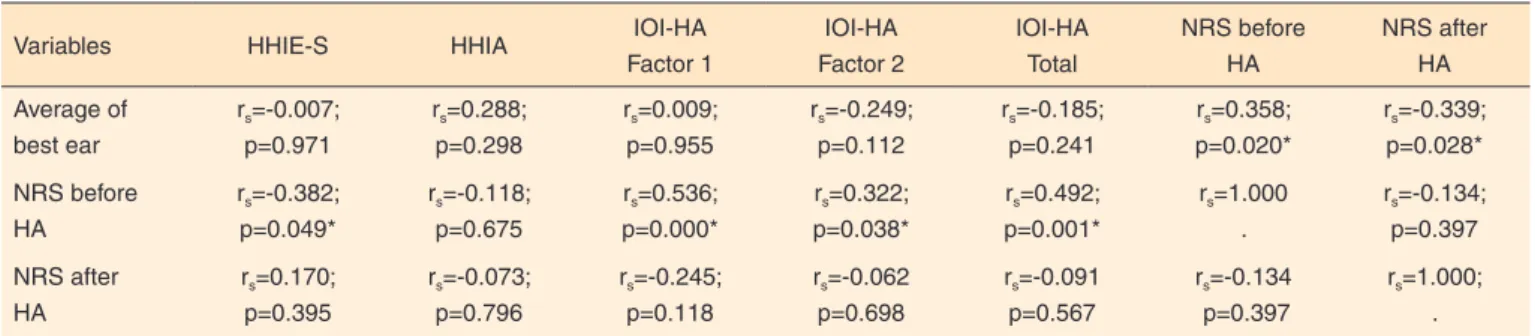
correlated with the four-tone average of the auditory thresholds in the best ear. Total IOI-HA scores (and respective “1” and “2” factors) and HHIE-S were correlated with the NRS before HA fittings. There was a correlation between the total IOI-HA scores and the “2” factor when compared to the HHIE-S scores, total HHIA score and the respective emotional and social domains (Table 4 and Table 5).
DISCUSSION
In the study sample, the percentage of elderly people (64.3%) was higher than that of adults (35.7%), as a result of an increase in the number of elderly population in Brazil and worldwide. Another reason is that hearing loss affects older people more often than adults. These data confirm the findings of other studies in the specialized literature(17,18,19).
There was a predominance of females (61.9%), which is due to higher life expectancy of women in Brazil(20). In addition,
women seek health care more regularly than men. Conversely, men are not concerned about health promotion and disease prevention. They have difficulty acknowledging that they are ill and have fear of discovering that they have a serious illness. For these reasons, they do not seek health care(21).
Table 4. Correlation of the average of the best ear and Numerical Rating Scale before and after the use of hearing aid with the HHIE-S, HHIA and OIO-HA
Variables HHIE-S HHIA IOI-HA
Factor 1 IOI-HA Factor 2 IOI-HA Total NRS before HA NRS after HA Average of best ear
rs=-0.007;
p=0.971
rs=0.288;
p=0.298
rs=0.009;
p=0.955
rs=-0.249;
p=0.112
rs=-0.185;
p=0.241
rs=0.358;
p=0.020*
rs=-0.339;
p=0.028*
NRS before HA
rs=-0.382;
p=0.049*
rs=-0.118;
p=0.675
rs=0.536;
p=0.000*
rs=0.322;
p=0.038*
rs=0.492;
p=0.001*
rs=1.000
.
rs=-0.134;
p=0.397
NRS after HA
rs=0.170;
p=0.395
rs=-0.073;
p=0.796
rs=-0.245;
p=0.118
rs=-0.062
p=0.698
rs=-0.091
p=0.567
rs=-0.134
p=0.397
rs=1.000;
.
* Significant values (p≤0.05) – Student’s t-test for paired samples
Subtitle: HHIE-S = Hearing Handicap Inventory for the Elderly Screening Version; HHIA = Hearing Handicap Inventory for Adults; IOI-HA = International Outcome Inventory for Hearing Aids; NRS = Numerical Rating Scale; HA = hearing aid; rs = Spearman’s rank correlation
Table 5. Association of the HHIA and HHIE-S with IOI-HA and improvement in the NRS
Variables HHIE-S HHIA Total Emotional HHIA Social HHIA
IOI – HA
Total rs=-0.449;
p=0.019*
rs=-0.796;
p<0.001*
rs=-0.778;
p=0.001*
rs=-0.749;
p=0.001*
Factor 1 rs=-0.305;
p=0.122
rs=-0.373;
p=0.171
rs=-0.443;
p=0.098
rs=-0.321;
p=0.243
Factor 2 rs=-0.384;
p=0.048*
rs=-0.801; p<0.001*
rs=-0.789; p<0.001*
rs=-0.752; p=0.001*
Improvement in NRS rs=-0.293;
p=0.138
rs=-0.265;
p=0.339
rs=-0.417;
p=0.122
rs=-0.191;
p=0.496
* Significant values (p≤0.05) – Spearman’s correlation test
Subtitle: IOI-HA = International Outcome Inventory for Hearing Aids; HHIE-S = Hearing Handicap Inventory for the Elderly Screening Version; HHIA = Hearing Handicap Inventory for Adults; NRS = Numerical Rating Scale; rs = Spearman’s rank correlation
Subtitle: NRS = Numerical Rating Scale
Average level of schooling of the sample was six years, i.e., incomplete secondary education, which confirms previous data from the literature(22). Low levels of schooling were expected,
especially in view of the characteristics of the population assisted in a university hospital. Another reason is the fact that the research group consisted mainly of elderly patients. In Brazil, despite the decline in illiteracy rates for all age groups, the elderly still have a lower level of schooling and a higher incidence of illiteracy. This is due to increased access to basic and higher education as a result of policies that were created in the last decade(23).
All subjects presented bilateral hearing loss, mainly moderate to severe sensorineural loss. This result confirms the data described in the reviewed literature(16,19). Because of
the particular characteristics of participants’ hearing loss, the hearing aids were adapted bilaterally for 38 (90.5%) of them. In all subjects, behind-the-ear (BTE) models were used: 40 (95.2%) with an earmold and two (4.8%) with open-fit HAs; these data are comparable to those described in the literature(6,7).
The use of BTE hearing aids requires less battery consumption and, consequently, have a lower cost. Open-fit hearing aids are less often prescribed at the hospital where the present research was developed. The reason lies in the sociodemographic and auditory profile of the patients. In addition, BTEs are the preferred choice over other models because they are delivered sooner than in-ear devices. Other studies have also reported a preference for use of BTEs, and their samples were predominantly composed of elderly patients, assisted at public or private hearing clinics(6,7).
Binaural fitting can provide the individual better sound localization, binaural summation and better speech recognition in noisy environments; therefore, it should be prioritized(24).
With respect to the IOI-HA score, the global average was 32.0 ± 3.6 points, a similar value to the one found in previous research(25) (29.0 ± 4.8 points) and higher than the one found
by another study(26) (25.74 points). Moreover, similar values to
those recorded in the literature(7) were found for the score of
the sub-factors of IOI-HA: the “1” factor scored 17.9 points and the “2 factor” scored 13.2 points.
The NRS that was used to evaluate self-perception of hearing showed a significant difference when comparing the values assigned by the patients from the sample in the pre-fitting and post-pre-fitting periods. It should be pointed out that this can be a quick and simple measure of patients’ opinion about their hearing in both periods, as it enables the speech-language pathologist to make a comparison between the two moments. Moreover, such information can be used to analyze the impact of hearing loss in the patients’ life and to check if fitting with sound amplification devices improved the patients’ condition. Some authors have stressed that the score assigned by patients can be related to their decision to purchase a hearing aid(8,27). As for the values of HHIA and HHIE-S, the
data collected in this study were different from those reported
in previous studies, which reported an average of 45.9 ± 27 points for HHIA and 15.78 ± 18.03 points for HHIE-S(12,28).
The average score of HHIE-S showed a negative correlation when compared to VAS, prior to hearing aid use, that is, the lower the score a patient assigned to hearing before the use of a hearing aid, the more restricted their social participation was. Therefore, it can be inferred that the better the self-assessment of a patient’s hearing, the lower the restriction of their social participation.
There was a significant negative correlation between average of the best ear and NRS, after the use of a hearing aid. Therefore, the greater the degree of hearing loss, the better the self-perception of hearing with use of hearing aids. In the sample that was evaluated, individuals with a lesser degree of hearing loss felt benefits of sound amplification to a lower extent, compared with those who presented greater hearing loss. However, there was no association with average of the best ear, in comparison with the HHIE-S tool, which confirms the results found in the literature(29,30).
The analysis of the total IOI-HA score and the “2” factor negatively correlated, when correlated with HHIE-S and total HHIA, emotional dimension and social dimension. These results show that the greater the satisfaction with the use of hearing aids, the lower the social participation restriction on the basis of hearing loss, both in adults and in the elderly. The “2” factor, relative to the individual’s social interaction, led to a correlation between IOI-HA and the other tools. Thus, it was found that hearing loss has a major impact on the social factor, both in adults and in the elderly.
It is essential, therefore, that the individual and their family members should understand the communication difficulties arising from loss of hearing and its consequences, in order for amplification to be successful. Speech-language therapists should be aware of ways to minimize participation restrictions arising from auditory deficit so as to provide improved quality of life and decrease the isolation of these individuals.
CONCLUSION
The adults and the elderly showed satisfaction with their hearing aids, and there was no difference between the two groups. There is a directly inverse relationship between degree of hearing loss and self-perception of hearing after hearing aid fittings in both groups. The lower participation restriction is, the more benefits of using hearing aids were perceived by users.
REFERENCES
2. Korkmaz MH, Bayır Ö, Er S, Işık E, Saylam G, Tatar EÇ et al. Satisfaction and compliance of adult patients using hearing aid and evaluation of factors affecting them. Eur Arch Oto-Rhino-Laryngol. 2016;273(11):3723-32. https://doi.org/10.1007/s00405-016-4046-x 3. Mondelli MFCG, Souza PJS. Quality of life in elderly adults before
and after hearing aid fitting. Braz J Otorhinolaryngol. 2012;78(3):49-56. https://doi.org/10.1590/SS1808-86942012000300010
4. Rodrigues CCC, Aurélio FS, Silva VB, Lopes TA. Benefício fornecido pelo uso de aparelhos de amplificação sonora individual em idosos de um programa de saúde auditiva de Porto Velho-RO. Rev CEFAC. 2013;15(5):1170-80. https://doi.org/10.1590/S1516-18462013005000025
5. Peruzzo Q, Ceolin D, Quevedo LS. Satisfaction of hearing implant users. Rev CEFAC. 2015;17(4):1042-54. https://doi. org/10.1590/1982-0216201517415914
6. Silva DCO, Scharlach RC. Hearing aids users’ satisfaction attending a private service. Rev CEFAC. 2015;17(6):1863-73. https://doi. org/10.1590/1982-021620151766115
7. Moda I, Mantello EB, Reis ACMB, Isaac ML, Oliveira AA, Hyppolito MA. Evaluation of hearing aid user satisfaction. Rev CEFAC. 2013;15(4):778-85. https://doi.org/10.1590/S1516-18462013000400006
8. Palmer CV, Solodar HS, Hurley WR, Byrne DC, Williams KO. Self-perception of hearing ability as a strong predictor of hearing aid purchase. J Am Acad Audiol. 2009;20(6):341-7. https://doi. org/10.3766/jaaa.20.6.2
9. Cox RM, Alexander GC. The International Outcome Inventory for Hearing Aids (IOI-HA): psychometric properties of the English version. Int J Audiol. 2002;41(1):30-5. https://doi. org/10.3109/14992020209101309
10. Bevilacqua MC, Henriques JPS. Questionário Internacional: Aparelho de Amplificação Sonora Individual (QI- AASI). Copenhagen: BC Decker; 2002.
11. Newman CW, Weinstein BE, Jacobson GP, Hug GA. The Hearing Handicap Inventory for Adults: psychometric adequacy and audiometric correlates. Ear Hear. 1990;11(6):430-3. https://doi. org/10.1097/00003446-199012000-00004
12. Aiello CP, Lima II, Ferrari DV. Validity and reliability of the hearing handicap inventoty for adults. Braz J Otorhinolaryngol. 2 0 1 1 ; 7 7 ( 4 ) : 4 3 2 8 . h t t p s : / / d o i . o r g / 1 0 . 1 5 9 0 / S 1 8 0 8 -86942011000400005
13. Ventry IM, Weinstein BE. The hearing handicap inventory for the elderly: a new tool. Ear Hear. 1982;3(3):128-34. https://doi. org/10.1097/00003446-198205000-00006
14. Almeida K. Avaliação objetiva e subjetiva do benefício de próteses auditivas em adultos [tese]. São Paulo: Universidade Federal de São Paulo; 1998.
15. Organisation Mondiale de La Santé. Orientations futures Du programme de prevention de la surdite et de la deficience auditive. Rapport de la 1e. Consulttion Informelle, 1997 Jan 23-24, Genève. Genève: Organisation Mondiale de La Santé; 1999. (WHO/ PDH/97.3).
16. Grossi LMR, Scharlach RC. Análise da satisfação e das restrições de
participação em usuários de próteses auditivas: um estudo em idosos. Revista Equilíbrio Corporal e Saúde. 2015;3(1):3-15. https://doi. org/10.17921/2176-9524.2011v3n1p%25p
17. Dell’Antônia SF, Ikino CMY, Carreirão Filho W. Degree of satisfaction of patients fitted with hearing aids at a high complexity service. Braz J Otorhinolaryngol. 2013;79(5):555-63. https://doi. org/10.5935/1808-8694.20130100
18. Kayabaşoğlu G, Kaymaz R, Erkorkmaz Ü, Güven M. Study of hearing aid effectiveness and patien satisfaction. Kulak Burun Bogaz Ihtis Derg. 2014;25(3):158-62. https://doi.org/10.5006/ kbbihtisas.201529939
19. Kozlowski L, Ribas A, Almeida G, Luz I. Satisfaction of elderly hearing aid users. Int Arch Otorhinolaryngol. 2017;20(1):92-6. https://doi.org/10.1055/s-0036-1579744.
20. Instituto Brasileiro de Geografia e Estatística – IBGE. Teen. Expectativa de vida. Rio de Janeiro: Instituto Brasileiro de Geografia e Estatística; 2016 [acesso em 10 out 2016]. Disponível em: http:// teen.ibge.gov.br/noticias-teen/7827-expectativa-de-vida
21. Vieira KLD, Gomes VLO, Borba MR, Costa CFS. Atendimento da população masculina em unidade básica de saúde da família: motivos para a (não) procura. Esc Anna Nery. 2013;17(1):120-7. https://doi. org/10.1590/S1414-81452013000100017
22. Campos PD, Bozza A, Ferrari DV. Habilidades de manuseio dos aparelhos de amplificação sonora individuais: relação com satisfação e benefício. CoDAS. 2014;26(1):10-6. https://doi.org/10.1590/ S2317- 17822014.001-0003
23. Instituto Brasileiro de Geografia e Estatística – IBGE. Síntese de indicadores sociais: uma análise das condições de vida da população brasileira. Rio de Janeiro: Instituto Brasileiro de Geografia e Estatística; 2013 [acesso em 10 dez 2016]. (Estudos e pesquisas. Informação demográfica e socioeconômica, vol 35). Disponível em: http://biblioteca.ibge.gov.br/visualizacao/livros/ liv95011.pdf
24. Mueller HG, Ricketts TA, Bentler R. Modern hearing aids: pre-fitting testing and selection considerations. San Diego: Plural; 2014. Chapter 7, Hearing aid styles and fitting applications. p. 230-86. 25. Thunberg Jespersen C, Bille M, Legarth JV. Psychometric properties
of a revised Danish translation of the international outcome inventory for hearing aids (IOI-HA). Int J Audiol. 2014;53(5):302-8. https:// doi.org/ 10.3109/14992027.2013.874049
26. Barbosa MR, Medeiros DS, Rossi-Barbosa LAR, Caldeira AP. Self-reported outcomes after hearing aid fitting in Minas Gerais, Brazil. CoDAS. 2015;27(1):21-8. https://doi.org/10.1590/2317-1782/20152014090
27. Otavio ACC, CoradinI PP, Teixeira AR. Self-assessment of hearing and purchase of hearing aids by middle-aged and elderly adults. Int Arch Otorhinolaryngol. 2016; 20(1):48-53. https://doi. org/10.1055/s-0035-1554728
29. Menegotto IH, Soldera CLC, Anderle P, Anhaia TC. Correlação entre perda auditiva e resultados dos questionários Hearing Handicap Inventory for the Adults - Screening Version HHIA-S e Hearing Handicap Inventory for the Elderly - Screening Version - HHIE-S. Arq Int Otorrinolaringol. 2011;15(3):319-26. https://doi.org/10.1590/ S1809-48722011000300009