DOI: 10.4301/S1807-17752015000200008
___________________________________________________________________________________________
Manuscript first received/Recebido em: 19/07/2013 Manuscript accepted/Aprovado em: 10/06/2015 Address for correspondence / Endereço para correspondência
Fernando Antonio de Melo Pereira, PhD Student Faculdade de Economia, Administração e Contabilidade da Universidade de São Paulo - FEA/USP. Av. Prof. Luciano Gualberto, 908, Butantã, São Paulo/SP, Brazil. 05508-010. E-mail: [email protected] / [email protected]
Anatália Saraiva Martins Ramos, Dr. Universidade Federal do Rio Grande do Norte – UFRN, Rio Grande do Norte, RN, E-mail: [email protected]
Adrianne Paula Vieira de Andrade, PhD Student Universidade Federal do Rio Grande do Norte - UFRN. E-mail: [email protected]
Bruna Miyuki Kasuya de Oliveira, PhD Student Fundação Getúlio Vargas – FGV, São Paulo, SP, Brasil. E-mail: [email protected]
Published by/ Publicado por: TECSI FEA USP – 2015 All rights reserved.
USE OF VIRTUAL LEARNING ENVIRONMENTS: A
THEORETICAL MODEL USING DECOMPOSED EXPECTANCY
DISCONFIRMATION THEORY
Fernando Antonio de Melo Pereira
Universidade de São Paulo - FEA/USP, São Paulo, Brasil
Anatália Saraiva Martins Ramos
Universidade Federal do Rio Grande do Norte – UFRN, Rio Grande do Norte, RN, Brasil
Adrianne Paula Vieira de Andrade
Universidade Federal do Rio Grande do Norte – UFRN, Rio Grande do Norte, RN, Brasil
Bruna Miyuki Kasuya de Oliveira
Fundação Getúlio Vargas – FGV, São Paulo, SP, Brasil
______________________________________________________________________________________________
ABSTRACT
The present study aims to investigate the determinants of satisfaction and the resulting continuance intention in the e-learning context. The constructs of decomposed expectancy disconfirmation theory (DEDT) are evaluated from the perspective of users of a virtual learning environment (VLE) in relation to expectations and perceived performance. An online survey collected responses from 197 students of a public management distance learning course. Structural equation modeling was operationalized by the method of partial least squares in Smart PLS software. The results showed that there is a relationship between quality, usability, value and value disconfirmation with satisfaction. Likewise, satisfaction proved to be decisive for continuance intention. However, there were no significant relationships between quality disconfirmation and usability disconfirmation with satisfaction. Based on the results, it is discussed the theoretical and practical implications of the structural model found by the research.
JISTEM, Brazil Vol. 12, No. 2, May/Aug., 2015 pp. 333-350 www.jistem.fea.usp.br
1. INTRODUCTION
New organizational forms spawned by developments in information technology continue to attract researchers and practitioners (Chou; Min; Chang & Lin, 2010). Following this trend, e-learning or distance learning using a virtual learning environment (VLE) has become popular (Carvalho, 2009). Understanding the factors that influence satisfaction and desire to continue doing distance courses using virtual platforms is critical to achieve a high success rate in e-learning services (Chiu; Hsu; Sun; Lin & Sun, 2005). Empirical studies indicate that increased performance levels results in: increased motivation, positive attitudes toward technologies, higher levels of satisfaction, and higher meaningful learning achievement (Hung & Cho, 2008; Pachter; Majer & Macher, 2010; Lee, 2010).
The use of expectation disconfirmation theory (EDT) allows to assess satisfaction and continuance intention through the measurement of expectations and perceived performance levels of users (Oliver, 1980; Oliver & Swan, 1989; Chiu et al. 2005; Paechter et al., 2010). Expectations are beliefs about what will occur or what will be revealed in the future and play a role in learning, motivation, decision making, affective responding and forecasting, and social interaction (Hoorens, 2012). Performance is efficiency and effectiveness associated with a task’s completion. Efficiency is the level of resources consumed and effectiveness is the ability to users to complete tasks using technology. These factors affect levels of satisfaction (Coursaris; Hassanein; Head & Bontis, 2012).
The focus of the study is to measure the impact of attributes and user’s perceptions related to satisfaction and the decision to continue using web-based educational services in the context of e-learning. The following antecedents of user satisfaction are investigated: quality, usability and value, evaluated in two stages of the e-learning process, the expectation of service (disconfirmation) and perceived performance (confirmation), as it is defined by Chiu et al. (2005) with decomposed expectancy disconfirmation theory (DEDT). The study is used in the educational context; however, the theoretical model can be applied in professional environments.
“Carvalho (2009) argues that it is relevant to conduct research of this nature, as there are few studies that address aspects to evaluate performance of e-learning services with a focus on the VLE, with emphasis on the international level work of Chiu et al. (2005) and Lankton and McKnight (2006). So DEDT contributes to the literature, because besides the investigation of perceived performance of the course, the model also considers the expectations that the student has about a distance course, a fact that minimizes the absence of a longitudinal study. Most of the studies ignore the factors that are not confirmed because of the difficulty to operationalize them. Thus, this study contributes to the literature by confirming the significance of the factors studied in the context of the continuance intention use of e-learning services (Hung & Cho, 2008; Liao; Chuang; Yu; Lai & Hong 2011). It also explores attributes addressed in models of individual acceptance of technology and extends the DEDT model by Chiu et al.
(2005).
JISTEM, Brazil Vol. 12, No. 2, May/Aug., 2015 pp. 333-350 www.jistem.fea.usp.br
students and, therefore, their intention to continue to do a distance learning course. This is important considering that dropout students are reported to be the biggest obstacle faced by distance learning courses, resulting in ineffective spending. on them
The article is divided into five topics, including this introductory topic. The second topic is related to theoretical research. The third topic contains the methodological procedures, including the research model. In the topic analysis, it is displayed the measure model and structure model of research, as well as discussions of the results. The final topic contains conclusions, including limitations of the research and suggestions for future studies.
2. THEORETICAL BACKGROUND
2.1 Decomposed EDT model (DEDT)
Expectation disconfirmation theory (EDT) is a model of the consumer behavior that is widely accepted in research to explain and predict consumer’s satisfaction and repurchase intention (Chiu et al., 2005). The original theory of EDT, developed by Oliver (1980) proposes that repurchase intentions are primarily determined by the satisfaction (Hair; Sarstedt; Ringle & Mena, 2011). It is a model derived from studies on consumer behavior where customer satisfaction is co-determined by disconfirmation of expectation (Liao et al., 2011).
The model by Oliver (1980) assumes that the degree of consumer satisfaction stems from a five-step process, which consists firstly in the initial expectation before the purchase, later in the acceptance of using the product or service; after the second step, which determines a period of initial consumption, they form perceptions about the performance by the most important attributes (Chiu et al., 2005). In the third step, those perceptions are compared with initial expectations, and then consumers develop a feeling of satisfaction or dissatisfaction based on the level of disconfirmation. A satisfaction moderate level is maintained by confirmation and reinforced by positive disconfirmation, decreasing the disappointment of the negative disconfirmation (Oliver, 1980; Oliver, 2009). Finally, satisfied consumers have intentions to reuse the product or service in the future, whereas the dissatisfied consumers stop using them.
EDT is a theory that aims to explain and predict consumer behavior in relation to satisfaction with products and services (Oliver & Swan, 1989). Satisfaction is an individual feeling of pleasure or discontentment, resulting in the comparison between perceived performance and expectations in relation to services provided (Chiu et al., 2005). EDT has been demonstrating great applicability in the context of individual acceptance of technology (Premkumar & Bhattacherjee, 2008). In the environent of e-learning services, the EDT model has been demonstrating efficiency to evaluate systems on the Internet and therefore in VLEs (Hung & Cho, 2008; Lin, 2011; Paechter et al.,
2010).
JISTEM, Brazil Vol. 12, No. 2, May/Aug., 2015 pp. 333-350 www.jistem.fea.usp.br Economides, 2013).
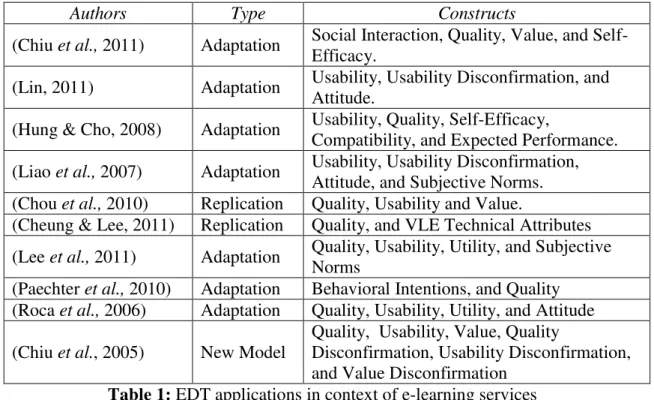
In the model proposed by Chiu et al. (2005), disconfirmation has the greatest influence on immediate satisfaction. The model was entitled Model Decomposition EDT (DEDT). Disconfirmation is the degree in which superior performance is the same or falls short of expectations of individuals, resulting in positive, null and negative, disconfirmation respectively (Oliver & Swan, 1989). It is in that way that models based on EDT are validated empirically, focusing the constructs that are not confirmatory on the expectation and confirmatory constructs on the moment of the use or experimentation (Liao, Chen & Yen, 2007; Liao et al., 2011). The predictive capacity has been confirmed in a series of studies that address the determinants of the satisfaction and intention to continue to usee-learning (See Table 1).
Terzis, Morides and Economides (2013) argue that several variables explain efficiently the intention of continuity of use in the context of e-learning. Besides quality, usability and value, measured with confirmatory and not confirmatory constructs (Chiu
et al., 2005), are also essential services in e-learning information quality, usefulness, subjective norms, self-efficacy, and others (Chou et al., 2010; Hung & Cho, 2008; Lee
et al., 2011; Liao et al., 2007). These constructs are applied in the context of the e-learning from adaptations of theoretical models of customer satisfaction and individual acceptance of technology, such as EDT.
Authors Type Constructs
(Chiu et al., 2011) Adaptation Social Interaction, Quality, Value, and Self-Efficacy.
(Lin, 2011) Adaptation Usability, Usability Disconfirmation, and Attitude.
(Hung & Cho, 2008) Adaptation Usability, Quality, Self-Efficacy,
Compatibility, and Expected Performance.
(Liao et al., 2007) Adaptation Usability, Usability Disconfirmation, Attitude, and Subjective Norms. (Chou et al., 2010) Replication Quality, Usability and Value.
(Cheung & Lee, 2011) Replication Quality, and VLE Technical Attributes
(Lee et al., 2011) Adaptation Quality, Usability, Utility, and Subjective Norms
(Paechter et al., 2010) Adaptation Behavioral Intentions, and Quality (Roca et al., 2006) Adaptation Quality, Usability, Utility, and Attitude
(Chiu et al., 2005) New Model
Quality, Usability, Value, Quality
Disconfirmation, Usability Disconfirmation, and Value Disconfirmation
Table 1: EDT applications in context of e-learning services Source: Pereira et al. (2015).
JISTEM, Brazil Vol. 12, No. 2, May/Aug., 2015 pp. 333-350 www.jistem.fea.usp.br
used, it may involve familiarity with technology and attitudes towards the use of computer systems (Roca et al., 2006).
The quality construct in the e-learning context refers to response time, relevance, accuracy and completeness of the information generated by VLE. This means that is important to have a VLE that meets the quality requirements that the user expects to get (Cheung & Lee, 2011; Paechter et al., 2010). The construct denotes the importance of VLE quality, being this one the main system to measure user satisfaction (Cheung & Lee, 2011; Kim; Trimi; Park & Rhee 2012). The quality concept applied to e-learning derives from models of customer satisfaction, as Service Quality (SERVQUAL) (Parasuraman, Zeithaml & Berry, 1988) as models of individual acceptance of technology, as the successful model in IS of the Delone and McLean (2003).
The value is an abstract concept that refers to the mode of conduct, personal preference or position toward the technology offered (Pereira et al., 2015). In the e-learning context, the value refers to the expected benefits by users in the scope of the expectations and in the value creation in the scope of the perceived performance (Chiu
et al., 2005; Chiu et al., 2011).In the TAM model, the value is operationalized as usefulness, characterized by an individual feeling of the user into believing that the use of an IS will improve their performance (Davis, 1989; Ifinedo, 2006). Researchers suggest that high levels of value lead to high user satisfaction (Bojanic, 1996; Chou et al., 2010).
3 RESEARCH MODEL AND HYPOTHESES
Based on previous literature review, including studies that address theoretical constructs in e-learning environments based on web systems, this paper addresses the following variables of EDT: usability, quality and value, evaluated under two perceptions (expectation and perceived performance), as defined by Oliver (1980).
JISTEM, Brazil Vol. 12, No. 2, May/Aug., 2015 pp. 333-350 www.jistem.fea.usp.br
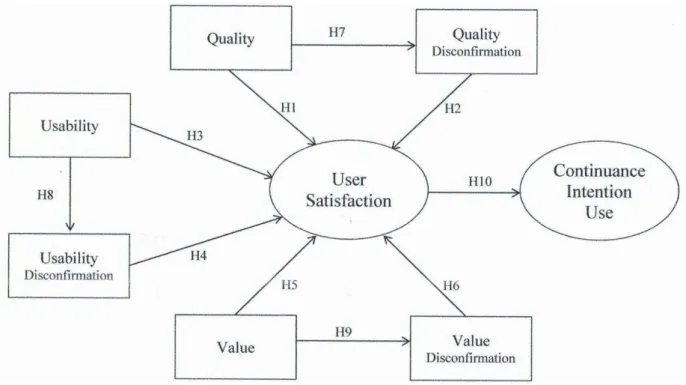
Figure 1 –Research model
Source: Adapted from Chiu et al. (2005)
The items that measure quality, were adapted from Parasuraman et al. (1988) and DeLone and McLean (2003). Usability and value were adapted from Davis (1989). The relationships between expectations and perceived performance were adapted from Oliver (1980). The items related to the satisfaction and continuance intention were adapted from Oliver (1980) and Chiu et al. (2005). In this paper, the relations established in the research model (See figure 1) can be confirmed in studies such as Chiu (2005), Chou et al. (2010), Chin (2005), Lin (2011), Roca (2006) and Cho (2008).
This research model includes disconfirmation and confirmation of the quality, usability and value as direct predictors of satisfaction. In this study, as well as in Chiu et al. (2011) the hypotheses are formulated focused on positive disconfirmation (performance is better than expectation). The model includes satisfaction and intention to continue use as dependent variables. The following hypotheses are proposed:
H1: Quality is positively associated with satisfaction
H2: Quality Disconfirmation is positively associated with satisfaction H3: Usability is positively associated with satisfaction
H4: Usability Disconfirmation is positively associated with satisfaction H5: Value is positively associated with satisfaction
JISTEM, Brazil Vol. 12, No. 2, May/Aug., 2015 pp. 333-350 www.jistem.fea.usp.br
3.1 Data collection
This study was conducted with 405 students in a distance learning undergraduate course of public administration, of UFRN-Brazil. The course uses Moodle as its VLE, configured as a blended learning and as asynchronous teaching form. Blended learning involves the use of several learning methods that help to accelerate the learning process (Enap, 2008). Asynchronous e-learning is a self-study that may be supplemented by non-real time interaction (Chiu et al., 2005). The questionnaire went through a pre-test with five researchers in information systems that have already experienced services of e-learning. In addition, a pilot study was conducted involving 30 students who accomplished a similar course using Moodle as a VLE
.
The data have been collected from a specific sample of students of an undergraduate distance course. However, this study can be replicated in a professional or academic context, where there is a full distance course, either undergraduate or post -graduate, who uses Moodle or similar VLE. This happens because the object of research focuses on aspects concerning the use of VLE for any student to do a distance learning course.
The online survey-type questionnaire consists in 42 closed questions arranged in a metric scale of 10 points, being 1 – little agreement and 10 – high agreement. There are three profile questions totaling 45 subjects. The questionnaire was hosted at Google Drive, an online tool. The questionnaires were sent to the respondents via e-mail. It was established a period of four weeks to maximize feedback, besides guaranteeing anonymity in the evaluations accomplished by the respondents. The data collection was held in 2013 when these students were in the last year of undergradute course
Among the 405 students who participated in the survey, 197 answered the questionnaire entirely, the alternatives unbiasedly and right in time, avoiding the incidence of missing values, obtaining return rate close to 50% of total questionnaires distributed. In the aim of calculating the required minimum sample size, we used the software G * Power 3.1.5, obtaining 146 observations as required sample. The value of 197 exceeds the minimum sample to a statistical power of 0.95 and effect size of the independent variables of 0.15, which is the configuration recommended by Faul , Erdfelder, Lang and Buchner (2007) and Prajapati, Dunne and Armstrong (2010).
Considering the demographic profile of the respondents, 61.4% were male (n=121) and 38.6% are female (n=76). In terms of age, 27.4% are aged between 18 and 25 years old. However, the majority of the respondents are aged between 26 and 35 years (33%, n=65). In relation to marital status, there was a balance between married and single respondents, with a slight predominance of married respondents (51,8%, n=102 and 40,6%, n=80 respectively).
Also regarding to the profile, we sought to identify differences between means of profile variables with dependent variables. In a multivariate analysis of variance (MANOVA), operationalized as recommended by Hair, Anderson, Taha and Black (2009), no significant differences were found for evaluation by stratum.
JISTEM, Brazil Vol. 12, No. 2, May/Aug., 2015 pp. 333-350 www.jistem.fea.usp.br
confirmatory factor analysis (CFA), creating the measure model. In the second step, the causal relationships are added and the structural model is generated. This study used Smart PLS 2.0.3 to verify the measure and structure model. This analysis strategy is used in studies that address the context of e-learning (Chou et al., 2010; Chiu et al.,
2011; Liao et al., 2011).
Hair et al. (2011) argue that the quality of studies employing PLS-SEM must follow the recommendations expressed, for the value of the method in research and practice to be maintained and disseminated to other researchers. Among the recommendations, guidance on data distribution is included, as well as the basic features that should contain the model, the method of settings for the software, parameters for evaluating the results, adjusting and testing of hypotheses.
The PLS is a successful method for analyzing customer satisfaction (Henseler; Ringle & Sinkovics, 2009). The choice of PLS as an SEM method is preferred in this study because it is a complex reflective model with 42 manifest variables. It is also justified by focusing on the development of predictive causal relationships and work with a model of latent construction (Ringle; Sarstedt & Straub, 2012; Nobre, 2006).
4. FINDINGS
4.1 Measure model
The tested model was submitted to CFA to compose the measurement model, initiating the first step of SEM. The model fit was obtained through tests of factorial validity (convergent and discriminant) as suggested by Mulaik et al. (1989), Kline (2005), Hair et al. (2009) and Maroco (2010).
In a first moment it was verified the existence of outliers by Malahanobis square distance (D²), with no significant observations to be excluded, adopting a conservative strategy of excluding outliers (Maroco, 2010). This procedure meets one of the assumptions required by SEM: the inexistence of outliers.
Once the adjustments are made, the other assumptions which determine the correct use of SEM were evaluated. The assumption of multivariate normality was not confirmed. However, the adoption of a least squares estimation method does not require the normality assumption for parameter estimation (Hwang, Malhotra, Kim, Tomiuk & Hong, 2010). The assumptions of multiple indicators and linearity were confirmed previously. The first guarantees the measure of the constructs formation by at least three manifest variables, while the second confirms the linearity of the model, which was proved by analysis using Smart PLS software.
The software also confirmed the assumption of a nonzero sample covariance, with 0 being the endogenous variables in the examination of the measurement model. The assumption of strong measure was also met, as it requires the use of measurement scale of at least five points for evaluation of variables, generating discrete or continuous variables (Hair et al. 2009). Thus, the compliance of the requirements to use SEM makes the evaluation model robust against the violation of assumptions.
JISTEM, Brazil Vol. 12, No. 2, May/Aug., 2015 pp. 333-350 www.jistem.fea.usp.br
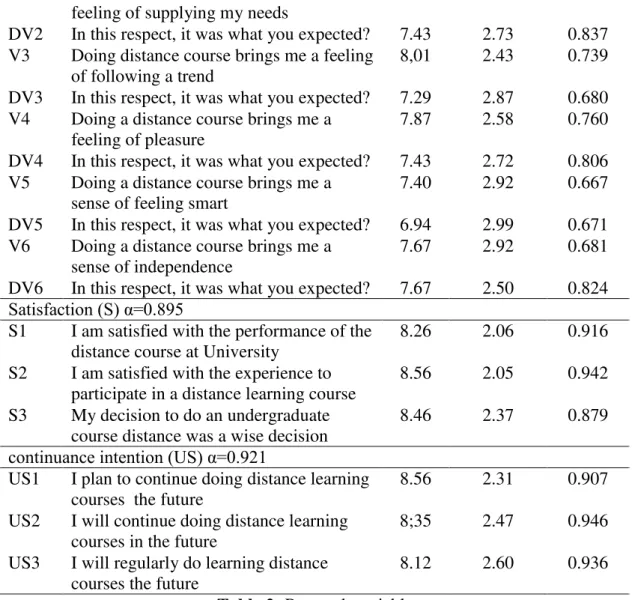
(2009) to ensure the adequate adhesion between variable and formed construct. The averages, deviations and factorial loads of the variables are presented in Table 2.
Code Variable Mean Std.
Deviation
Factor loading
Usability (U) α=0.804
Usability Disconfirmation (DU)α=0.776
U1 Learning to work with Moodle is easy for me
8.63 1.84 0.871
DU1 In this respect, was it what you expected? 6.34 2.92 0.363 U2 It is easy for me to become skillful in the
use of Moodle
8.52 1.85 0.823
DU2 In this respect, it was what you expected? 6.06 2.99 0.370 U3 Using Moodle I can improve my learning
in the disciplines
8.00 2.65 0.469
DU3 In this respect, it was what you expected? 7.29 2.91 0.745 U4 Using Moodle I can simplify my process
of learning in the disciplines
7.89 2.36 0.656
DU4 In this respect, it was what you expected? 7.20 2.71 0.820 U5 Study by Moodle fits well in the way I
learn
7,.59 2.32 0.773
DU5 In this respect, it was what you expected? 6.99 2.69 0.833 U6 The resources and activities (forums,
quizzes, etc.) of Moodle are compatible with the way I learn
7.59 2.31 0.793
DU6 In this respect, it was what you expected? 7.30 2.39 0.865 Quality (Q) α=0.883
Quality Disconfirmation (DQ) α=0.888
Q1 The layout and user interface of Moodle are friendly
7.78 2.11 0.769
DQ1 In this respect, it was what you expected? 7.16 2.49 0.823
Q2 It is easy to navigate through Moodle 8.28 2.18 0.781
DQ2 In this respect, it was what you expected? 7.34 2.57 0.774
Q3 The Moodle offers the services I need 7.58 2.24 0.831
DQ3 In this respect, it was what you expected? 6.98 2.56 0.769 Q4 I feel comfortable using the services
offered by the virtual platform
7.59 2.50 0.809
DQ4 In this respect, it was what you expected? 7.22 2.41 0.778
Q5 The Moodle offers complete information 7.11 2.48 0.821
DQ5 In this respect, it was what you expected? 6.90 2.46 0.846 Q6 Moodle provides information that is easy
to comprehend
7.75 2.17 0.837
DQ6 In this respect, it was what you expected? 7.29 2.35 0.813 Value (V) α=0.847
Value Disconfirmation (DV) α=0.864
V1 Doing a distance course brings me a sense of accomplishment
8.37 2.11 0.901
DV1 In this respect, it was what you expected? 7.50 2.81 0.896
JISTEM, Brazil Vol. 12, No. 2, May/Aug., 2015 pp. 333-350 www.jistem.fea.usp.br feeling of supplying my needs
DV2 In this respect, it was what you expected? 7.43 2.73 0.837 V3 Doing distance course brings me a feeling
of following a trend
8,01 2.43 0.739
DV3 In this respect, it was what you expected? 7.29 2.87 0.680 V4 Doing a distance course brings me a
feeling of pleasure
7.87 2.58 0.760
DV4 In this respect, it was what you expected? 7.43 2.72 0.806 V5 Doing a distance course brings me a
sense of feeling smart
7.40 2.92 0.667
DV5 In this respect, it was what you expected? 6.94 2.99 0.671 V6 Doing a distance course brings me a
sense of independence
7.67 2.92 0.681
DV6 In this respect, it was what you expected? 7.67 2.50 0.824 Satisfaction (S) α=0.895
S1 I am satisfied with the performance of the distance course at University
8.26 2.06 0.916
S2 I am satisfied with the experience to participate in a distance learning course
8.56 2.05 0.942
S3 My decision to do an undergraduate course distance was a wise decision
8.46 2.37 0.879
continuance intention (US) α=0.921
US1 I plan to continue doing distance learning courses the future
8.56 2.31 0.907
US2 I will continue doing distance learning courses in the future
8;35 2.47 0.946
US3 I will regularly do learning distance courses the future
8.12 2.60 0.936
Table 2: Research variables
In the analysis of the 42 manifest variables, all showed high averages. This affirms that the gravity center of distribution of the responses on the scale focuses on values which positively evaluate the measured indicators. The students’ expectations in relation to usability which involves the ease of use, skillful in the use of Moodle, process of learning, resources and activities of Moodle were overcome. This means that before starting the course, the student assessment as for these questions ranged 6-7 points in a metric scale. After they started the course, their expectations were overcome and these items were evaluated with a score of 7-8 points. The averages of the items of construct quality of the course also show that students’ expectations regarding the layout, user interface of Moodle, Moodle's services, Moodle's information and ease of navigation were overcome.
JISTEM, Brazil Vol. 12, No. 2, May/Aug., 2015 pp. 333-350 www.jistem.fea.usp.br
turn, the standard deviation does not show high dispersion (values above 3.0), which corroborates the results of the averages and other measures of central tendency, as defined by Corrar, Paulo and Dias (2007).
These constructs define the user performance and provides strategic potential in distance learning and improved levels of satisfaction (Biasutti, 2011). Chen affirms that the system of e-learning should focus on performance, providing better learning conditions. Following the analysis scheme of EDT, the high indexes of averages and factor loads show the importance of these characteristics for the success of e-learning services (Roca et al., 2006).
To ensure the factorial validity, were maintained in the measurement model only variables with loads above 0.5. There is also the calculation of the Cronbach's Alpha (α) which measures the reliability of the construct. According to Table 2, all constructs shows α over 0.7, which is the minimum defined by Hair et al. (2009) to ensure satisfactory reliability.
These findings demonstrate that respondents believe they have a good performance, and the items related to the construct value are the ones that were best evaluated. In the study by Chiu et al. (2005) the results were similar. It is perceived that the expectations placed on quality aspects, usability and value were attended. Thus, the disconfirmation is positive (Oliver, 2009), the performance exceeded the expectations according to the user evaluation.
According to Chen (2011), a good performance indicates good educational compatibility and a consequent increase of satisfaction in using the VLE. This behavior related to the analyzed constructs has been well evaluated in other studies, such as the ones by Cheung and Lee (2011) and Kim et al. (2012).
After the evaluation of the causal relationships, the usability disconfirmation and the quality disconfirmation - despite showing factorial validity and reliability - has showed causal pathways lower than expected , which demonstrate that the respondents, when evaluate the VLE, place their expectations in usability and quality, but are not decisive to determine satisfaction and subsequent continuance intention.
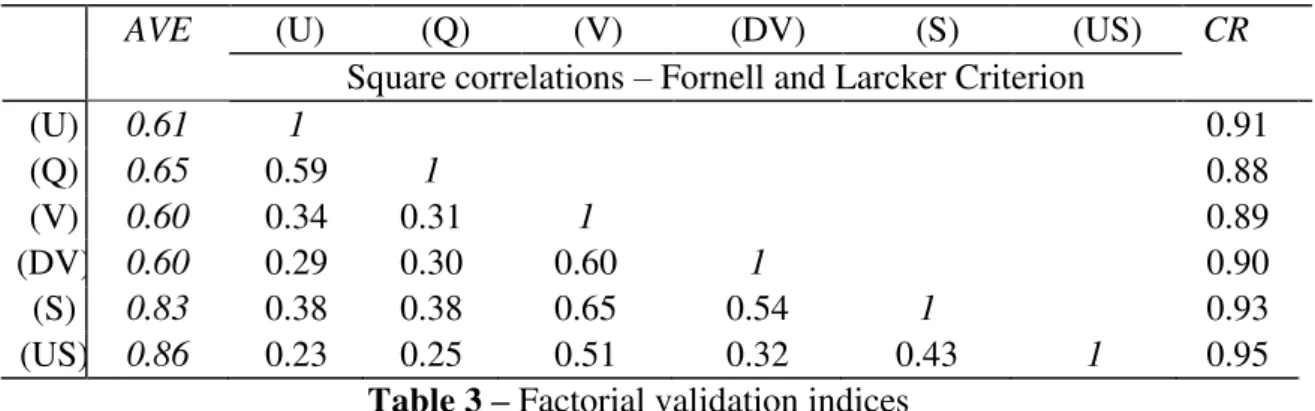
After verified the factorial validity, the second component evaluated was convergent validity, answered when the constructs present positive correlations among themselves and also by calculating the average variance extracted (AVE), proposed by Fornell and Larcker (1981). For the discriminant validity, the calculating of composite reliability (CR) is added. The results of the validation indices are shown in Table 3.
AVE (U) (Q) (V) (DV) (S) (US) CR
Square correlations – Fornell and Larcker Criterion
(U) 0.61 1 0.91
(Q) 0.65 0.59 1 0.88
(V) 0.60 0.34 0.31 1 0.89
(DV) 0.60 0.29 0.30 0.60 1 0.90
(S) 0.83 0.38 0.38 0.65 0.54 1 0.93
(US) 0.86 0.23 0.25 0.51 0.32 0.43 1 0.95
JISTEM, Brazil Vol. 12, No. 2, May/Aug., 2015 pp. 333-350 www.jistem.fea.usp.br
Note that both AVE and CR presented satisfactory results (AVE> 0.5, CR> 0.7), confirming the convergent validity. Based on these results, it was possible to compare the square of the latent correlations with the AVE. The AVE of the six evaluated constructs showed higher indexes than the square of the correlations, and this result is indicated by Maroco (2010) as appropriate, thus confirming the discriminant validity. It is therefore possible to tell that the instrument is reliable, consistent and reproducible, corroborating the reliability results generated by Cronbach's Alpha.
4.2 Structural model
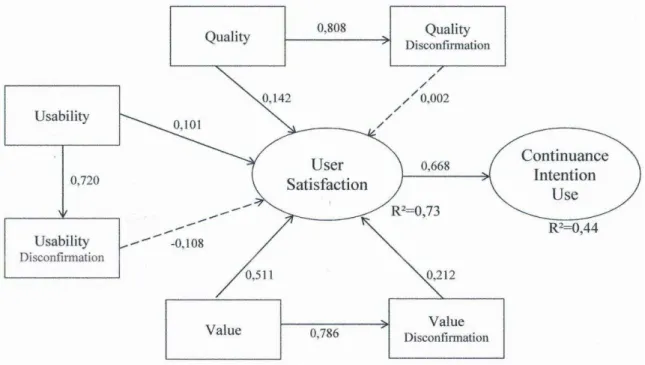
From the estimates of the measurement model, the causal relationships to trace the structural model are added, which is the second step in a two-step strategy SEM (Maroco, 2010). The structural coefficient significance was evaluated using a t-test by bootstrapping and 200 resampling, and by the estimation of the direct effects between the paths outlined in the model proposed by Smart PLS software. The structural model found by the study is presented in Figure 2.
Figure 2 –Continuance intention in e-learning service
Source: Research results (2015)
It is perceived that the level of satisfaction is high, being determined by three constructs of the perceived performance (quality, usability and value) and the non-confirmatory value. These results confirm the hypotheses H1, H3, H5 and H6. However, the low direct effects presented by the confirmatory quality and the non-confirmatory usability invalidate hypotheses H2 and H4. Based on the EDT model, it was confirmed the premise that when the perceived performance overcomes expectation, the satisfaction level tends to be high, characterizing the positive disconfirmation (Oliver, 1980; Hung & Cho, 2008).
JISTEM, Brazil Vol. 12, No. 2, May/Aug., 2015 pp. 333-350 www.jistem.fea.usp.br
literature (Chiu et al., 2005; Liao et al., 2011; Kim et al., 2012). This result confirms hypothesis H10. Value is the construct that provides more satisfaction among the four constructs with p value> 0.05. Furthermore, value is also the only non-confirmatory construct to be crucial for satisfaction.
It can be verified that the model has a high predictive ability that can be confirmed by the determination coefficient (R2). The constructs, quality, usability, value and disconfirmation of value explain together approximately 73 % of the students’ satisfaction (R2= 0.73). In turn, the rate of total variance explained of the model is 0.44. Maroco (2010) recommends that the determination coefficient is greater than or equal to 0.25 for the structural model explains a considerable percentage of the variance’s endogenous latent variables.
However, respondents did not place expectations on these constructs, only on value; the user needs to feel that they are doing an activity that they previously believe that is important. Therefore, managers of distance courses can develop strategies that show course benefits for students because it is based on the benefits that the value perceived is formed by students. Some strategies can be formulated, such as adaptation to new trends in mobility. The mobile-learning can assist the need of students' time.
The correlations between the respective confirmatory and non-confirmatory constructs proved high (0.808, 0.720, 0.786), demonstrating that the expectations placed by the respondents were near the lived experience during the course. Thus, hypotheses H7, H8 and H9 were confirmed. Oliver (1980) Chiu et al. (2011) and Paechter et al.
(2010) observe that the approach between expectation and performance is beneficial in e-learning services.
In this study, the non-confirmatory usability and non-confirmatory quality were rejected by the structural model. However, the results confirm the predictive ability of DEDT. Of the nonconfirmatory constructs, only the value was confirmed. Horeens (2012) explains that the construct evaluator of the expectation affects the identification and evaluation of behavior, causal reasoning and interpersonal communication. In the study of Chiu et al. (2005), expectations concerning usability were praised, revealing differences between the groups of respondents for each study, justifying the logic of replication the DEDT model under different analysis environments.
Henseler et al. (2009) discuss two types of validity to structural models with use of PLS: the nomological validity and external validity. The estimates of hypothesis tests take into account the direct effects of the construct determinants. Such relations present in the model are sufficientand meaningful to confirm the nomological validity. The external validity is confirmed by high variance rates in focal constructs (Henseler et al.,
2009; Ringle et al., 2012).
JISTEM, Brazil Vol. 12, No. 2, May/Aug., 2015 pp. 333-350 www.jistem.fea.usp.br
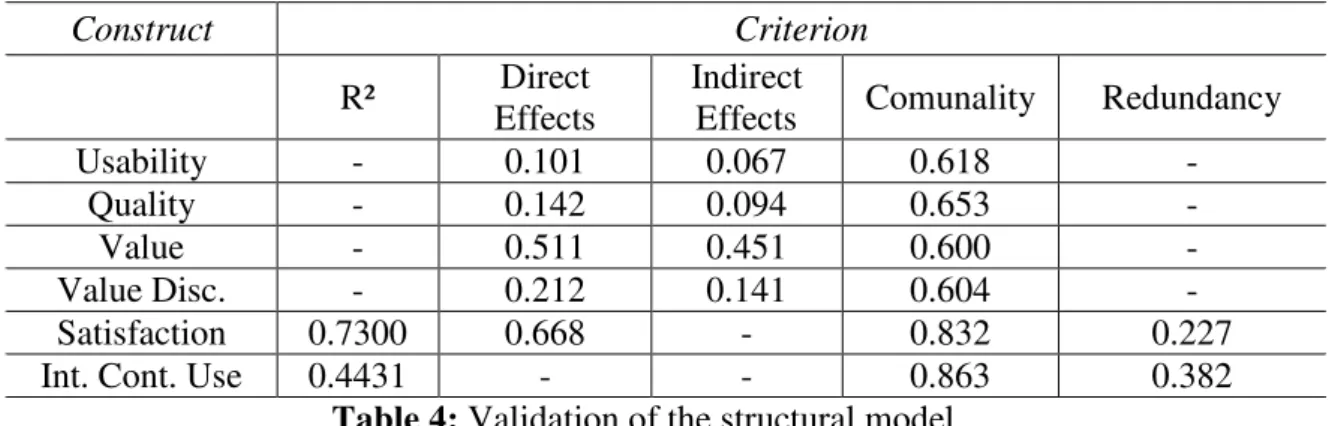
Construct Criterion
R² Direct
Effects
Indirect
Effects Comunality Redundancy
Usability - 0.101 0.067 0.618 -
Quality - 0.142 0.094 0.653 -
Value - 0.511 0.451 0.600 -
Value Disc. - 0.212 0.141 0.604 -
Satisfaction 0.7300 0.668 - 0.832 0.227
Int. Cont. Use 0.4431 - - 0.863 0.382
Table 4: Validation of the structural model
According to Table 4, commonality rates show values equal or above 0.6 and redundancy Q ² above 0 in the latent variables. Respectively these findings demonstrate good consistency and predictive capacity of the variances and the direct effects found by the study (Hair et al. 2009; Henseler et al. 2009). Henseler et al. (2009) also advise to interpret the indirect effects probably generated by the model. Indirect effects of the constructs were identified, which were determinants on the continuance intention, with predominance of value (0.451). This result suggests that this construct is not only the most relevant to determine satisfaction in the model found, but also to show the potential to estimate causal relation to the continuance intention.
5. CONCLUSIONS
The motivation of this study was to examine the effects of a theoretical model developed in the context of e-learning, indicating the determinants of satisfaction and continuance intention. The survey results showed that respondents positively evaluated the characteristics measured by the variables, showing low resistance in the use of Moodle, this being the VLE use in the distance learning course studied. The commitment to seek the quality of the course demands a high quality VLE, demonstrated by the evaluation of the users about the Moodle. Usability, regarding to the handling of the system, has also been well evaluated. However, respondents did not put expectations on these constructs, only on value; the user needs to feel that they are doing an activity that they previously believe that is important.
Results show that respondents are willing to do more courses, based on a positive relationship between satisfaction and performance. The results also show that performance exceeds expectations, being more decisive for satisfaction. Finally, we demonstrate a high degree compatibility of DEDT applied to users of distance courses.
Usability and quality are key constructs for satisfaction. Thus, managers should consider the student's learning process in the tool, the compatibility of resources and activities with the form of their learning, the interface of Moodle, and tool quality to increase student satisfaction with the course.
JISTEM, Brazil Vol. 12, No. 2, May/Aug., 2015 pp. 333-350 www.jistem.fea.usp.br
The survey presents a few limitations. First of all, the results can not be generalized because the results are directed to a specific context, so they have to be re-tested for each distinct organizational environment for ensuring reproducibility logic (Hair et al. 2009). However, this study can be replied or adapted with students of a specific course which can be administration or the other, in the undergraduate or postgraduation distance configuration with the VLE tool.
Increasing the complexity of the model is impracticable; hence, constructs used with the EDT model which are equally effective in determining satisfaction are not covered in the survey’s model, such as subjective norms, validated by Chen (2011) and Liao, Chen and Yen (2007), and the self-efficacy, validated by Chiu et al. (2011) and Hung and Cho (2008).
Future research must continue to explore the impacts of the satisfaction and continuance intention (Cheung & Lee, 2011). Chiu et al. (2005) recommend the use of longitudinal studies for obtaining results that allow us to rate acknowledgement over the time. Ultimately, Biasutti (2011) supports the need of more detailed studies, involving fewer groups, outpacing the minimalist view of the theoretical model.
References
Biasutti, M. (2011). The student experience of a collaborative e-learning university module. Computers & Education, 57, pp. 1865-1875.
Brei, V. A., & Liberali, G. N. (2006). O uso da técnica de modelagem de equações estruturais na área de marketing: um estudo comparativo entre publicações no Brasil e no exterior. Revista de Administração Contemporânea - RAC, 10(4), pp. 131-151.
Carvalho, N. (2009). Dimensões da qualidade em um ambiente virtual de aprendizagem. Tese de Doutorado, Faculdade de Economia, Administração e Contabilidade - USP, São Paulo.
Chen, J. L. (2011). The effects of education compatibility and technological expectancy on e-learning acceptance. Computers & Education, 57, pp. 1501-1511.
Cheung, C. M., & Lee, M. K. (2011). Antecedents and consequences of user satisfaction with an e-learning portal. International Journal of Digital Society, 2(1).
Chiu, C. M., Hsu, M. H., Sun, S. Y., Lin, T. C., & Sun, P. C. (2005). Usability, quality, value and e-learning continuance decisions. Computers & Education, 45, pp. 399-416.
Chiu, C. M., Wang, E. T., Shih, F. J., & Fan, Y. W. (2011). Understanding knowledge sharing in virtual communities: An integration of expectancy disconfirmation and justice theories. Online Information Review, 35(1), pp. 134-153.
Chou, S. W., Min, H. T., Chang, Y. C., & Lin, C. T. (2010). Understanding continuance intention of knowledge creation using extended expectation-confirmation theory: An empirical study of Taiwan and China online communities. Behaviour & Information Technology, 29(6), pp. 557-570.
JISTEM, Brazil Vol. 12, No. 2, May/Aug., 2015 pp. 333-350 www.jistem.fea.usp.br
Coursaris, C., Hassanein, K., Head, M., & Bontis, N. (2012). The impact of distractions on the usability and intention to use mobile devices for wireless data services.
Computers in Human Behavior, 28, pp. 1439-1449.
Davis, F. D. (Set. 1989). Perceived usefulness, perceived ease of use and user acceptance of information technology. MIS Quarterly.
DeLone, W., & McLean, E. R. (2003). The DeLone and McLean Model of information system success: A ten year update. Journal of Management Information, 19(4), pp. 9-30.
ENAP. (2008). Educação à distância em organizações públicas. Mesa Redonda de Pesquisa-Ação.
Faul, F., Erdfelder, E., Lang, A., & Buchner, A. (2007). G*Power 3: A flexible statistical power analysis program for the social, behavioral, and biomedical sciences.
Behavior Research Methods, 39(2), pp. 175-191.
Fornell, C., & Larcker, D. F. (1981). Evaluating SEM with unbserved variables and measurement error. Journal of Marketing Research, 18, pp. 39-50.
Hair, J., Anderson, R., Taham, R., & Black, W. (2009). Análise multivariada de dados
(6 ed.). Porto Alegre: Bookman.
Hair, J., Sarstedt, M., Ringle, C., & Mena, J. (2011). An assessment of the use of partial least squares structural equation modeling in marketing research. Journal of Academy of the Marketing Science, Methodological Paper.
Henseler, J., Ringle, C., & Sinkovics, R. (2009). The use of partial least squares path modeling in international marketing. Advances in International Marketing, 20, pp. 277-319.
Hoorens, V. (2012). Expectation. In: Elsevier, Encyclopedia of Human Behavior (2 ed., pp. 142-149). Elsevier Inc.
Hung, H., & Cho, V. (2008). Continued usage of e-learning communication tools: A study from the learners perspective in Hong Kong. International Journal of Training and Development.
Hwang, H., Malhotra, N. K., Kim, Y., Tomiuk, M. A., & Hong, S. (2010). A comparative study on parameter recovery of three approaches to structural equation modeling. Journal of Marketing Research, 47(4), 699-712.
Ifinedo, P. (2006). Acceptance and continuance intention of web-based learning technologies (WLT) use among university students in a Baltic country. The Eletronic Journal on Information Systems in Developing Countries, 23(6), pp. 1-20.
Kim, K., Trimi, S., Park, H., & Rhee, S. (Out. de 2012). The impact of CMS quality on the outcomes of e-learning systems in higher education: An empirical study. Decision Sciences Journal of Innovative Education, 4(4).
Kline, R. B. (2005). Principles and practice of structural equation modeling (2 ed.). New York: Guilford Press.
JISTEM, Brazil Vol. 12, No. 2, May/Aug., 2015 pp. 333-350 www.jistem.fea.usp.br
Liao, C., Chen, J. L., & Yen, D. C. (2007). Theory of planning behavior (TPB) and customer satisfaction in the continued use of e-service: An integrated model. Computers in Human Behavior, 23, pp. 2804-2822.
Liao, C., Chuang, C. L., Yu, P. L., Lai, T., & Hong, N. L. (2011). Applying the expectancy disconfirmation and regret theories to online consumer behavior.
Cyberpsychology, Behavior and Social Networking, 14(4), pp. 241-248.
Lin, K. M. (2011). E-learning continuance intention: Moderating effects of user e-learning experience. Computers & Education, 56, pp. 515-526.
Maroco, J. (2010). Análise de equações estruturais: Fundamentos teóricos, software e aplicações (1 ed.). Perô Pinheiro: Report Number.
Mulaik, S. A., James, L. R., Alstine, J. V., Bennett, N., Lind, S., & Stilwell, C. D. (1989). Evaluation of goodness of fit indices for structural equation models.
Psychological Bulletin, 105(3), pp. 430-445.
Nobre, S. (2006). O algoritmo PLS path model. Dissertação de Mestrado, Universidade Nova de Lisboa, Instituto Superior de Estatística e Gestão da Informação.
Oliver, J. (2009). Evaluating the expectations disconfirmation and expectations anchoring approaches to citizen satisfaction with local public services. Journal of Public Administration Research and Theory, 19(1), pp. 107-123.
Oliver, R. L. (1980). A cognitive model of the antecedents and consequences of satisfaction decisions. Journal of Marketing Research, 17(4), pp. 460-469.
Oliver, R. L., & Swan, J. E. (1989). Consumer perceptions of interpersonal equity and satisfaction in transactions: A field survey approach. Journal of Marketing, 53(2), pp. 21-35.
Paechter, M., Maier, B., & Macher, D. (2010). Students expectations of and experiences in e-learning: Their relation to learning achievements and course satisfaction.
Computers & Education, 54, pp. 222-229.
Parasuraman, A., Zeithalm, V., & Berry, L. L. (1988). Servqual: A multiple-item scale for measuring consumer perceptions of service quality. Journal of Retailing, 64(1), pp. 12-37.
Pereira, F. A. M., Ramos, A. S. M., Gouvêa, M. A., Costa, M. F. (2015). Satisfaction and continuance use intention of e-learning service in Brazilian public organizations.
Computers in Human Behavior, 46(5), pp. 139-148.
Prajapati, B., Dunne, M., & Armstrong, R. (2010). Sample size estimation and statistical power analysis. Ot Peer Reviewed.
Premkumar, G., & Bhattacherjee, A. (2008). Explaining information technology usage: A test of competing models. The International Journal of Management Science, 36(1), pp. 64-75.
Ringle, C., Sarstedt, M., & Straub, D. (2012). A critical look at the use of PLS_SEM in MIS Quarterly. MIS Quarterly, 36(1).
JISTEM, Brazil Vol. 12, No. 2, May/Aug., 2015 pp. 333-350 www.jistem.fea.usp.br
Terzis, V., Moridis, C., & Economides, A. (2013). Continuance acceptance of computer based assessment through the integration of user's expectations and perceptions.