i Doctorate Program in
Information Management
THREE-DIMENSIONAL ANATOMICAL ATLAS OF THE
HUMAN BODY
by
António Manuel Teixeira Barbeito
A thesis submitted in partial fulfillment of the requirements for the degree of Doctor in Information Management, Geographic Information Systems.
Supervisors: Marco Painho, Ph.D.
Pedro Cabral, Ph.D.
ii Doctorate Program in
Information Management
Committee:
Prof. Doutor Pedro Miguel Pereira Simões Coelho, President
Prof. Doutor Marco Octávio Trindade Painho, Supervisor
Prof. Doutor João Erse de Goyri O’Neill
Prof. Doutora Maribel Yasmina Campos Alves Santos
Prof. Doutor José Tadeu Marques Aranha
Prof. Doutor José Paulo Elvas Duarte de Almeida
iv
DEDICATION
v
ACKNOWLEDGMENTS
I would like to thank all those who contributed in a constructive way to the development and completion of this thesis.
My supervisors, Professor Marco Painho and Professor Pedro Cabral, for their guidance, support and patience throughout this process.
The directors of ESTGA, Professor Estima de Oliveira and Professor Gonçalo Paiva Dias, by providing me with favorable conditions for carrying out this research.
The colleagues who kindly had a word of encouragement. My parents and sisters for their endless love and concern.
Most of all, my girls, Ana, Rita and Magui, for the indefinable feeling that unites us and that gives meaning to everything else.
vi
RESUMO
Os atlas anatómicos permitem mapear as estruturas anatómicas do corpo humano. As primeiras versões consistiam em documentos analógicos com representações pictóricas do corpo humano associadas a texto descritivo. Com o aparecimento dos sistemas computorizados, surgiram versões digitais e os modelos tridimensionais foram introduzidos. Desta forma, estes sistemas tornaram-se mais eficientes, permitindo visualizações mais realistas e um grau de interatividade superior. O desenvolvimento de atlas anatómicos em ambientes de sistemas de informação geográfica (GIS) permite criar plataformas com um elevado grau de interatividade e com ferramentas que facilitam a exploração e análise do corpo humano.
Nesta tese, desenvolve-se um protótipo para representar o corpo humano. O sistema inclui um modelo topológico 3D GIS, uma interface gráfica e funções para explorar e analisar o interior e a superfície das estruturas anatómicas do corpo humano. A aproximação GIS baseia-se essencialmente nas caraterísticas topológicas do modelo e no tipo de funções criadas que incluem diversos tipos de medição, identificação, seleção e análise.
Com estas funções, o protótipo tem a capacidade de replicar a informação disponibilizada pelos atlas anatómicos tradicionais e acrescenta um nível superior de funcionalidade. Efetivamente, algumas das limitações encontradas nos atlas anatómicos correspondem precisamente a caraterísticas presentes nos GIS, nomeadamente, as capacidades interativas, a gestão de um sistema em que a informação está organizada em camadas, as ferramentas de medição, o modo de edição para expansão da informação contida no sistema e as operações de análise espacial.
PALAVRAS-CHAVE
vii
ABSTRACT
Anatomical atlases allow mapping the anatomical structures of the human body. Early versions of these systems consisted of analogic representations with informative text and labelled images of the human body. With the advent of computer systems, digital versions emerged and the third
dimension was introduced. Consequently, these systems increased their efficiency, allowing more realistic visualizations with improved interactivity. The development of anatomical atlases in
geographic information systems (GIS) environments allows the development of platforms with a high degree of interactivity and with tools to explore and analyze the human body.
In this thesis, a prototype for the human body representation is developed. The system includes a 3D GIS topological model, a graphical user interface and functions to explore and analyze the interior and the surface of the anatomical structures of the human body. The GIS approach relies essentially on the topological characteristics of the model and on the kind of available functions, which include measurement, identification, selection and analysis.
With the incorporation of these functions, the final system has the ability to replicate the kind of information provided by the conventional anatomical atlases and also provides a higher level of functionality, since some of the atlases limitations are precisely features offered by GIS, namely, interactive capabilities, multilayer management, measurement tools, edition mode, allowing the expansion of the information contained in the system, and spatial analyzes.
KEYWORDS
viii
INDEX
1.
Introduction ... 1
1.1.
Contextualization and Literature Review ... 1
1.1.1.
Geographic Information Systems ... 1
1.1.2.
Human Body Representation ... 15
1.1.3.
Human Body Representation in GIS ... 21
1.1.4.
Segmentation ... 29
1.1.5.
3D Reconstruction ... 31
1.2.
Objectives and Working Assumptions ... 33
1.3.
Thesis Organization ... 37
2.
Data and Methods ... 39
2.1.
Data ... 39
2.2.
Conceptual Model ... 40
2.3.
Human Body Segmentation ... 45
2.4.
Anatomical Structures Segmentation with RGB Images ... 47
2.5.
Anatomical Structures Segmentation with CT Images ... 51
2.6.
3D Reconstruction ... 52
2.7.
Validation of the 3D Reconstruction ... 53
2.8.
Central Axes ... 54
2.9.
Topology ... 55
2.10.
Coordinate Reference System ... 57
2.11.
Classification of Anatomical Structures and Multilayer Management ... 58
2.12.
Exploration of the Input Data and Geovisualization ... 59
2.13.
Vector-Raster Integration ... 60
2.14.
Identification and Editing ... 61
2.15.
Measurement Tools ... 62
2.16.
Spatial Analysis ... 63
3.
Results... 64
3.1.
Body Segmentation ... 64
3.2.
Segmentation of the Internal Structures with RGB Images ... 68
3.3.
Segmentation of the Internal Structures with CT Images ... 71
3.4.
Integration of RGB and CT Images... 72
3.5.
3D Reconstruction and Validation ... 74
ix
3.7.
Classification of Anatomical Structures and Multilayer Management ... 79
3.8.
Exploration of the Input Data and Geovisualization ... 80
3.9.
Vector-Raster Integration ... 84
3.10.
Identification and Editing ... 85
3.11.
Measurement Tools ... 88
3.12.
Spatial Analysis ... 92
4.
Discussion ... 96
4.1.
Segmentation Environment: Integration of RGB and CT Images ... 97
4.2.
Point Clouds and Reconstruction of Vector Components ... 98
4.3.
Integration of Raster and Vector Components ... 99
4.4.
Direct use of VHP data and Visualization of the model interior ... 100
4.5.
Topology Construction ... 100
4.6.
Integrating the Model in a GIS Prototype ... 101
4.7.
Prototype Functions ... 102
5.
Conclusions ... 105
5.1.
Model Limitations ... 106
5.2.
Future Research ... 107
x
LIST OF FIGURES
Figure 1.1
–
Modeling the real world with vector and raster models. ... 4
Figure 1.2
–
Quadtree data structure. ... 5
Figure 1.3
–
The use of 2.5D data to model the 3D reality. ... 7
Figure 1.4
–
Spatial analysis in 3D. ... 8
Figure 1.5
–
Vector data topology definition. ... 11
Figure 1.6
–
DE9IM model. ... 12
Figure 1.7 - Cut view of a 3D TEN mesh. ... 14
Figure 1.8 - The principle of GTP model based on unparallel drill holes. ... 15
Figure 1.9
–
Surface vector model linked to a database. ... 16
Figure 1.10
–
Volume model from the VHP data. ... 17
Figure 1.11 - De Humani Corporis Fabrica. ... 19
Figure 1.12 - Atlas of Human Anatomy. ... 20
Figure 1.13
–
Modern GIS analysis over Dr. Snows cholera map. ... 22
Figure 1.14
–
Segmentation and 3D reconstruction of a non-topological model. ... 24
Figure 1.15
–
3D brain model. ... 29
Figure 1.16
–
Anatomical structures segmentation. ... 30
Figure 1.17 - Poisson surface reconstruction from a point-cloud. ... 32
Figure 2.1 - Data from the VHP. ... 40
Figure 2.2 - Functions used in the volume model building. ... 43
Figure 2.3
–
Model components. ... 44
Figure 2.4 - Flow chart of the conceptual model. ... 45
Figure 2.5
–
Reconstruction of the VHP model. ... 46
Figure 2.6 - RGB image segmentation procedure. ... 51
Figure 2.7 - CT image segmentation procedure. ... 52
Figure 2.8 - Anatomical structures 3D reconstruction. ... 53
Figure 2.9 - Central axis building from surface models... 55
Figure 2.10 - Connectivity topology. Arc-node table and respective graph. ... 56
Figure 2.11 - Coordinate systems. ... 58
Figure 2.12 - Insertion parameters of a needle into the human body. ... 63
Figure 3.1 - Definition of
P0P1
path to study the RGB intensity profiles. ... 64
Figure 3.2 - RGB levels measured along
P0P1
. ... 65
Figure 3.3 - Segmentation of the body. ... 66
Figure 3.4 - Masks obtained through rule R > B, showing the existence of noise. ... 67
xi
Figure 3.6 - Segmentation of the body with an additional threshold to correct noise. ... 68
Figure 3.7 - Evaluating the similarity between the cryosection anatomical images. ... 69
Figure 3.8 - Segmentation of anatomical structures. ... 70
Figure 3.9 - Visualization of the segmented structures with the LM. ... 71
Figure 3.10 - Segmentation on CT image with noise. ... 72
Figure 3.11
–
Conversion between coordinate systems. ... 73
Figure 3.12 - . Integration of CT and cryosection images. ... 74
Figure 3.13 -
Surface reconstruction with α
-shapes. ... 75
Figure 3.14 - 3D body surface reconstruction with the screened Poisson algorithm. ... 76
Figure 3.15 - The effect of smoothing border points and reducing the number of triangles. 77
Figure 3.16 - Reconstruction of the vector surface component of the left femur. ... 78
Figure 3.17 - Defining the central axes of the anatomical structures: interactive interface. .. 79
Figure 3.18 - Hierarchical classification systems implemented in the TOC. ... 80
Figure 3.19 - Input data direct exploration and identification function. ... 81
Figure 3.20 - Visualization of internal structures by defining a cutting plane. ... 81
Figure 3.21 - 3D Visualization of anatomical structures. ... 82
Figure 3.22 - Application of a cutting plane from the interactive insertion of a needle. ... 83
Figure 3.23 - Geovisualization modes available in the prototype. ... 84
Figure 3.24. Vector-raster visual integration after defining a cutting plane. ... 85
Figure 3.25 - Identification function. ... 87
Figure 3.26 - Editing function and detail identification. ... 88
Figure 3.27 - Measurements of anatomical structures. ... 91
Figure 3.28 - Measurement of length between two points on a set of arteries. ... 92
Figure 3.29
–
Spatial inclusion analysis. ... 93
Figure 3.30
–
Global spatial neighborhood analysis. ... 94
xii
LIST OF TABLES
Table 2.1 - Operations used in the segmentation procedure. ... 47
Table 2.2 - Automatic and manual features of the segmentation method. ... 49
Table 3.1 - Absolute differences per pixel between two images (percentage averages). ... 69
Table 3.2 - Root Mean Squared Error value assessment measured between the vector surface
and the boundary of the respective raster component. ... 76
Table 3.3 - BMI classification. ... 89
Table 3.4 - Determination of the left leg muscles that are neighbors of a predetermined
structure. ... 94
Table 3.5 - Spatial neighborhood analysis. Determination of the left leg muscles that are
xiii
LIST OF ABBREVIATIONS AND ACRONYMS
2D Two-dimensional
3D Three-dimensional 4IM 4 intersection model 9IM 9 intersection model BMI Body mass index
BVH Biovision hierarchical data file CAD Computer aided design
CGIS Canada Geographic Information System
CT Computed tomography
FDS Formal Structure Data Model GI Geographic information
GIS Geographic information system GISc Geographic information science GPS Global positioning system GTP Generalized tri-prism model GUI Graphical user interface
ID Identifier
LM Layer matrix
LOD Level of Detail
MRI Magnetic resonance imaging NLM National Library of Medicine OGC Open Geospatial Consortium RGB Red, Green, Blue colors RMSE Root mean squared error ROI Region of interest
xiv SI Spatial information
SPECT Single-photon emission computed tomography SQL Structured Query Language
TEN Tetrahedral network model TIN Triangulated irregular network TOC Table of contents
1
1.
INTRODUCTION
This thesis focuses on the study, conceptualization and implementation of a geographic information system (GIS) prototype, named with the acronym 3DBodyGIS, with the aim of developing a 3D anatomical atlas of the human body. The motivation to develop an atlas in this type of platform was based on two fundamental aspects: (i) both GIS and 3D anatomical atlases deal with alphanumeric information aggregated to spatial information (SI); and (ii) the tools provided by GIS, in particular the ones regarding spatial analysis, could add value to the degree of functionality of the atlases.
Given the aim of the thesis, the work to be performed involves the study of 3D GIS models and current anatomical 3D atlases. After consultation of the scientific literature in each of these areas, there was an attempt to understand to what extent there would be studies proposing methodologies involving the approach of GIS to anatomical atlas or, at least, to some form of representation of the human body. The existence of this type of work would create a direct link to the object of this study. However, in contrast to the volume of existing research exclusively on 3D GIS or 3D anatomical atlas, the use of a GIS approach in the development of representations of the human body does not go much beyond its recognition of interest.
The first section of this chapter presents the GIS context and the actual representations of the human body, in particular, the anatomical atlases. After this overview, the section proceeds bringing these two areas together. Data used in this study are obtained from medical imaging. Its use in the reconstruction of 3D models requires image segmentation, which is, then, an essential topic included in this thesis. The literature review presented in this chapter covers the following topics: 3D GIS models, representations of the human body, anatomical atlases, GIS approach to anatomical atlases, segmentation of anatomical structures and 3D reconstruction methods. Throughout the text, the literature review provides clues to the conceptualization of the system to be developed.
The second section presents the objectives and working assumptions. The chapter ends with the description of the thesis structure.
1.1.
CONTEXTUALIZATION AND LITERATURE REVIEW
1.1.1.
Geographic Information Systems
2 implementation, or emerge from an understanding of its potential capabilities”. More recently, Painho & Curvelo (2012) defined GISc as an experimental research field that has geographic space as its object of study, geographic information as its means of representing knowledge and geographic information systems as its disciplinary tool. According to these authors, this definition points to the manner in which GISc relies on the way it reconciles the technological, cognitive and conceptual aspects of geographic information, generates new contexts for the (re)formulation of geographical problems and (re)creates environments that stimulate and challenge spatial reasoning and spatial knowledge. These contexts and environments depend on the way in which theory, concepts, data, technology, methods, individuals and society interact and go through the continuum GISc – GISystems. Although this is a recent area of knowledge, the same cannot be said about the manipulation of GI by humans.
Geographic Information and Spatial Information
Statements such as "80% of all information contains some geospatial reference" come up regularly in the context of GI in order to highlight the importance of this kind of information. In ESRI (2012) a similar statement is dedicated to the information integrated in the corporate databases: "Approximately 80% of an organization's data has a location component". Hahmann & Burghardt (2013) start from the statement that "80% of all information is geospatially referenced" and develop a methodology to certify its veracity. At the conclusion of this work the authors state that "57% of the information within the German Wikipedia is geospatially referenced", considering that the value, despite being below the estimate of geo-community, remains as a strong evidence of the importance of GI.
References to GI and SI are often made with the same sense. Heywood et al. (2011), for example, states that GIS uses geographic data, and concludes that these systems can add value to spatial data. Jones (2014) states that the GI refers to phenomena with a spatial reference. However, when exemplifying this type of information, this author mentions exclusively entities on the Earth's surface, such as cities, streets, and administrative areas. The concept of GI associated to a coordinate or a set of spatial coordinates is common in the literature. Subsequently, the space referred by these coordinates can be identified as a neighborhood near the Earth's surface, including this one (Longley et al. 2005).
3 to the Earth's surface. GI appears, then, as a kind of SI circumscribed to the space in which runs the current human activity.
GI has been expressed by human beings through cartography. According to Harley & Woodward (2001) "it is in Upper Paleolithic societies that one might expect to find the earliest evidence of maps". Casaca et al. (2005) refer that the need and the corresponding capability to create maps are phenomena of ancient and universal character. The tradition of mapping the Earth's surface and entities related to it has remained until today, having evolved with the techniques and technologies that have emerged. Casaca et al. (2005) identified two stages in the cartographic representation process: (i) the stage of geodesy, in which the Earth's surface points are projected on a reference surface of double curvature, generally ellipsoidal; (ii) the phase of mathematical cartography, which makes the projection of the reference surface on surfaces of simple curvature, such as the cone, cylinder or plane. Regarding the map concept, Thurston et al. (2003), state that "the map is a representation of reality, in color or black and white, and 2D, 3D, or 4D. The map might represent the backyard, neighborhood, city, country, or the world, or might constitute the pattern of microbes or blood vessels within the human body", which indicates that mapping is not limited to GI, and may use SI in general.
From 2D GIS to 3D GIS
The emergence and evolution of GIS can be defined through several stages. According to Coppock & Rhind (1991), “These overlap in time and occur at different moments in different parts of the world. The first, or pioneering age, extended from the early 1960s to about 1975; in this, individual personalities were of critical importance in determining what was achieved. The second phase, approximately from 1973 until the early 1980s, saw a regularization of experiment and practice within and fostered by national agencies; local experiment and action continued untrammeled and duplication of effort was common. The third phase, running from about 1982 until the late 1980s, was that of commercial dominance. The fourth (and current) phase is one of user dominance, facilitated by competition among vendors, embryonic standardization on open systems and increasing agreement on the user’s perception of what a GIS should do and look like.”
4 The literature is profuse in defining GIS as evidenced by the list of definitions in Maguire et al. (1991). GIS definitions range from those that specify in detail the components or the functionality of systems (Burrough 1986; Burrough et al. 2015), considering GIS as a set of powerful tools to collect, store, retrieve, process and display SI of the real world with a view to a particular set of purposes, and those who hold few key elements (Bonham-Carter 2014), featuring GIS as computerized systems designed to manipulate GI.
The World Health Organization (WHO) after defining GIS as "computer systems for capturing, storing, checking, integrating, manipulating, analyzing and displaying data related to positions on the Earth's surface" concludes on the definition, mentioning a fundamental aspect of these systems, the link between databases and GI (by referencing maps): "It is thus the way of linking databases with maps, to display information, perform spatial analyzes or develop and apply spatial models" (World Health Organization 2015).
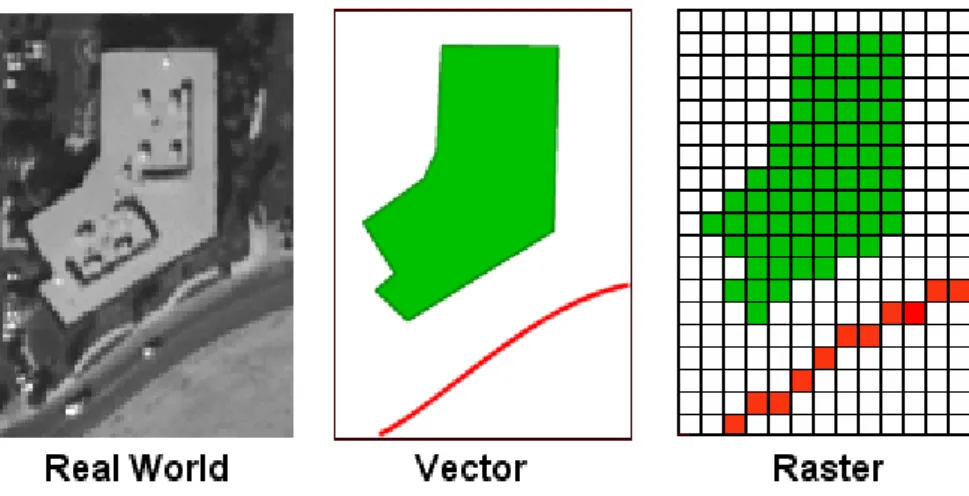
A key aspect in GIS is how to model the represented reality. GIS models can be classified as either vector or matrix. According to de By (2004) among the matrix models, the ones which are composed by square cells - in 2D version - are by far the most used, being called raster or raster maps. The vector and raster models have clearly distinct characteristics making them complementary regarding the application scope (Figure 1.1).
5 de By (2004), refers to the concepts of field, a geographic phenomenon for which, for every point in the study area, a value can be determined, and object, a phenomenon that occurs discreetly and with well-defined borders. Using these concepts, we can say, generally, that the raster models are suitable for the representation of the field concept, and vector models are suitable to the representation of the object concept. However in many situations both models can represent both concepts.
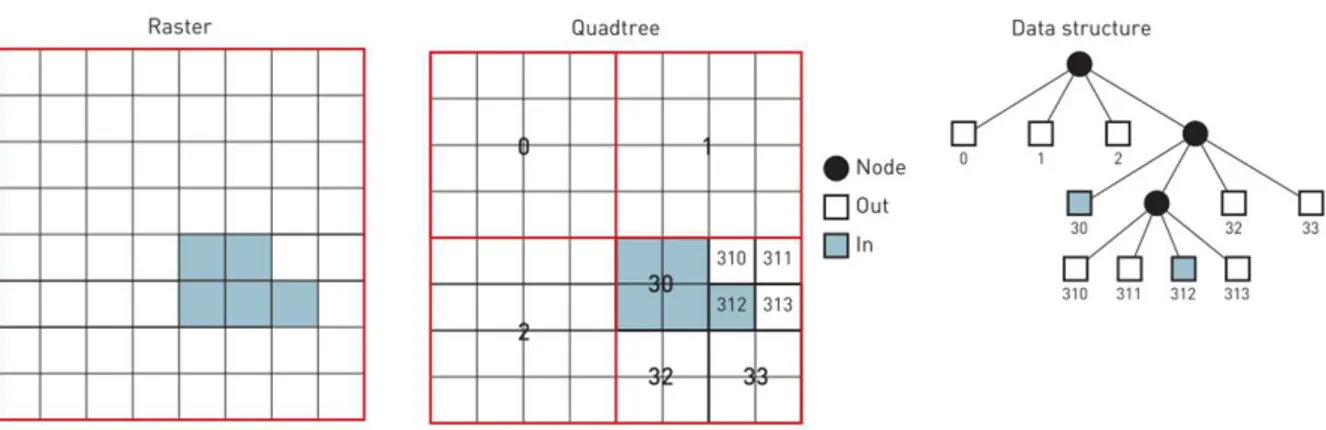
Davis (2001), when characterizing the two models, presents a set of advantages associated with each of them: the raster systems have a simple structure, are easy to use and allow to perform, in a simple way, some analysis operations. The vector models provide a more familiar form of map representation, allow describing the information with high precision in which the display does not degrade with zooming, generate lower amounts of data than raster models since the information is encoded in nodes or vertices that have representation and can be topological. Regarding the analytical capabilities of the two models, Heywood et al. (2011) point out that “Traditionally, vector spatial data models have been considered more appropriate for answering topological questions about containment, adjacency and connectivity. However, with the advent of more intelligent raster data structures such as the quadtree that contains information about the relationships between cells, this distinction is closing” (Figure 1.2).
Figure 1.2 – Quadtree data structure. Source: Heywood et al. (2011).
6 to create systems that enable an increasingly efficient and more accurate representation of reality providing, simultaneously, analysis tools.
According to the literature, 2D GIS have been described as widely tested and efficient systems (LI 1994). In 2D GIS data models is common to define three different classes to accommodate the various geometric entities: points, lines and areas. Stored by themselves, these entities originate a data model called spaghetti (Peuquet 1984). The establishment of spatial relationships between the several represented geometric entities leads to a topological data model. In these models, the points are the most elementary entities, being materialized through nodes. de By (2004) defines the following representations for GI:
Points are given by a coordinate pair (x, y) in 2D, or by a 3-tuple (x, y, z) in 3D;
The lines consist of a list of nodes: the two extreme nodes and none or a finite number of internal nodes (also called vertices);
The areas use a frontier model, i.e., each area is represented by an arc/node structure that materializes a polygon as boundary.
The need to update the 2D systems with the introduction of the third dimension and the 3D GI demand have been growing (Gröger & Plümer 2012). This phenomenon stems from the inability of 2D systems to solve key issues involving the nature of 3D entities. The difficulties of 2D systems to model 3D objects occur not only at the representation level but, especially, in terms of performing analysis operations (Abdul-Rahman & Pilouk 2008). To reinforce the importance of the 3D systems, these authors present an extensive list of areas in which 3D spatial models have been studied and used: geology, hydrology, civil engineering, and environmental engineering. However, the transition from 2D to 3D entails a substantial increase in the volume of data involved, the complexity of reality to represent and, hence, the structures of the models, the algorithms that implement the GIS methods and the topological relationships among 3D objects. This is why 3D GIS have become a topic of research with the development of several studies about the conceptualization and implementation of models within specific applications (Abdul-Rahman & Pilouk 2008).
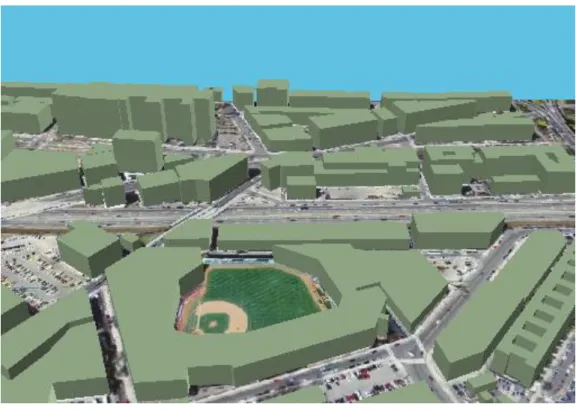
7 respective altitude in the table of attributes. Thus, although 2.5D systems perform efficiently certain 3D viewing of objects in 3D environments (Zlatanova et al. 2002), their capacity is limited when it is necessary to represent more complex objects (Figure 1.3). Therefore, the dissatisfaction with the 2D models extends to 2.5D models when it comes to model 3D objects (Wu 2004).
Figure 1.3 – The use of 2.5D data to model the 3D reality.
Source: http://www.gsd.harvard.edu/gis/manual/landmarks/ [Accessed June 9, 2015]
The 3D representations have distinguishing characteristics from 2D representations with regard to the data types and represented entities: a first aspect to consider is the need to store 3D coordinates, that is, the nodes become associated with coordinates (x, y, z). One second important aspect relates to the introduction of a new class of objects: the body class (Frank et al. 1986). A similar class to the area of the 2D models is the surface class: while the areas in 2D models are two-dimensional elements in the plan, in the 3D model the surfaces exist in the three dimensional space, being made up of faces bounded by edges and may have more complex shapes. Also the linear entities of 3D models may have more complex shapes than those occurring on the plane in the 2D models.
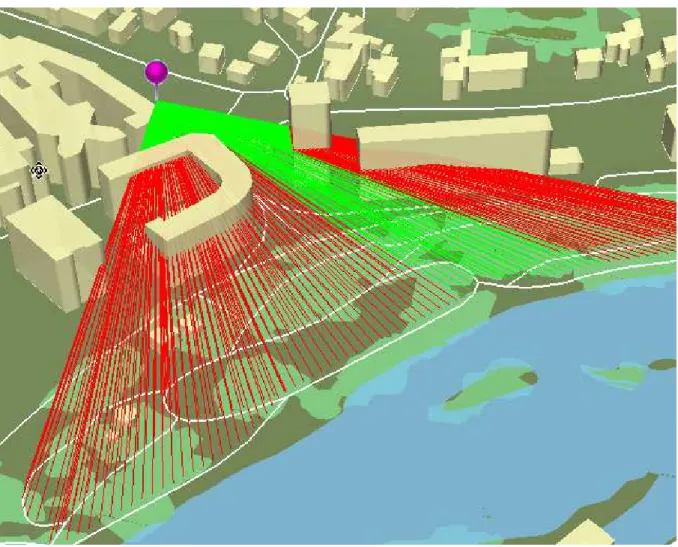
8 from the greater complexity associated with the use of the third dimension and the fact that the existing algorithms in the traditional GIS have been developed for 2D systems. Thus, research continues in this area, with some of these papers referenced herein (Figure 1.4).
Figure 1.4 – Spatial analysis in 3D.
Source: http://www.arcorama.fr/2010/06/les-grands-themes-darcgis-10-28.html [Accessed June 9, 2015]
9 In the current language of the GISc, the "geographic" adjective is replaced by "spatial" when the analyzes are related with positions are mentioned. Indeed it is unusual to speak about geographical analysis, being the term “spatial analysis” unanimously used. This issue is not just casual because, in reality, it has a very concrete meaning: although GIS operate almost exclusively in a given space, their analysis tools are comprehensive and can be used in other spaces. The measurement of a length along a spatial object, for example, may be carried out both on a street or on a blood vessel: although the two situations are totally different, the same measurement function can be used in both cases.
GIS Functionalities
The knowledge of the typical functionality of the GIS is important in order to take advantage in the exploration of spatial models. de By (2004) distinguishes the following groups of analytical functions in a GIS: (i) Measurement, spatial query and classification; (ii) Overlay; (iii) Neighborhood; (iv) Network and (v) 3D analysis.
In the 3D space, the measurements may include distances between two entities or along an entity, areas and volumes. The approaches to take measurements differ in the case of vector and raster data. The measurements of raster areas and volumes, for example, involve cell counting, which are then scaled by the value of each cell. The vector measurements use mathematical formulae and results may be stored in attribute tables, which prevents recalculation whenever requested.
10 Overlay operations consist in combining layers of information through map algebra operations, carried out on overlapping areas. The overlay functions can be implemented with vector or raster data, although the latter is preferred due to their particular suitability for overlaying operations.
The neighborhood functions enable to assess the characteristics of an area around a given entity. They involve proximity calculations (buffer zones and Thiessen polygons), spread computation or least-cost paths analysis (de By 2004).
The network functions are based on the analysis performed on networks (arcs connected together). This type of analysis is more common on vector data. Network analysis involves determining optimal paths, finding closest facilities and determination of service areas.
The 3D functions are an extension of the 2D GIS functions with application on 3D models. In this regard, 3D GIS should replicate the same degree of functionality of the 2D GIS. Although 3D functions may be directed to solving the same problems, the addition of the third dimension requires the construction of new algorithms to handle the new possibilities that arise from the greater complexity associated with the 3D space populated by 3D, 2D and 1D objects.
Topology
11 Figure 1.5 – Vector data topology definition.
Source: http://library.oceanteacher.org/OTMediawiki/index.php/Vector_Data_Topology [Accessed June 9, 2015]
With regard to the topological relationships, the greater number of classes and the dimensional expansion of 3D models compared to 2D models lead to the existence of new relationships between the entities, which causes a greater complexity of the topological model.
The study of topological relationships between model objects can be based on the 4-intersection model (4IM) or on the 9-intersection model (9IM). Currently, this study relies more often on 9IM model (Egenhofer & Herring 1990; Egenhofer & Franzosa 1991; Egenhofer et al. 1993). Following the 9IM model, many other models have been introduced for the same purpose, although the 9IM model continues to be a reference, having been adopted by the Open Geospatial Consortium (OGC). The 4IM and 9IM models build binary matrices of intersections between two objects (the result of each intersection can return the empty or non-empty values).
12 possible, so the actual total number of relationships between the two objects is inferior. For objects with co-dimension = 0 (n-dimensional objects in ℝ𝑛) both models produce the same results. However, for all the other combinations, with co-dimension> 0 (at least one of the objects has a dimension smaller than the space), the 9IM model allows to distinguish relationships that the 4IM model assumes to be the same (Egenhofer et al. 1993). For two regions in ℝ2, both models generate eight possible relationships: disjoint, contains, inside, equal, meet, covers, covered by, overlap. The same 8 relationships are found between two lines in ℝ. However, the number of possible relationships between two lines in ℝ2, detected by the 9IM model, rises to 25, with more 21 relationships in the case of lines with branches.
The change to 3D adds the body object, which allows to create more pairs of intersections: body-body and body with each of the other objects. In addition, the region-region relationships become co-dimension> 0 which allows the 9IM model to produce more possible results than in the ℝ2 space. The increasing complexity of the topological relationships and resulting difficulties are well patent in Xu & Zlatanova (2013), which state that in 2D models there has been a significant and continuous improvement of the 9IM model implementation, while the development of relationships in the 3D models have been slow. The “Dimensionally Extended 9-Intersection Model” (DE9IM) provides the dimension of the intersections between two spatial objects. Figure 1.6 shows the resulting DE9IM matrix for a particular intersection between a line and a polygon.
Figure 1.6 – DE9IM model.
(A) Linestring intersecting a polygon. (B) DE9IM model for the intersection.
13 Surface, Volume and Hybrid Models
The 3D models that have been shown may be classified as geographical, geological or integrated (Wang et al. 2007), or analogously, surface, volume or hybrid models (Schön et al. 2009). Liu et al. (2009) still use the surface data models and solid data models nomenclature. Surface models are often used in the representation of urban areas, with particular emphasis on buildings modeling (Lee & Zlatanova 2008). The volume models are usually employed in the representation of geological structures present in the underground (Wang & Huang 2012). The integrated representation of surface and objects with underground has led to the development of integrated models (Tegtmeier et al. 2014). Given the complexity of reality in 3D, the research in this area has not been directed to develop a global model for 3D. Instead, new models have emerged specifically tailored to the realities they aim to represent. For these reason, there are not satisfactory global 3D models in the known databases (Butwilowski & Breunig 2010).
14 Figure 1.7 - Cut view of a 3D TEN mesh.
Source: http://doc.cgal.org/latest/Mesh_3/ [Accessed June 9, 2015]
This is essentially an extension of the TIN model used in 2D, in which the triangles, 2-simplex, change to tetrahedra, 3-Simplex. Thus, each 3D object is represented by a network of adjacent tetrahedra. TEN is a volume model introduced with the explicit aim to overcome some of the difficulties of 3D FDS model (Wang et al. 2006). The topological relationships in this model are given by adjacency between the spatial objects that constitute it. According to Abdul-Rahman & Pilouk (2008), the TEN model is of remarkable importance since it has been identified as the most appropriate for representations of 3D objects. As the raster model, the TEN model generates data volumes greater than the 3D FDS model. Zlatanova (2006) refers to the limitation of this model in the representation of structures built by man, or in the implementation of surface models since the interior, necessarily filled by tetrahedra, should be omitted in terms of visualization. Currently, 3D GIS models are implemented to represent environments in which there are human constructions and natural objects such as the Earth's surface and the geological structures beneath it.
15 operationalize emergency plans in urban environments, focusing the interior of buildings. In this model the topological relations are based on network connectivity. Koussa & Koehl (2009) present another 3D topological model designed to represent urban objects, with the ability to dynamically adjust the Level of Detail (LOD) according to the zoom level.
Figure 1.8 - The principle of GTP model based on unparallel drill holes. Source: Wang (2006).
Yin & Shiode (2014) present a 3D spatial-temporal GIS model of an urban environment. This is a surface model conceived to represent buildings that records data from different times. The graphical user interface (GUI) provides analysis functions and has a time bar that enables the study of the urban landscape at different times. Wang et al. (2014) and Wang et al. (2015) emphasize the importance of 3D models for which are developed methodologies for visualizing and performing spatial analysis in view of the exploration of resources by integrating geological, geophysical and geochemical data. These models consist of 3D matrices with cells of different sizes for various modeled geological entities. The great diversity of application-based models is reflected in these and other research studies. Such models support the assertion that, contrary to what happens in 2D, it is harder to find a 3D model with global characteristics suitable for the various representations.
1.1.2.
Human Body Representation
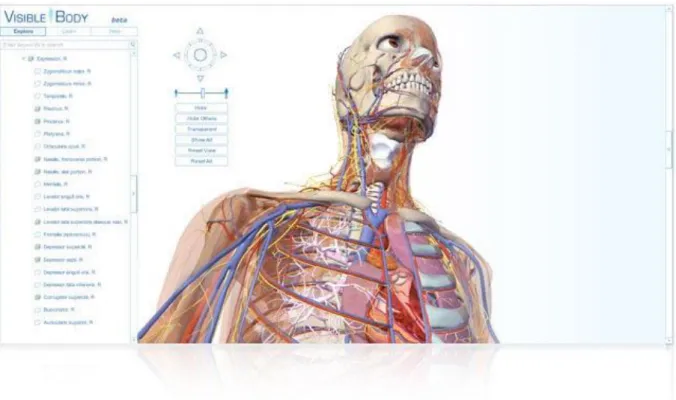
16 with the geometric components. The information is preferably structured in layers and the use of tools that manipulate the visual parameters allow to get realistic high quality views. These models can be used to develop Atlases dedicated to surface anatomy, however, the representations of the interior of the anatomical structures are not available (CG Studio 2014) (Figure 1.9).
Figure 1.9 – Surface vector model linked to a database.
Source: http://maintenance.visiblebody.com/ [Accessed June 9, 2015]
Unlike the vector surface models, volume models allow to adequately represent the anatomical structures of the interior. The possibility of developing such models is linked to the availability of information about the interior of the human body. Similarly to images of geographical space obtained from satellite RS, medical imaging currently provides large volumes of information about the human body allowing to rebuild volume models contradicting the initial preponderance of surface vector models. However, the large amount of data and the difficulties involved in the visualization of volume models continues to pose challenges to the development of systems using these models.
17 with the Visible Human Project (VHP) (Spitzer et al. 1996). The VHP was conducted by the US National Library of Medicine (NLM) and consisted in obtaining sectional images of the human body. The planning of this project began in 1989. In 1994 the data set for the male model became available and, in the following year, the female model was completed. In addition to the CT and MRI images, 1871 cryosection Red-Green-Blue (RGB) images were collected. These images allow visualizing the interior of the anatomical structures in true color. Two other similar projects followed: the Visible Korean Human (VKH) (Park et al. 2006) and the Virtual Chinese Human (VCH) (Zhang et al. 2006).
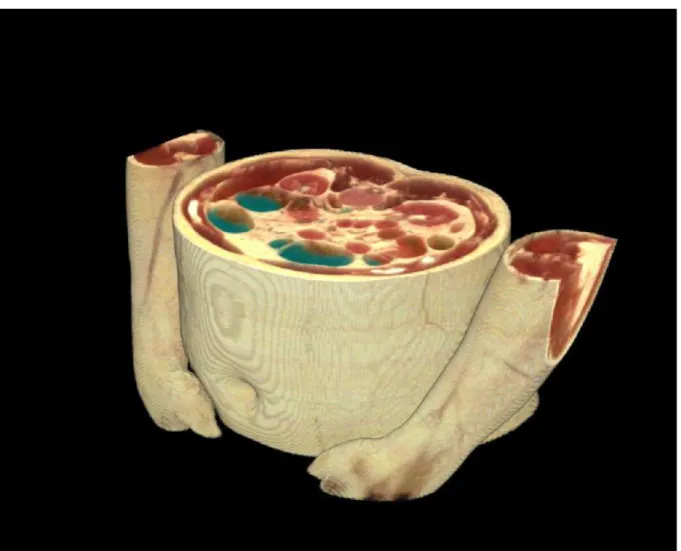
These images have been used in many projects that aim at a realistic representation of the human body through the RGB images 3D reconstruction (Figure 1.10) (U.S. National Library of Medicine 2001).
Figure 1.10 – Volume model from the VHP data.
18 any of these systems have been referred in the literature as 3D atlas of the human body such as the system presented by (Kang et al. 2000), a 3D digital muscle-skeletal anatomical atlas. It is an atlas that targets muscles, tendons and bones. It presents interactive capabilities such as navigation, selection, removal of structures, defining degrees of transparency, identification and description of structures. According to these authors, the 3D model view is helpful in understanding the human anatomy. Additionally, they claim that the reconstruction of 3D anatomical models leads to a virtual environment that can support surgical planning, virtual surgery, endoscopy and virtual simulations for training purposes. The Visible Human Projects data are also associated with the development of commercial applications, in particular, the VH Dissector (Spitzer et al. 2004; TolTech 2014) and the Voxel-Man-Man 3D Navigator (Höhne et al. 2000; Höhne & MAN 2009).
The project Digitalized Virtual Chinese Human began in 2001. This project was based on the collection of 8556 sections of the female human body, separated by 0.2 mm. The treatment of data - image registration, background image removal and segmentation - led to a female model called VCH-F1. Yuan et al. (2008) describe the reconstruction phase of the 3D model and the developed applications: VCH Clinics, virtual acupuncture and image guided surgery.
The VCH Clinics is a software that operates on the VCH-F1 model with educational goals. This software contains three modules: 3D anatomical atlas, virtual endoscopy and motion simulation. In the anatomical atlas module one can navigate and interact with the model, set different degrees of transparency and access related extra information including images, movies and introductory texts. Besides the models and systems developed from VHP data, there are research works that rely exclusively on CT and MRI images from other sources to reconstruct 3D human models (Suri et al. 2002; Dogdas et al. 2005; Jamshidi et al. 2014).
The more elaborated projects, which use sectional images of the human body, develop methodologies aimed at the quality of visualization and its association with alphanumeric information. They can manipulate raster data, produce vector components through segmentation and allow querying. However, the associated models do not sufficiently explore the underlying capabilities of GIS models such as topology and spatial analysis.
Anatomical Atlases
19 anatomical text based on direct observation of the human body. In this document, the author introduces the concept of human body atlas, with various graphical representations, of map type, of the human body anatomical structures (Figure 1.11). According to Daintith (2008), although some traditional errors persist, “The work of Vesalius was of considerable significance in marking the departure from ancient concepts. The Fabrica presented in a single, detailed, comprehensive, and accessible work (superbly illustrated, probably at the Titian school in Venice), a basis for following generations of anatomists to compare with their own dissections. It has been said that after Vesalius medicine became a science”.
Figure 1.11 - De Humani Corporis Fabrica.
Source:
http://www.metmuseum.org/collection/the-collection-online/search/358129?=&imgno=8&tabname=object-information [Accessed June 9, 2015]
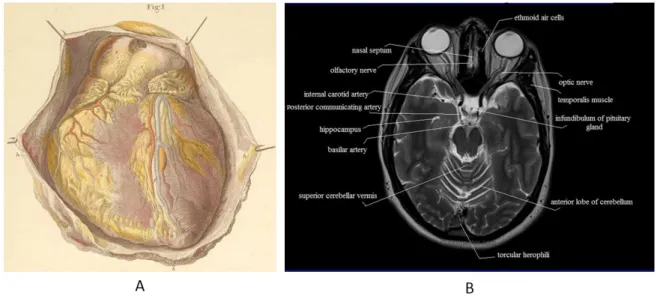
20 reviewing the anatomical atlas of Frank Netter, mentioned its illustrative quality even though there were similar documents, enriched with the addition of information from photography, MRI and CT, exemplifying with the atlases Sobotta et al. (1997) and Abrahams et al. (1998). Using such data would contribute, according to the author, for a better understanding of anatomy, in a clinical perspective, by providing images of greater realism than static illustrations.
Figure 1.12 - Atlas of Human Anatomy.
(A) The intact heart seen from the anterior surface lying in the opened pericardium. Source: http://www.anatomyatlases.org/ [Accessed June 9, 2015]
(B) MRI brain cross sectional anatomy.
Source: https://mrimaster.com/anatomy/ [Accessed June 9, 2015]
21 Currently, the initial tendency to provide 3D digital atlases in optical media has been replaced by providing the same systems through the web (Argosy Publications 2008; Database Center for Life Science 2009; Anatronica 2010; Zygote Body Media 2011; Biodigital Human 2013; Primal Pictures 2014).
1.1.3.
Human Body Representation in GIS
According to Bonham-Carter (2014), GIS have as purpose the organization, visualization, spatial query, combination, analysis and prediction, having been provided with tools that allow to perform such functions. In this set of assignments nothing prevents that the information that feeds GIS refers to a broader space than the Earth's surface. Indeed, according to Longley et al. (2005), many of the methods used in GIS are also applicable to other non-geographic spaces, including the surfaces of the cosmos, and the spaces of human body that are captured by medical images. Thus, despite the current 3D systems are developed within specific projects, generally related to the geographic space, its features are a repository of information that can be used in building other systems in other spaces. The availability of GIS to model the space of the human body is a fundamental aspect of this thesis. Generally, this type of modeling requires 3D GIS developments involving joint representation of the concepts object and field, the development of topological relationships and the creation of functionalities on the 3D models.
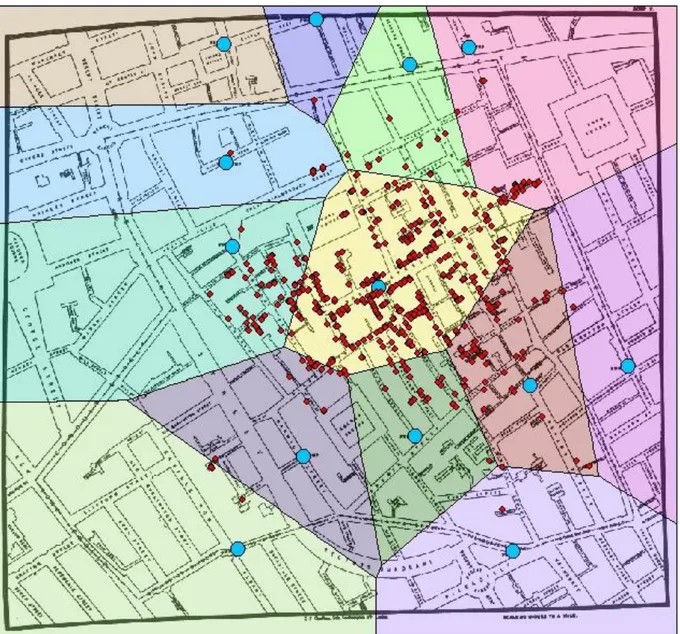
22 cholera outbreak in 1866 that his theory was finally accepted”. In Mackenzie (2013), datasets are made available regarding Dr. Snow’s map, which can be used to perform a GIS analysis in accordance with the proposed methods and analysis tools such as, for example, the Thiessen polygons.
Figure 1.13 – Modern GIS analysis over Dr. Snows cholera map. Defining zones of cells (Theissen polygons) closest to each water pump.
Source: https://www.udel.edu/johnmack/frec682/cholera/cholera2.html [Accessed June 9, 2015]
23 main focus on spatial analysis / health geographics were excluded. The methods of analysis used in the scientific literature were identified as follows: calculations of distances (proximity calculation), estimation of summary measures across pre-specified geographic areas (aggregation methods), assessment of various forms of clustering, spatial smoothing and interpolation methods, and spatial regression.
van Wilgenburg & SPINlab (2013) reported that GIS capabilities facilitate the search for spatial relationships between the physical and social environment and epidemiological factors. These authors highlight data visualization as a positive aspect and mention the costs involving the use of technology, stating that the GIS can be a useful tool in this area.
A large number of maps on various diseases are mentioned by Meade & Emch (2010) which states that “In the GIS era, disease maps often display the results of sophisticated spatial analytical operations performed in a GIS”.
The above examples are just a few from the extensive scientific literature that exists on studies linking health areas to GISc. The various international journals whose focus is specifically on the health-geography link is also an indicator of the importance of this association.
Although the approach of GIS to health areas is evident in the context described above, the situation is somewhat different when it moves to the SI regarding the human body. Still, it is not usual to use GIS to make representations of the human body, there have been proposals to develop GIS applications to operate with this type of SI (Suwardhi & Setan 2006; Garb et al. 2007). There are references to the use of GIS as a privileged tool to represent the human body, without this link being effectively implemented. Examples of such approaches are given by Ungar & M’Kirera (2003) which propose the use of GIS techniques to model and study a specific problem of the oral cavity of primates; Rana et al. (2005) presented a model to represent the soft tissues aiming a GIS application for medical purposes; Smith et al. (2005) present the Foundational Model of Anatomy (FMA), a map of the human body which includes a model for relationships between the represented objects whose implementation may occur in a GIS environment. Vongkornvoravej et al. (2006) build a database that receives data from a 3D model based on voxels. Španěl et al. (2007) developed vector segmentation algorithms on the raster component related to the interior of the human body to build 3D vector objects modeling organic structures. This procedure demonstrates also the need of operating with different data models.
24 2006) (Figure 1.14). The implementation of Beylot et al. (1996) is a dynamic model on which was developed explicit topology regarding the links between the anatomical structures that have relative motion. It is a model oriented to dynamic aspects whose topology fits that goal not reproducing the typical forms of topology in GIS.
Figure 1.14 – Segmentation and 3D reconstruction of a non-topological model. Source: Španěl et al. (2007).
25 because, on one hand, it is a method identified for collecting data for 3D GIS and, on the other, it uses the same kind of data that are generated by medical imaging techniques.
From the 3D GIS features studied and the system to be developed, whose characteristics must comprise the functionality offered by 3D anatomical atlas and GIS analysis capabilities, the first clues to carry out the GIS-Atlas integration can be found in 3D GIS models that involve both surface and volume representations. This is the case, for example, of the combined representations of objects over the ground (represented by vector surface models) and the geological underground structures (represented by volume models).
Taking as a starting point the integrated models that perform this type of representation as, for example, the model of Wang et al. (2007), the extrapolation to the human body is possible: the surface component would represent the surface, in this case not only the human body but also the various anatomical structures represented, while the volume of component, the GTP structure would be replaced by a geometrical structure more suitable for the representation of the interior of the anatomical structures, since the GTP component is specifically designed to adapt to the geometry of the geological structures.
For GIS-Atlas integration to be advantageous, the conceptualization of an integrated model should take into account the following factors:
Represent the outer surfaces of anatomical structures; Represent the inside of anatomical structures;
Explicitly define the model's topology; Develop functionality;
Respect the nature of the input data.
26 original data, that is, despite the recognized capability of GIS in data conversion between different formats, this type of operation on internal information of the anatomical structures leads to degradation of detail in relation to the original data. This means that, when having a specific format for the input data, it should be part of the model structure without resampling.
According to Goodchild (1992), GIS are sometimes accused of being technology driven, a technology in search of applications. This issue has arisen repeatedly and can be addressed in this work. In this case, it is necessary to verify if the system to be developed is an asset within the anatomical atlases. In this perspective, we will go back to the topic of analytic functions of GIS to determine to what extent they can be used advantageously on a 3D spatial model of the human body.
The measuring tools are usual in GIS. The availability of a 3D spatial model of the human body in a GIS environment could benefit from tools to take measurements of distances, areas and volumes. The distance measurements include simple Cartesian distance between two points and the distance between two points along an element. This second option allows to determine the extent of anatomical structures between two given points. Despite these distance measuring tools are simple to implement, the measurement of distances along an anatomical structure requires a linear, not physical, component that simulates the central axis of this structure. If, moreover, the structure is branched, as in the case of blood vessels, a topological network structure should be built. In this case, the determination of the distance between two points along an anatomical structure consists in solving a problem of network analysis, i.e., the determination of an optimal path between two points. The layers of information are a concept usually implemented in GIS. If the 3D model of the human body has the geometric components structured in independent layers of information, it is possible to differentiate them and to develop tools to measure areas and volumes. In reality, the surface areas and volumes, being characteristics of these structures, can be determined in the model reconstruction phase and included in the model structure itself.
The interactive queries can be made on the geometric component or on attribute tables. In the first case, structures interacting directly with them are selected and, in the second, records in the table may be selected by identifying, for example, the name of the selected structures. In all cases, the selections are made simultaneously on the geometric component and in the attribute table.
27 properties to implement the selections: unlike attribute queries that select through a built condition on an alphanumeric value, or a logical combination of attributes, the location-based queries run through spatial criteria, for example, selecting all the objects found within a given distance of the heart. The classification methods may be used to communicate specific aspects of the data. In the case of a human body GIS, a possible reclassification can be done on a sectional CT, MRI or RGB image, in order to identify all the anatomical structures present, for example, by a color code which will be captioned with the names of the corresponding structures. This type of operation allows to simulate the information contained in a sectional anatomical atlas of the human body (Dixon et al. 2015). Unlike atlases that use a fixed number of images, GIS enables to make this kind of dynamic classification on all images available on the model and on images with other orientations set by the user, obtained by 3D interpolation.
Following the previous example, overlay operations could be used with segmented images defining, interactively, variable degrees of transparency. Thus, it is possible to identify the structures directly on the data. In certain types of applications, databases containing considered healthy structures can be used and overlaid with other images for automatic detection of anomalies.
The neighborhood and network topologies can support some analyzes, for example, in the case of proximity analysis and measurement of lengths along a structure, which have been described.
The example of a 3D spatial analysis problem, which extends the functionality of 2D GIS is the inclusion analysis. In 2D, the point-in-polygon algorithms are used to determine whether a point is inside a polygon. In the 3D space, these become point-in-polyhedron algorithms. This type of analysis can be used, for example, to determine the anatomical structures crossed by a needle inserted at a point of the body with a certain orientation and depth.
GIS, besides providing models of the human body, include tools that allow a detailed and interactive exploration. The fact that they integrate a large number of analysis functions in the same platform constitutes, by itself, an additional advantage compared to the traditional approach of the anatomical atlases.
28 relevant papers, according to search engine criteria, published in the last five years. Thus, the top twenty links generated in the set of the two surveys were recorded. Of these, only four were clearly related to the development of a human body model by representing anatomical structures. For the first data set, the links found in the study were: An Integrated Model of the Human Body (Barbeito et al. 2014) and Medical information service system based on human 3D anatomical model (Kim & Chung 2013).
For the second set of keys the following results were found: An Integrated Model of the Human Body (Barbeito et al. 2014), Human body modeling in geographic information systems (Barbeito et al. 2011) and Development of anatomical and radiological digital brain maps (Juanes et al. 2012). The first work, which comes in both surveys, corresponds to an article published in the context of the present thesis. The second work of the first search is an information system about anatomical structures, including a 3D model of the human body. This system does not have GIS analysis functions type nor is developed according to this perspective. The second work of the second search is a preliminary study that presents a surface vector model with an analytic point-in-polyhedron function included and was developed by the 3 first authors of the first paper found in the 2 surveys.
29 Figure 1.15 – 3D brain model.
Source: Juanes et al. (2012).
1.1.4.
Segmentation
The statement that there are no universal GIS 3d models stems from the link between these models and the applications in which they are used. However, the features of the models are also related to the data from which they are constructed. The integrated model developed by Wang et al. (2006) exemplifies this situation: the GTP structure was built to fit the geometric characteristics of the geological structures under the surface.
30 Since the appearance of the Visible Human projects - VHP, VCH and VKH- different approaches have been used in the segmentation of anatomical structures on axial images (Figure 1.16). Leaving aside purely manual operations, the segmentation methods can be classified as semi-automatic or automatic. As semi-automatic methods (Imelińska et al. 2000; Beveridge et al. 2013) require the intervention of an operator, the high volume and complexity of data justify the research works that propose automatic segmentation methods (Li et al. 2014; Xue et al. 2014). However, errors are inherent to segmentation procedures. For example, the algorithm presented by Xue et al. (2014), leads to an overall accuracy of 98.8% CT imaging and 99% for cryosection images. According to Wu et al. (2012), after the primary segmentation, the main errors that are produced include the segmentation error and the segmentation missing. Intra-observer variation between experts is also referred. Thus the complexity and the inevitability of errors in segmentation procedures are clear. Several studies show that automatic procedures cannot be considered when the segmentation needs a high level of detail and non-ambiguity (Schiemann et al. 1997; Beylot et al. 1996; Riemer et al. 2007).
Figure 1.16 – Anatomical structures segmentation.
31 The existence of errors, even if they are small, shows that the supervision and human intervention are not negligible. In many cases, the tolerance to segmentation errors can be related to the further use of the obtained results. For example, if the results are used to reconstruct 3D models, a small percentage of wrong pixels outside the segmented structure can lead to a highly deformed anatomical structure. In this particular case, it is absolutely necessary to eliminate such errors. Thus, the necessity to optimize the segmentation methods by minimizing the execution times and controlling the final quality, explains the use of semi-automatic methods. The semi-automatic methods found in literature use the automatic components to facilitate and accelerate the segmentation procedure and the manual intervention to define parameters, correct errors and perform quality control (Schiemann et al. 1997; Takanashi et al. 2002; Imelińska et al. 2000; Beveridge et al. 2013).
Another approach to improve the segmentation quality involves the use of several types of data such as, cryosection images, CT, and MRI: although the segmentation of human body structures with RGB images has been subject of research in several works (Schiemann et al. 1997; Pommert et al. 2001; Flores & Schmitt 2005; Liu et al. 2014), associated with the VHP data, other methods use combinations of different image types, such as cryosection RGB, CT and MRI, included in these projects (Imielinska et al. 2000; Xue et al. 2014). In fact, the joint use of different types of images for segmentation allows to take advantage of each format characteristics and to overcome identified specific limitations. RGB images make available quite realistic information about the visual aspect of anatomical structures and the quantity of stored information, higher than CT and MRI (Takanashi et al. 2002), enable a greater level of discrimination among these structures. However, RGB images present drawbacks as, for example, when it comes to delineate bones in the presence of articulations or tendons. In these cases, CT images are more efficient (Beylot et al. 1996).
1.1.5.
3D Reconstruction
32 Figure 1.17 - Poisson surface reconstruction from a point-cloud.
Source: http://doc.cgal.org/latest/Surface_reconstruction_points_3/ [Accessed June 9, 2015]
The map based approach uses maps (e.g., 2D GIS maps) and knowledge about the imaging geometry and acquisition parameters, which allows to reduce the complexity of the 3D building reconstruction process (Suveg & Vosselman 2000).
Aggarwal & Xia (2014) state that “Acquiring 3D data from depth sensors is more convenient than estimating it from stereo images or using motion capture systems”. Methods using active sensors, for example laser scanning, generate point clouds. These point clouds contain 3D coordinates of points from the object surface. The joint use of sensors and images of the objects allows to texturize the surface of the model with a realistic appearance.
33 reconstruction approach (Kazhdan & Hoppe 2013), while unoriented normals require solving for a generalized eigenvalue problem (Alliez et al. 2007).
Current surface reconstruction algorithms are tailored to deal with identified characteristics of point clouds, namely, sampling density, noise, outliers, misalignment, and missing data. Different methods treat these features differently. Although it may not be easy to decide if a method is clearly superior to the others, favorable results can be identified for each of these features. Thus, choosing a reconstruction methodology shall take into account the characteristics of the input data – the point cloud – and the geometric characteristics of the objects to be reconstructed. Issues such as execution times and the complexity of the algorithms can also be taken into account.
1.2.
O
BJECTIVES ANDW
ORKINGA
SSUMPTIONSThe main objective of this thesis is to create a 3D anatomical atlas in a GIS environment. This objective requires the creation and integration of three distinct components:
3D topological model of the human body; GUI to allow user access to the model;
Functions implemented in the interface for exploring the model.
These three points highlight the creation of an application to interact with a 3D representation of the human body. In detailing each of the points, we find the characteristics related to the intended GIS approach.
The model to be developed must have geometric characteristics allowing to represent the entire human body. This means that, in addition to the morphological representation of anatomical structures, i.e., the representation of its outer surface, the model should contain information about the interior of these structures and allow its visualization.
34 The design of the GUI must also include GIS features: indeed, it is intended to obtain an interface where the information, organized in layers, can be managed by a table of contents (TOC), beside which shall be presented the geometric component of the model.
Regarding the functions to implement in the system, which can be accessed through the interface and allow to operate on the model, they have as main objective to extract as much information as possible from the model. To achieve this goal, it is not necessary to think first about the functions of GIS and transport them to the system to be developed. In fact, first we looked to the anatomical atlases to find what kind of information they provide. The first functions were built using this perspective. After replicating the level of information provided by the anatomical atlases, we checked for the GIS functions which could expand the system's capabilities constituting thus a real added value. The set of functions that should incorporate the GUI in the GIS prototype, analyzed in the anatomical atlases and GIS, were defined as the following:
Navigation;
Visualization of the interior and exterior of the model; Information management through layers;
Identification;
Measurement of distances, lengths along anatomical structures (which requires a network/connectivity topology), areas and volumes;
Neighborhood spatial analysis;
Inclusion analysis (e.g., simulation of inserting needles into the human body)
The objectives put forward in this thesis assume a set of assumptions that must be demonstrated during this study.
35 3D applications. The fact that there are several 3D models that are suited to specific problems, but they are not suitable for a wider use, requires the consideration of a specific solution to be studied, that may be based on the features of existing models.
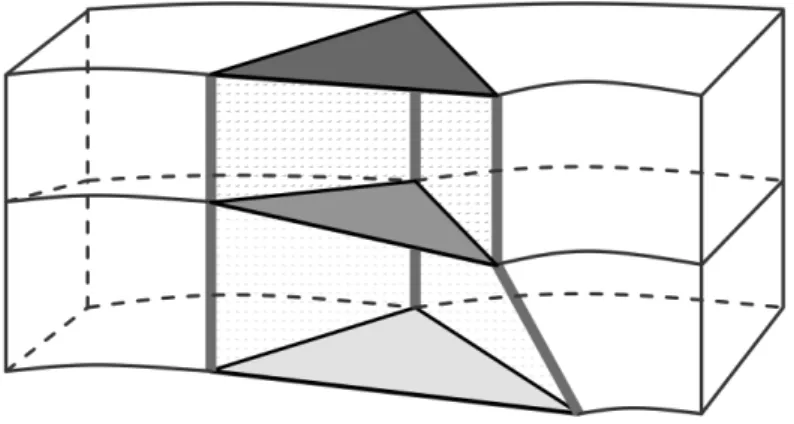
Initially, the possibilities of using a raster or a vector model should be considered. Given that the representation of volume is desired, the vector surface models can be discarded, leaving the decision between a raster and a TEN model. Since topology is also a requirement, the raster approach presents difficulties. The use of a TEN model, according to the data available, requires its resampling, which necessarily results into a poorer information input, even before the model is used. Besides the option of choosing only a vector or raster model, there is still the possibility of considering an integrated model. The development of an integrated vector-raster model could be justified by the following aspects: (i) the volume component (raster or TEN) allows to make the representation of a continuous space, which fits the inside of the anatomical structures. The choice between the raster or TEN approach should take into account the intrinsic characteristics of the two representations, for example, topological features and the nature of the data (raster type); (ii) the use of a vector surface component to define the anatomical structures is, on the one hand, suitable to the development of topology while, on the other, it allows to load the GUI of the system with only vector information without volume data, much lighter than 3D voxel matrices. Thus, the interface would receive raster information only when and where is visualized the inside of anatomical structures.
The answer to the question of the viability of the model was found as the work progressed by studying the literature on the development of GIS to model 3D spaces and after the first experiences with models that have been modified and improved until a stable model was reached that took into account its intended purpose and, largely, the type of data used.
A second issue had to do with the opportunity, that is, is it useful and advantageous to undertake such work knowing beforehand, for example, that there are other systems specifically designed to study the human anatomy? To answer this question it is necessary to situate it in the proper context in which it is intended that the prototype should emulate specifically a 3D anatomical atlas, maximizing the levels of interactivity and functionality. Thus, from the perspective of anatomical atlases, it should be verified if the final prototype meets the requirements of such representations and, in addition, if the taken approach contributes with added-value.