ACPD
6, 11465–11520, 2006Tropical tropospheric ozone
B. Sauvage et al.
Title Page
Abstract Introduction
Conclusions References
Tables Figures
◭ ◮
◭ ◮
Back Close
Full Screen / Esc
Printer-friendly Version
Interactive Discussion
EGU Atmos. Chem. Phys. Discuss., 6, 11465–11520, 2006
www.atmos-chem-phys-discuss.net/6/11465/2006/ © Author(s) 2006. This work is licensed
under a Creative Commons License.
Atmospheric Chemistry and Physics Discussions
Remote sensed and in situ constraints on
processes a
ff
ecting tropical tropospheric
ozone
B. Sauvage1, R. V. Martin1,2, A. van Donkelaar1, X. Liu2, K. Chance2, L. Jaegl ´e3,
P. I. Palmer4, S. Wu5, and T.-M. Fu5
1
Department of Physics and Atmospheric Science, Dalhousie University, Halifax, Nova Scotia, Canada
2
Atomic and Molecular Physics Division, Harvard-Smithsonian Center for Astrophysics, Cambridge, Massachusetts, USA
3
Department of Atmospheric Sciences, University of Washington, Seattle, Washington, USA
4
School of GeoSciences, University of Edinburgh, UK
5
Department of Earth and Planetary Sciences and Division of Engineering and Applied Sciences, Harvard University, Cambridge, Massachusetts, USA
Received: 5 October 2006 – Accepted: 8 November 2006 – Published: 17 November 2006
ACPD
6, 11465–11520, 2006Tropical tropospheric ozone
B. Sauvage et al.
Title Page
Abstract Introduction
Conclusions References
Tables Figures
◭ ◮
◭ ◮
Back Close
Full Screen / Esc
Printer-friendly Version
Interactive Discussion
EGU
Abstract
We use a global chemical transport model (GEOS-Chem) to evaluate the consis-tency of satellite measurements of lightning flashes and ozone precursors with in situ measurements of tropical tropospheric ozone. The measurements are tropospheric O3, NO2, and HCHO columns from the GOME satellite instrument, lightning flashes
5
from the OTD and LIS instruments, profiles of O3, CO, and relative humidity from the
MOZAIC aircraft program, and profiles of O3from the SHADOZ ozonesonde network. We interpret these multiple data sources with our model to better understand what controls tropical tropospheric ozone. Tropical tropospheric ozone is mainly affected by lightning and convection in the upper troposphere and by surface emissions in the lower
10
troposphere. Scaling the spatial distribution of lightning in the model to the observed flash counts improves the simulation of O3 in the upper troposphere by 5–20 ppbv
versus in situ observations and by 1–4 Dobson Units versus GOME retrievals of tropo-spheric O3columns. A lightning source strength of 5±2 Tg N/yr best represents in situ
observations from aircraft and ozonesonde. Tropospheric NO2 and HCHO columns
15
from GOME are applied to provide top-down constraints on emission inventories of NOx(biomass burning and soils) and VOCs (biomass burning). The top-down biomass burning inventory is larger by a factor of 2 for HCHO and alkenes, and by 2.6 for NOx
over northern equatorial Africa. These emissions increase lower tropospheric O3 by
5–20 ppbv, improving the simulation versus aircraft observations, and by 4 Dobson
20
Units versus GOME observations of tropospheric O3columns. Emission factors in the
a posteriori inventory are more consistent with a recent compilation from in situ mea-surements. The ozone simulation using two different dynamical schemes (GEOS-3 and GEOS-4) is evaluated versus observations; GEOS-4 better represents O3observations
by 5–15 ppbv due to enhanced convective detrainment in the upper troposphere.
Het-25
ACPD
6, 11465–11520, 2006Tropical tropospheric ozone
B. Sauvage et al.
Title Page
Abstract Introduction
Conclusions References
Tables Figures
◭ ◮
◭ ◮
Back Close
Full Screen / Esc
Printer-friendly Version
Interactive Discussion
EGU
1 Introduction
Ozone (O3) in the tropical troposphere is a major component of atmospheric
radia-tive forcing (de Forster et al., 1997; Lacis et al., 1990) and plays a key role in the global oxidizing power of the atmosphere (Logan et al., 1981). Indeed tropical re-gions present high ultraviolet radiation and humidity rates that promote hydroxyl (OH)
5
creation through O3 photolysis (Thompson et al.,1992). Tropical tropospheric O3
pro-duction is limited by nitrogen oxides (NOx=NO+NO2) emitted from biomass burning
(Chatfield and Delany, 1990), biogenic sources, lightning, and fossil fuel combustion
(Jacob et al.,1996). The motivation of the present manuscript is to better understand
processes affecting tropical tropospheric O3, using a global chemical and transport
10
model constrained with satellite and in situ data.
Considerable uncertainty remains in the magnitude and distribution of tropical O3
precursor emissions, such as NOx (Lee et al., 1997; Holland et al., 1999). Lightning produced NOx (L-NOx) are the most uncertain with recent estimates varying by an
order magnitude from 1 to 13 Tg N/yr (Nesbitt et al., 2000; Price et al., 1997). Lightning
15
NOx emissions are largest over the Tropics, in the Inter Tropical Convergence Zone (ITCZ) area (Christian et al.,2003), and are directly emitted into the free troposphere where long lifetimes and efficient O3production make the O3 burden very sensitive to
those emissions (Martin et al.,2002a). Surface sources from biomass burning and soils are also highly uncertain (around 3–13 Tg N/yr and 4–21 Tg N/yr respectively,Holland 20
et al.,1999). Biomass burning accounts for half of the global CO emissions (Andreae
et al., 1993) and most recently soils have been highlighted to be an underestimated NOx source (Jaegl ´e et al., 2004). Bottom-up estimates of these tropical emissions
have been confounded by the lack of measurements in this remote region.
The goal of the present study is motivated by 2 objectives: 1/ use a global
chemi-25
cal transport model to evaluate the consistency of satellite measurements of lightning flash counts and O3 precursors with in situ measurements of tropospheric O3, and 2/
bet-ACPD
6, 11465–11520, 2006Tropical tropospheric ozone
B. Sauvage et al.
Title Page
Abstract Introduction
Conclusions References
Tables Figures
◭ ◮
◭ ◮
Back Close
Full Screen / Esc
Printer-friendly Version
Interactive Discussion
EGU ter understand what controls tropical tropospheric O3. Indeed evaluation of satellite
data is limited over the tropics because of lack of in situ measurements especially for O3 precursors. Understanding of tropical tropospheric O3 is also limited by
cur-rent uncertainties on anthropogenic and natural O3precursors sources, which can be readily inferred from satellite observations. Global measurements of nitrogen
diox-5
ide (NO2) atmospheric concentrations from space provide a top-down constraint on
NOx emissions (Martin et al., 2003a; Jaegl ´e et al., 2005; Leue et al., 2001). Tropo-spheric NO2 columns track surface NOx emissions on a regional scale since NO2 is
the dominant form of NOxin the boundary layer and the NOxlifetime against oxidation
in the tropical boundary layer is several hours. Similarly, volatile organic compounds
10
(VOC) emissions, critical for understanding radical chemistry in the troposphere, can be constrained by formaldehyde (HCHO) columns measured from space (Palmer et al.,
2003). Indeed HCHO is a high-yield product of VOC oxidation with a lifetime of hours
(Palmer et al., 2003). Interpretation of these two tropospheric column molecules is
then fundamental for evaluation of a correct location and intensity of ground sources
15
of O3 precursors. In situ measurements from the Measurements of ozone and water
vapor by in-service Airbus aircraft (MOZAIC) program (Marenco et al., 1998; Thouret et al., 2006) and the Southern Hemisphere Additional Ozonesondes SHADOZ network (Thompson et al., 2003a, b) provide vertical profile information that is unavailable from satellite. Few studies have used at the same time the different dataset available over
20
the Tropics, through in situ measurements and satellite observations, to better under-stand tropical tropospheric O3. A global chemical transport model is a useful tool to
relate measurements from these disparate sources.
We provide an overview of the data sets in Sect.2. A complete description of the GEOS-Chem global chemical transport model is in Sect.3.1. Then we introduce the
25
standard simulation used in this study, based on improvements described in the same Sect. 3.2. These improvements enable a better understanding of factors controling tropospheric tropical O3. In Sect. 4, we first evaluate the simulation and integration of
ACPD
6, 11465–11520, 2006Tropical tropospheric ozone
B. Sauvage et al.
Title Page
Abstract Introduction
Conclusions References
Tables Figures
◭ ◮
◭ ◮
Back Close
Full Screen / Esc
Printer-friendly Version
Interactive Discussion
EGU and chemical processes driving tropical tropospheric O3.
2 Presentation and overview of the data
The following measurements are used to improve and evaluate the GEOS-Chem chem-ical transport model.
2.1 In situ data. Aircraft and ozonesonde measurements
5
Since 1994, the MOZAIC airborne program provides regular measurements of ozone (the overall precision is ±2 ppbv+2%) and water vapor at high spatial and
tempo-ral resolution (Marenco et al., 1998). Recent details are available at http://mozaic.
aero.obs-mip.fr). Additional CO measurements are performed onboard the five instru-mented aircraft (N ´ed ´elec et al.,2003) since the end of 2000 with an overall precision
10
of±5 ppbv,±5%. Table1contains characteristics of the MOZAIC sites, with their
loca-tions shown in Fig. 1 in blue font. We use 19 of the 30 cities sampled by the MOZAIC program between 30◦N–30◦S, the most sampled ones, with 15 to 60 flights per month for a site. This corresponds to a total of 6750 flights over all regions.
We analyze the data in monthly average for the 1994–2005 period, except for West
15
Africa where measurements began in 2001 (Sauvage et al.,2005). For each site, we remove data within 15 km of a site, to avoid local pollution that is not representative of the broader region. This criterion removes the lowest 25–50 hPa.
The SHADOZ network complements the MOZAIC coverage as shown in Fig. 1 in black. It provides regular ozonesonde measurements (Thompson et al.,2003a,b), at
20
different tropical stations, at least twice a month. Further details can be found on the SHADOZ Web site: http://croc.gsfc.nasa.gov/shadoz/. We use measurements over the 1998-2004 period.
For clarity and conciseness, we present a subset representative of the broader re-gion indicated by the black rectangle in Fig. 1. We also examined other sites within
ACPD
6, 11465–11520, 2006Tropical tropospheric ozone
B. Sauvage et al.
Title Page
Abstract Introduction
Conclusions References
Tables Figures
◭ ◮
◭ ◮
Back Close
Full Screen / Esc
Printer-friendly Version
Interactive Discussion
EGU each region, but found similar features.
2.2 Space-based observations. The LIS, OTD and GOME instruments
The Optical Transient Detector (OTD) (Boccippio et al, 2000b) was launched in 1995 on the MicroLab-1 satellite. The OTD spatial resolution is 10 km over a field of view of 1300 km×1300 km. The OTD detects both intra-cloud (IC) and cloud-to-ground (CG) 5
discharges during day and night conditions with a 40–65% detection efficiency. The Lightning Imaging sensor (LIS) was launched in 1997 aboard the Tropical Rainfall Mea-suring Mission (TRMM) Observatory into a nearly circular orbit inclined 35 degrees with an altitude of 350 km. It detects lightning with storm-scale resolution of 3–6 km (3 at nadir, 6 at limb) over 550×550 km. The system is enabled to detect weak lightning and 10
achieve a 90% detection efficiency (Christian et al.,1989).
The Global Ozone Monitoring Experiment (GOME) (Burrows et al.,1999) instrument onboard the European Remote Sensing-2 satellite provided the capability for continu-ous global monitoring of O3, NO2 and HCHO atmospheric columns through
observa-tion of solar backscatter over 1995–2003. GOME observes the atmosphere in the nadir
15
view with a 40 km along track by 320 km across track. Global coverage is achieved ev-ery 3 days with an overpass time over the tropics between 10–11 local time (crossing the equator at 1030 local time). In this work we use GOME measurements for the year 2000.
We begin with tropospheric NO2 line-of-sight (slant) columns retrieved from the
20
GOME observations by Martin et al. (2002b) version 2 (Guerova et al., 2006), and HCHO slant columns retrieved by (Chance et al.,2000). FollowingPalmer et al.(2001) we calculate vertical columns by applying an air mass factor (AMF) algorithm to ac-count for atmospheric scattering. The AMF is computed as the integral of the relative vertical distribution of the trace gas (shape factor), weighted by the altitude dependent
25
scattering weights computed from the LIDORT radiative transfer model (Spurr et al.,
ACPD
6, 11465–11520, 2006Tropical tropospheric ozone
B. Sauvage et al.
Title Page
Abstract Introduction
Conclusions References
Tables Figures
◭ ◮
◭ ◮
Back Close
Full Screen / Esc
Printer-friendly Version
Interactive Discussion
EGU GOME (Kurosu et al.,1999) as described inMartin et al.(2002b). The aerosol
correc-tion uses aerosol profiles from the GEOS-Chem model followingMartin et al.(2003a). We exclude observations in which the fraction of backscattered intensity from clouds exceeds 50% of a GOME scene. The stratospheric NO2column is removed using ob-servations over the central Pacific where there is little tropospheric NO2, and
subtract-5
ing the corresponding column from the ensemble of GOME scenes for the appropriate latitude and month. The result is corrected for the small amount of tropospheric NO2 over the Pacific. Variability in the stratospheric NO2 columns is accounted for using
assimilated stratospheric NO2 columns from Boersma et al. (2004), a minor issue in
the Tropics.
10
Martin et al.(2004) evaluated the GOME retrieval with airborne in situ measurements
of NO2 and HCHO over the Southeastern United States. Uncertainties include
abso-lute errors of 1×10¹⁵molecules cm−2 for tropospheric NO2(Martin et al.,2002b) and
4×10¹⁵molecules cm−2 for HCHO (Chance et al., 2000) from the spectral fitting, the
stratospheric NO2column and instrument artifacts. Other uncertainties arising from the
15
AMF calculation include random and systematic contributions from surface reflectivity, clouds, aerosols, and the trace gas profile (Martin et al., 2003a; Boersma et al., 2004). The monthly mean uncertainty is ± (5×10¹⁴molecules cm−2+30%) for tropospheric NO2and a 30% (Millet et al.,2006) error on the HCHO column retrieval that increases
in the presence of biomass burning aerosol (Fu et al., 20061). van Noije et al. (2006)
20
compared three difference retrievals of tropospheric NO2 columns from GOME, and found the greatest degree of consistency in the tropics, well within the error estimates reported here.
For O3, we use version 2 of tropospheric O3 columns retrieved byLiu et al.(2005). The retrieval uses an optimal estimation method (Rodgers,2000). Tropospheric ozone
25
1
ACPD
6, 11465–11520, 2006Tropical tropospheric ozone
B. Sauvage et al.
Title Page
Abstract Introduction
Conclusions References
Tables Figures
◭ ◮
◭ ◮
Back Close
Full Screen / Esc
Printer-friendly Version
Interactive Discussion
EGU columns (TOC), the sum of tropospheric partial columns, are interpolated with the
GEOS-Chem model tropopause used to divide the stratosphere and the troposphere. GOME retrievals and GEOS-Chem simulations are mapped onto a common regular grid.
3 General description of the GEOS-Chem model – original and standard
ver-5
sions
A global 3-D model of tropospheric chemistry provides a quantitative tool to assess the processes affecting tropospheric ozone. We use the GEOS-Chem chemical and transport model (Bey et al.,2001). In the following we first introduce the original model version (7-02-04http://www-as.harvard.edu/chemistry/trop/geos/index.html). Then we
10
describe the “standard” simulation, focusing on developments to improve the original simulation.
3.1 Original version
The model is driven by assimilated meteorological data for 2000 from the Goddard Earth Observing System (GEOS-4) at the NASA Global Modeling and Assimilation
15
Office (GMAO). The model version has 30 vertical sigma-levels (surface to 0.1 hPa), and a horizontal resolution of 1◦latitude by 1.25◦longitude, which can be degraded to 2◦
latitude by 2.5◦longitude and 4◦ latitude by 5◦ longitude for computational expediency. We use the latter two resolutions in the study. The data have 6-hour temporal resolution (3-hour for surface variables and mixing depth). We present sensitivity simulations
20
using GEOS-3 as discussed in Sect. 4.4.
The GEOS-Chem model includes a detailed simulation of tropospheric O3-NOx
-hydrocarbon chemistry as well as of aerosols and their precursors, using 41 tracers, around 90 species, and 300 reactions. The model presently includes sulfate, nitrate, ammonium, black and organic carbon, mineral dust and sea salt (Park et al., 2004,
ACPD
6, 11465–11520, 2006Tropical tropospheric ozone
B. Sauvage et al.
Title Page
Abstract Introduction
Conclusions References
Tables Figures
◭ ◮
◭ ◮
Back Close
Full Screen / Esc
Printer-friendly Version
Interactive Discussion
EGU 2005; Alexander et al., 2005; Fairlie et al., 20062). The aerosol and gaseous
simula-tions are coupled through formation of sulfate and nitrate, HNO3(g)/NO3− partitioning
of total inorganic nitrate, heterogeneous chemistry on aerosols (Jacob, 2000; Evans et al., 2005), and aerosol effects on photolysis rates (Martin et al.,2003b). The model has been previously applied to interpret satellite observations of HCHO (Palmer et al.,
5
2001, 2003, 2006; Shim et al., 2005; Millet et al., 2006), NO2 (Martin et al., 2002b, 2003a; Jaegl ´e et al., 2004, 2005; Guerova et al., 2006), and tropospheric O3 (Martin
et al., 2002a; Chandra et al., 2002, 2003; Kim et al., 2005; Liu et al., 2006). However, none of these studies has examined all three species together.
Table2 contains annual global NOx emissions used in the model. Soil NOx
emis-10
sions are computed using a modified version of the algorithm of Yienger and Levy
(1995) with the canopy reduction factors described inWang et al.(1998). The biomass burning inventory is interannually varying and is based on satellite observations of fires as derived byDuncan et al.(2003). Emissions of lightning NOxare linked to deep
con-vection following the parameterization ofPrice et al.(1992) with vertical profiles from
15
Pickering et al.(1998) as implemented byWang et al.(1998).
3.2 Standard (improved) version
In the following section we present several developements which are necessary for accurate understanding and evaluation of the processes affecting tropical tropospheric O3described in Sect. 4. These improvements deal with emissions and heterogeneous
20
chemistry that are included in our standard simulation. GOME observations of NO2and
HCHO are applied to constrain surface emissions of NOx and VOCs. Lightning flash counts are used to better represent its spatial distribution. Heterogeneous chemistry on aerosols is updated to reflect recent measurements.
2
ACPD
6, 11465–11520, 2006Tropical tropospheric ozone
B. Sauvage et al.
Title Page
Abstract Introduction
Conclusions References
Tables Figures
◭ ◮
◭ ◮
Back Close
Full Screen / Esc
Printer-friendly Version
Interactive Discussion
EGU 3.2.1 Soil NOxemissions
Strong signals from soil NOxemissions are apparent in satellite observations of
tropo-spheric NO2 columns (Bertram et al., 2005). We use the a posteriori NOx emission inventory derived from GOME observations of NO2 columns by Jaegl ´e et al. (2005)
for the year 2000. GOME tropospheric NO2 column observations were related to
sur-5
face NOx emissions via inverse modeling with GEOS-Chem model. They used the spatio-temporal distribution of remotely sensed fires and a priori inventory information on the locations of regions dominated by fuel combustion to partition among the dif-ferent NOx sources. The resulting annual tropical emissions are 35% higher in the a posteriori inventory (Table2) and account for 22% of tropical NOx emissions. During
10
March-April-May (MAM) and June-July-August (JJA), emissions increase by a factor of 3 over tropical ecosystems of Africa, reflecting a better constraint on NOx emissions associated with the monsoon (Jaegl ´e et al.,2004). Emissions increase by 20% during the rainy season over South America, and the agricultural region of North India.
3.2.2 Biomass burning emissions of NOxand VOCs
15
We apply tropospheric NO2and HCHO columns retrieved from GOME to provide top-down constraints on regional biomass burning emissions of NOx and reactive VOCs.
Richter et al. (2002) found a strong signal from biomass burning in the GOME NO2
columns. Our inversion for biomass burning NOx is conducted after application of the a posteriori soil NOx inventory fromJaegl ´e et al.(2005). The NOx inversion accounts
20
for the local NO2/NO ratio and the local NOx lifetime following Martin et al. (2003a).
The inversion is applied here at regional scale in the form of NOxemission factors that
should be applicable to simulations for other years.
Palmer et al. (2003) showed that HCHO columns over North America are closely
related to isoprene emissions, and exploited that relationship to infer continental
iso-25
ACPD
6, 11465–11520, 2006Tropical tropospheric ozone
B. Sauvage et al.
Title Page
Abstract Introduction
Conclusions References
Tables Figures
◭ ◮
◭ ◮
Back Close
Full Screen / Esc
Printer-friendly Version
Interactive Discussion
EGU Africa. Shim et al. (2005) extended the approach ofPalmer et al.(2003) to infer global
isoprene emissions, but found that large increases in biomass burning emissions were necessary to reconcile the GOME observations. More recently, Fu et al. (2006)1found over East and South East Asia a biomass burning source derived from GOME almost 5 times the estimate of a bottom-up emission inventory. We similarly find over the tropics
5
an underestimate of more than a factor two in the GEOS-Chem HCHO columns during biomass burning. Neither scaling of the current GEIA isoprene emission inventory, nor application of the recently developed MEGAN inventory (Guenther et al.,2006), was able to account for the discrepancy without introducing biases outside of the biomass burning season. A recent compilation by Andreae (2005, personal communication) of in
10
situ measurements of emission factors contain values that are higher than those used in GEOS-Chem for HCHO and alkenes. We tentatively attribute the regional difference between GOME and GEOS-Chem HCHO columns to biomass burning emissions of alkenes and HCHO, and calculate a tropical mean emission ratio for reactive VOCs emissions that is a factor of 2 larger for both species.
15
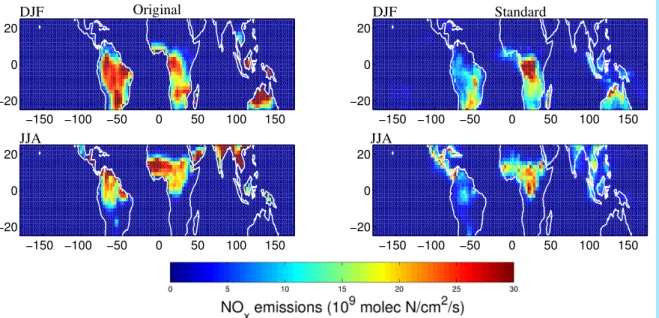
Figure 2 shows the seasonal NOxbiomass burning emissions arising from the a priori
(left) and top-down (right) inventories. Annual tropical NOxemissions are 30% higher in the top-down versus the a priori (Table2). NOx emissions from Africa and eastern
regions increase by 30%, whereas they decrease from South America by 30%. The largest absolute difference occurs in DJF over Northern Africa with top-down emissions
20
of 0.96 Tg N /season compared to 0.41 Tg N /season, likely reflecting emission factors that were too low in the original simulation. There is also a 15% increase in emissions from Central/South Africa during JJA to 1.06 Tg N.
3.2.3 Lightning NOxemissions
We use space-based observations of lightning flash counts from the seasonally varying
25
ACPD
6, 11465–11520, 2006Tropical tropospheric ozone
B. Sauvage et al.
Title Page
Abstract Introduction
Conclusions References
Tables Figures
◭ ◮
◭ ◮
Back Close
Full Screen / Esc
Printer-friendly Version
Interactive Discussion
EGU local seasonal rescaling factor,R:
R= Local(LIS/OTD)flashes Global(LIS/OTD)flashes
!
season
Local(GEOS−Chem)flashes
Global(GEOS−Chem)flashes
!
season
(1)
This approach is motivated by the seasonal latitudinal variation in tropical lightning activity that is not well represented by the GEOS fields. The scaling factor is applied
5
to a 10-year average of the simulated and observed flashes, such that inter-annual variability of the lightning emissions is allowed. The climatology is a 0.5◦
×0.5◦ gridded
composite of total intra cloud – cloud to ground (IC+CG) lightning bulk production over 1995–2004. Lowpass temporal filtering of 110 days for the combined LIS/OTD is ap-plied. Observations in the LIS/OTD v1.0 reanalysis have been corrected by the LIS
10
Science Team for flash detection efficiency, applied as a function of sensor, viewing time, date of mission, and (for OTD) geographic location. For the entire dataset, these corrections correspond to average flash detection efficiencies of 47% (OTD) and 82% (LIS) (Boccippio et al., 2002; Christian et al., 2003). The adjustments derive from a combination of laboratory calibration, ground validation, and cross-normalization
be-15
tween OTD and LIS. The uncertainty in these corrections is±10%.
Figure 3 shows the seasonal average lightning NOx emissions (L-NOx) during DJF and JJA, for the original (left), and standard (right) simulations. The LIS/OTD seasonal climatologies and the improved L-NOxemissions in GEOS-Chem exhibit higher
spatio-temporal correlations (r2=0.97–0.98) than in the original simulation (r2=0.4–0.57).
An-20
nual emissions are unchanged (Table2). However substantial regional differences are inferred by the local rescaling. Emissions decrease over Africa by 16%, over South America by 42%, and increase from the Eastern tropics by 55% (mostly over Aus-tralia). During JJA, continental L-NOx emissions decrease south of the ITCZ by 50%
whereas they increase by 45% over North Africa. During DJF continental emissions
ACPD
6, 11465–11520, 2006Tropical tropospheric ozone
B. Sauvage et al.
Title Page
Abstract Introduction
Conclusions References
Tables Figures
◭ ◮
◭ ◮
Back Close
Full Screen / Esc
Printer-friendly Version
Interactive Discussion
EGU decrease in general by around 50%. Oceanic emissions increase by a factor of 2.9.
3.2.4 Heterogeneous chemistry
The original simulation used a reaction probabilityγof HO2on all aerosols equal to 0.2.
Laboratory measurements byThornton et al.(2005) demonstrated that HO2uptake on
aerosols is negligible at temperatures warmer than 270 K in the absence of Cu or Fe
5
ions that would catalyze the reaction. Field measurements of biomass burning aerosol
(Yamasoe et al.,2000) found insufficient Cu or Fe ions to catalyze that reaction. We
exclude this reaction for biomass burning aerosols.
FollowingBauer et al.(2004) we implement HNO3uptake on mineral aerosols in the
standard simulation using γ(HNO3)=0.1. Laboratory experiments have shown HNO3
10
uptake on mineral dust is promoted by its alkalinity (Goodman et al., 2000; Gras-sian, 2000; Underwood et al., 2001; Michel et al., 2002; Hanisch and Crowley, 2003). Field measurements also support HNO3uptake (Tabazadeh et al., 1998; Thakur et al.,
1999). Rapid sedimentation of nitrate on mineral dust could reduce recycling of NOx from HNO3, and in turn O3, with lower tropospheric O3decreases of 8–30% over and
15
downwind of deserts (Bian et al., 2003; Bauer et al., 2004; Umann et al., 2005; Liao et al., 2005).
There have been few comparisons with in situ measurements to evaluate these het-erogeneous processes. In Sect. 4.3 we perform sensitivity studies to evaluate the uptake of HO2on biomass burning aerosols and uptake of HNO3on mineral dust.
20
4 Assessment of the dynamical and chemical processes affecting tropospheric
tropical ozone
Of particular interest is 1/ the ability of the model to accurately simulate the distribution of tropospheric ozone and its precursors in order to 2/ accurately understand what controls tropical tropospheric ozone. We first give an overview of the distribution of
ACPD
6, 11465–11520, 2006Tropical tropospheric ozone
B. Sauvage et al.
Title Page
Abstract Introduction
Conclusions References
Tables Figures
◭ ◮
◭ ◮
Back Close
Full Screen / Esc
Printer-friendly Version
Interactive Discussion
EGU tropospheric ozone columns. We then discuss the processes affecting its distribution
in the context of the MOZAIC and SHADOZ vertical O3 profiles, as well as the GOME tropospheric NO2and HCHO columns.
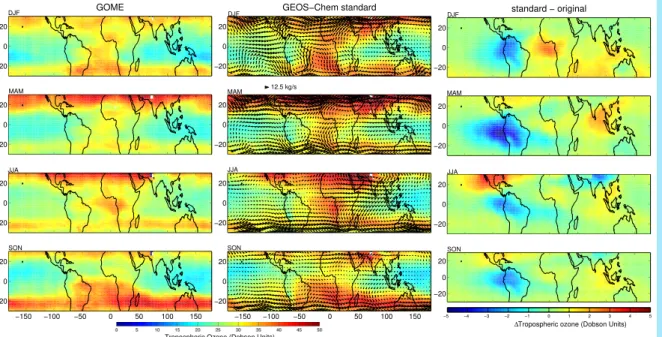
Figure 4 shows seasonal TOC from GOME observations (left), our standard simu-lation (middle). We exclude retrievals with cloud fraction exceeding 0.7 of a GOME
5
scene. The simulated and retrieved O3 columns exhibit similar spatio-temporal
varia-tion over the Tropics (monthly r2=0.91–0.98; seasonal bias=1.4–4.4 DU). Both show enhancements in the downwelling branches of the Hadley circulation, smaller values in the Tropics, and a zonal wave-one pattern, with maximum TOC between 40W-60E. The original and retrieved TOC are less consistent (monthly r2=0.67–0.87) although
10
the tropical mean bias remains unchanged.
The right panels show large regional changes of 5 DU in the simulated O3. In the
fol-lowing sections we focus on the consequences of our developments on the comparison of the model versus observations.
4.1 Sensitivity to lightning
15
Here we discuss how the local rescaling of lightning flashes affects the comparison with O3observations. Then we discuss the sensitivity of the simulation to lightning intensity
and to lightning vertical distribution.
4.1.1 Satellite constraint. Lightning rescaling
The local rescaling of lightning flashes to match OTD/LIS measurements yields
sub-20
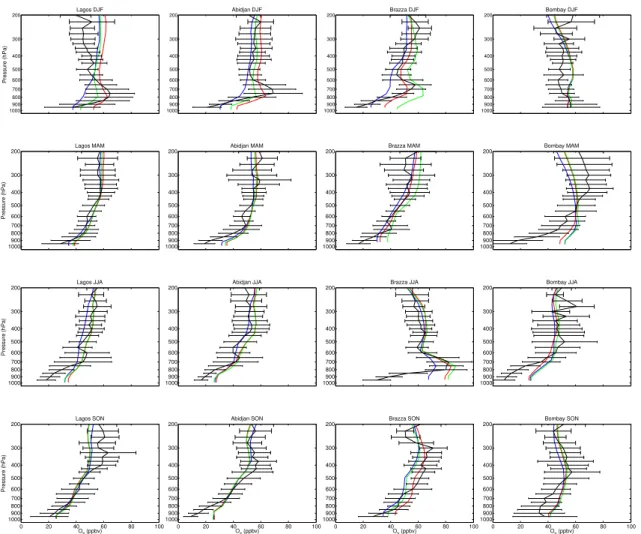
stantial improvement in the modeled TOC as demonstrated below. We compare the original and standard simulations at MOZAIC and SHADOZ sites that exhibit the largest sensitivity to lightning. These sites are generally in subsidence regions downwind of lightning activity, allowing for O3 production during transport. Figure 5 shows the
sea-sonal O3vertical profiles for the in situ measurements (MOZAIC, SHADOZ, black lines);
25
ACPD
6, 11465–11520, 2006Tropical tropospheric ozone
B. Sauvage et al.
Title Page
Abstract Introduction
Conclusions References
Tables Figures
◭ ◮
◭ ◮
Back Close
Full Screen / Esc
Printer-friendly Version
Interactive Discussion
EGU are generally within one standard deviation of the in situ measurements. However
im-provements due to the lightning rescaling are apparent in the standard simulation in the middle and upper troposphere.
The first panel of Fig. 5 show continental sites with O3concentrations of 40–50 ppbv
throughout the year in the middle and upper troposphere, sustained by L-NOx
emis-5
sions in the South American Convergence Zone (SACZ) or the ITCZ. The lightning rescaling reduces L-NOxemissions in South America (Fig. 3) decreasing in upper
tro-pospheric O3during DJF and MAM by 5–10 ppbv over Sao Paolo and by 10–15 ppbv over Caracas. The Middle East is under the influence of an anticyclonic circulation in the middle and upper troposphere (Hoskins and Rodwell, 1995) and of easterly flow
10
through the Tropical Easterly jet in the upper troposphere, which brings lightning out-flow during the Indian monsoon (Li et al., 2001), mainly during JJA as depicted by the easterly ozone flux (Fig. 4). Reductions in Indian L-NOxemissions improve the
simula-tion at Dubai by 5–10 ppbv in JJA and SON. Bangkok is influenced by lightning mostly during the dry season from November to May when the circulation is convergent.
Light-15
ning rescaling improves the O3simulation by 5–15 ppbv. Other continental sites exhibit
less sensitivity due to their proximity to L-NOxemissions.
The effect of local lightning rescaling is also apparent in the TOC. Table3contains the TOC for the standard simulation, the in situ measurements, and the GOME retrievals. Lightning rescaling has a considerable effect on O3 over South America (Fig. 4, right
20
panel) reducing the model bias versus the in situ measurements to within 2 DU over Caracas and within 4 DU over Sao Paolo, compared to more than 8 DU difference in the original simulation. The simulation is closer to in situ TOC than to GOME observations over both regions. Over the Middle East lightning rescaling improves the simulated TOC by 3–5 DU to within 2–5 DU. The remaining bias at Dubai arises from the O3
25
ACPD
6, 11465–11520, 2006Tropical tropospheric ozone
B. Sauvage et al.
Title Page
Abstract Introduction
Conclusions References
Tables Figures
◭ ◮
◭ ◮
Back Close
Full Screen / Esc
Printer-friendly Version
Interactive Discussion
EGU 7 DU. The lightning rescaling clearly yields better modeled TOC versus MOZAIC to
within 1–4 DU, versus 7 DU for the original simulation.
The second panel of Fig. 5 show that lightning rescaling also yields improvements over oceanic sites. Lightning rescaling increases emissions over the South Pacific Con-vergence Zone (Fig. 3) especially in DJF and SON resulting in a 5–10 ppbv increase
5
in O3in the middle and upper troposphere (Samoa, Fig. 5). Over Reunion Island there
is improvement in DJF due to a 7 ppbv increase in O3. The Atlantic, Ascension and Natal depict similar O3vertical profiles near the maximum of the zonal-wave one, with
enhanced mid-upper tropospheric O3 throughout the year. Lightning is a significant
source of this enhancement (Thompson et al., 2000; Martin et al., 2002a; Sauvage
10
et al., 2006b3). The main improvements are in DJF and MAM with O3 increases of 7–10 ppbv from more lightning over Central Africa in the standard simulation (Fig. 3). During SON, both simulations in the middle troposphere and upper troposphere under-estimate O3by 10 to 20 ppbv, but O3remains enhanced.
The TOC over oceans are generally consistent between the standard simulation,
15
GOME and in situ measurements, within 5 DU everywhere. Over Ascension the stan-dard simulation is closer than the original one to in situ measurements by 1–3 DU in DJF and MAM. However there is still an underestimate of 4 DU in SON. Better agree-ment is found over the Pacific and Indian Ocean, within 1–3 DU compared to in situ measurements, and within 2–5 DU versus GOME TOC.
20
Finally the seasonal cycle of the modeled TOC is reproduced for all sites, except over Caracas. The last line of Table3shows that for the TOC averaged for the tropical sites, the three datasets are within 2 DU bias and within 1σ of the measurements. The seasonal cycle is well reproduced, with maximum in SON, minimum in MAM, as depicted by the southern hemispheric zonal-wave one pattern (Thompson et al., 2003b;
25
Sauvage et al., 2006a).
3
ACPD
6, 11465–11520, 2006Tropical tropospheric ozone
B. Sauvage et al.
Title Page
Abstract Introduction
Conclusions References
Tables Figures
◭ ◮
◭ ◮
Back Close
Full Screen / Esc
Printer-friendly Version
Interactive Discussion
EGU 4.1.2 Lightning intensity and distribution
a. Sensitivity to intensity
In order to evaluate the lightning NOx source of 5 Tg N/yr, we conduct sensitivity studies based on the standard simulation that vary the intensity over 3 to 7 Tg N yr−1.
5
Figure 5 shows the sensitivity of the seasonal O3vertical profiles to L-NOxintensity,
using either 3 or 7 Tg N/yr (dashed green lines). Lower concentrations reflect the sim-ulation with 3 Tg N/yr. In general O3 is perturbed throughout the entire troposphere
by 5–10 ppbv. The simulation remains nearly within one standard deviation of mea-surements. However 3 Tg N/yr is generally too low. In contrast 7 Tg N/yr is generally
10
too high. The largest sensitivity to intensity is found over the Atlantic region where O3 concentrations change by 10–20 ppbv. The simulation with 7 Tg N/yr reduces the
model bias versus in situ measurements in SON at Ascension (Fig. 5), but creates a bias during other seasons, and at most other sites. Emissions of 9.7 Tg N/yr would be necessary to achieve in situ O3concentrations in SON at Ascension. Another process
15
is likely responsible for the bias.
In summary, 5±2 Tg N yr−1 represents the plausible range of lightning NOx
emis-sions. Outside of that range, simulated O3 becomes increasingly inconsistent with
in situ measurements. This is obviously dependent of the accuracy of all surface sources. Martin et al. (2006)4found a similar magnitude of 6±2 Tg N yr−1best agreed 20
with space-based measurements of NO2, O3and HNO3.
b. Sensitivity to distribution
The vertical distribution of lightning emissions is also important (Labrador et al.,
25
4
ACPD
6, 11465–11520, 2006Tropical tropospheric ozone
B. Sauvage et al.
Title Page
Abstract Introduction
Conclusions References
Tables Figures
◭ ◮
◭ ◮
Back Close
Full Screen / Esc
Printer-friendly Version
Interactive Discussion
EGU
2005). Most previous studies assumed much higher NOxemissions per flash for cloud to ground (CG) flashes than intra-cloud (IC) flashes (Price et al., 1997; Pickering et al., 1998). However, recent studies provide evidence that the IC/CG ratio may be between 0.5–1.0 (DeCaria et al., 2000; Fehr et al., 2004). The implications have not yet been evaluated versus tropical in situ O3data. We explore the implications of increasing the
5
IC/CG ratio to 0.75, instead of 0.1 in our standard simulation. The additional NOx from
intra-cloud flashes is distributed within the cloud anvil.
The simulation using enhanced IC emissions is shown in Fig. 5 (solid green line). Generally, this lightning parameterization overestimates middle-upper tropospheric O3,
but remains within one standard deviation of measurements. The effects vary with
10
season and location, with for example negligible incidence at Caracas, a negative bias at Bangkok, and a large impact at Ascension. Over Ascension, O3 concentrations are
biased high in DJF and MAM by 10–15 ppbv, but the model bias in SON is eliminated suggesting a seasonal variation in the IC/CG ratio. In summary, a uniform increase in the IC/CG ratio is unsupported by the in situ O3 profiles, but it could be higher for
15
particular geographical regions.
4.2 Sensitivity to biomass burning and soils
In this section we address the following questions: What are the consequences of the modifications to surface emissions of NOx and VOCs on O3 distributions? Do these
changes improve the simulated tropospheric O3compared to in situ measurements?
20
4.2.1 Satellite constraint
Figure 6 shows seasonal average GOME (left) and GEOS-Chem (middle: standard; right: original) tropospheric columns of NO2, during 2000. The GOME and
GEOS-Chem NO2standard columns are highly consistent over the Tropics during the 4 sea-sons. The coefficient of determination of the retrieved columns versus the standard
25
ACPD
6, 11465–11520, 2006Tropical tropospheric ozone
B. Sauvage et al.
Title Page
Abstract Introduction
Conclusions References
Tables Figures
◭ ◮
◭ ◮
Back Close
Full Screen / Esc
Printer-friendly Version
Interactive Discussion
EGU versus the original simulation, which are in the range of r2=0.6–0.8. The annual mean
absolute difference between the standard simulation and retrieved columns over the Tropics is 0.2×10¹⁵molecules cm−2 compared with 0.7×10¹⁵molecules cm−2 in the
original simulation. The standard simulation better reproduces seasonal NO2maxima
observed by GOME. For instance over Northern Africa during DJF and MAM, top down
5
biomass burning NOxemissions enhance lower tropospheric NO2concentrations by a factor of 2.6, reducing a regional model bias. Over Central Africa, the regional bias in JJA and SON is reduced, however a local bias remains during JJA reflecting the regional emission factor applied here. Over India NO2 tropospheric column are re-duced by a factor 4 during the biomass burning season of MAM, better representing
10
GOME columns. During May to July the a posteriori soil NOxemission inventory better
reproduces the NO2column enhancement over the Sahel.
Figure 7 shows seasonal average GOME (left) and GEOS-Chem (middle standard; right original) tropospheric columns of HCHO during 2000. The spatio-temporal cor-relation is quite high with r2=0.7–0.9 compared with 0.6–0.75 respectively versus the
15
original simulation. The mean absolute difference between GOME and the standard simulation is 0.06×10¹⁶molecules cm−2, versus 0.2×10¹⁶molecules cm−2 with
origi-nal simulation. Previous regioorigi-nal differences of more than a factor of 2 are reduced during the biomass burning season to 20% in the standard simulation over Northern Africa in DJF-MAM and to 35% over Central Africa and South America in JJA-SON.
20
The remaining model biases likely reflect isoprene emissions.
4.2.2 Evaluation with in situ data
Figure 8 shows O3 profiles at MOZAIC sites that have the greatest sensitivity to
sur-face emissions. West equatorial (Lagos, Abidjan) and Central Africa (Brazzaville) sites exhibit O3 enhancements related to seasonal biomass burning fires (Fig. 8) driven by
25
ACPD
6, 11465–11520, 2006Tropical tropospheric ozone
B. Sauvage et al.
Title Page
Abstract Introduction
Conclusions References
Tables Figures
◭ ◮
◭ ◮
Back Close
Full Screen / Esc
Printer-friendly Version
Interactive Discussion
EGU
byEdwards et al.(2003) in their analysis of CO retrieval from the MOPITT satellite
in-strument. During DJF, O3enhancements confined to the lower troposphere over West
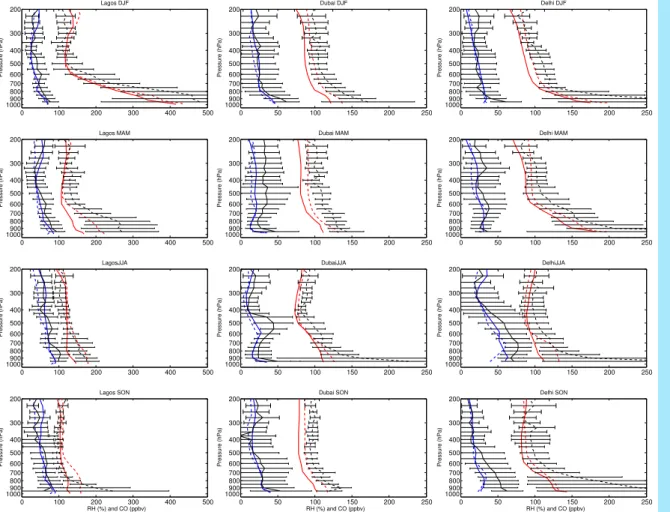
Africa come with the highest tropical CO concentrations measured by the MOZAIC program, with 200–500 ppbv at Lagos below 700 hPa (Fig. 9) and 200–400 ppbv below 500 hPa at Douala (not shown). High CO concentrations originating from biomass
5
burning fires over Central Africa are measured near 600–700 hPa over Lagos and Douala during JJA. Trade winds allow this CO transport and the associated O3 en-hancement (Sauvage et al.,2005). Aghedo et al. (2006) found also high influence of biomass burning on surface O3near 1000 hPa. A persistent CO enhancement that may
reflect local pollution is observed at Delhi, with more than 150 ppbv below 800 hPa. No
10
CO measurements are performed south of the ITCZ.
As a result of the GOME constraints on surface emissions, the simulation better reproduces lower tropospheric O3. During DJF over Lagos and Abidjan, the intensity of
the lower tropospheric O3enhancement is now well reproduced mostly because of the higher NOx emission factors that increase O3by 15–20 ppbv (+45%) compared to the
15
original version. Five ppbv of the 15–20 ppbv increase are attributed to the additional biomass burning VOCs. Moreover, Brazzaville shows an O3enhancement in the lower troposphere through inter-hemispheric transport (+15/20 ppbv (+55%) compared to the original version).
During JJA over Brazzaville the intensity of the O3 maximum is also better
repro-20
duced (+10 ppbv/+14%), as a consequence of both the higher NOx and VOC
emis-sions. These emissions also yield a better reproduction of the O3 enhancement at
Lagos through inter hemispheric transport. The enhancement near 600–700 hPa is also increased by 7 ppbv due to the a posteriori soil NOxemissions.
There are improvements associated with biomass burning emissions over the South
25
America Cerrado in SON, and over India in MAM. O3 decreases in the lower tropo-sphere of Bombay by around 5 to 7 ppbv (8–10%). However O3 is still too high in the
ACPD
6, 11465–11520, 2006Tropical tropospheric ozone
B. Sauvage et al.
Title Page
Abstract Introduction
Conclusions References
Tables Figures
◭ ◮
◭ ◮
Back Close
Full Screen / Esc
Printer-friendly Version
Interactive Discussion
EGU urban areas (Dickerson et al., 2002) not resolved at the coarse resolution of the model.
The top-down emissions also affect the TOC (Table 3). Over the Gulf of Guinea (Lagos) the standard simulation is within 1 DU of MOZAIC versus 6 DU for the original simulation. Over Central Africa the standard simulation is within 2 DU versus MOZAIC during DJF compared to 6 DU in the original simulation. The seasonal cycle is well
5
reproduced, with maximum during JJA and minimum during MAM over Central Africa, maximum during DJF and minimum during JJA over West Africa. Over Windhoek the bias is within 1–2 DU for all the seasons. Over India modeled TOC is within 1–5 DU of MOZAIC during all seasons except JJA, reflecting the lower tropospheric bias.
Comparisons between GOME and GEOS-Chem TOC also show substantial
im-10
provements. Most of the differences between GOME and the standard GEOS-Chem TOC are within 3 DU. The largest differences appear in the northern tropics, with a negative bias of 5 to 8 DU between GOME and GEOS-Chem. Table 3 shows that the GOME TOC underestimate MOZAIC in this region, perhaps reflecting the low sensi-tivity of GOME to lower tropospheric O3, especially in the presence of aerosols from
15
biomass burning or mineral dust. A retrieval of tropospheric O3 using the scan-angle
method better captures lower tropospheric O3(Kim et al.,2005). Instrument sensitivity may also play a role over Central Africa during JJA, when GOME TOC biased by 10 DU compared to MOZAIC at Brazzaville.
4.2.3 Biomass burning emission factors
20
We compare the standard simulation with a sensitivity simulation using a recent com-pilation of biomass burning emission factors (EF) from Andreae (Andreae and Merlet,
2001, personal communication, 2005), that were compiled from in situ measurements. The main differences versus the original simulation are a 23% lower NOx EF for sa-vannas/grassland and a 15% higher NOx EF for tropical forest fires. The new EF
25
for savanna and grassland also feature 100% higher values for HCHO and 200% for alkenes.
ACPD
6, 11465–11520, 2006Tropical tropospheric ozone
B. Sauvage et al.
Title Page
Abstract Introduction
Conclusions References
Tables Figures
◭ ◮
◭ ◮
Back Close
Full Screen / Esc
Printer-friendly Version
Interactive Discussion
EGU factors. The in-situ-based emission factors reduce the original bias versus O3 over
West Africa but still yield insufficient O3in contrast with the top-down emissions. Over
Central and South Africa, in-situ-based emission factors increase O3by 10–15 ppbv in
JJA with respect to the original simulation, 5 ppbv more than the standard simulation. During DJF O3is 20 ppbv higher than the standard simulation. Over India during the
5
biomass burning season, the new emission factors have no effect on the lower tropo-spheric O3 distribution, in contrast with the space-based constraint, which decreases O3 by 5 ppbv yielding a simulation more consistent with results to in situ
measure-ments. The amount of biomass burned may be responsible for the bias in the original simulation as evident from a similar bias in CO (Heald et al.,2003).
10
In summary the recent compilation has similarities with the top-down emissions, but less successfully reproduces O3 observations. We go on to infer regional NOx
and VOC emission factors from the top-down inventory over Africa and the bottom-up estimate of biomass burned. The resulting emission factors for savanna/grassland fires are 2.9 gNO/kg over North Africa, 4.3 gNO/kg over Central/South Africa and
15
3.1 gNO/kg over the South American Cerrado. This leads to 3.4 gNO/kg mean for sa-vanna/grassland, at the upper limit of the recommendation from Andreae (Andreae
and Merlet,2001, Andreae, personal communication, 2005) with 2.3±1.1 gNO/kg. For
tropical forest fires the top-down EF are 2.3 gNO/kg over North Africa, 2.6 gNO/kg over Central/South Africa and 2.0 gNO/kg over South America leading to 2.3 gNO/kg mean
20
versus 1.8±0.7 from Andreae (Andreae and Merlet,2001, Andreae, personal
commu-nication, 2005).
The resulting emission factors for savanna/grassland fires are 0.96 g/kg for alkenes, and 0.7 g/kg for HCHO close to the recommendation by Andreae (Andreae and Merlet,
2001, Andreae, personal communication, 2005) with 1.1±0.6 g/kg and 0.7±0.4 g/kg for 25
ACPD
6, 11465–11520, 2006Tropical tropospheric ozone
B. Sauvage et al.
Title Page
Abstract Introduction
Conclusions References
Tables Figures
◭ ◮
◭ ◮
Back Close
Full Screen / Esc
Printer-friendly Version
Interactive Discussion
EGU 4.2.4 Sensitivity to biogenic emissions
We explore whether the HCHO bias in the original simulation could be related to iso-prene emissions by conducting a sensitivity simulation using the recent Model Emis-sions of Gases and Aerosols from Nature (MEGAN) inventory (Guenther et al.,2006). This inventory yields 600 Tg C/yr of isoprene emissions and has improved the HCHO
5
simulation over the United States (Palmer et al.,2006). However the simulation using MEGAN (not shown) increases HCHO columns over the Amazonian and Equatorial African forest, for all seasons. The general effect is to introduce an overestimate of the tropospheric HCHO columns outside of the wet and biomass burning seasons. More-over the MEGAN inventory generally decreases O3in the lower and middle troposphere
10
by 3–5 ppbv, reducing agreement with in situ O3 data. In summary there is a higher
consistency in the comparison of GOME vs. GEOS-Chem standard simulation than in the comparison of GOME vs. GEOS-Chem simulation using MEGAN, supporting the previous conclusion of an underestimate of biomass burning VOCs in the bottom-up emission inventory.
15
4.3 Sensitivity to heterogeneous chemistry
Here we examine the implications of the heterogeneous chemistry updates described in Sect. 3.2.4, specifically the neglect of HO2uptake on biomass burning aerosols, and
the uptake of HNO3on mineral dust. We also explore the effect of direct O3destruction on mineral dust. This section provides a first overall evaluation of these processes,
20
through comparison with in situ O3measurements over a broad area.
The exclusion of HO2 uptake on biomass burning aerosols in our standard
simula-tion systematically increases modeled O3 over biomass burning regions by 5–7 ppbv, improving the consistency with in situ measurements as shown in Fig. 8. Elsewhere no effect is found over the Tropics.
25
ACPD
6, 11465–11520, 2006Tropical tropospheric ozone
B. Sauvage et al.
Title Page
Abstract Introduction
Conclusions References
Tables Figures
◭ ◮
◭ ◮
Back Close
Full Screen / Esc
Printer-friendly Version
Interactive Discussion
EGU reduces O3 primarily over and downwind of deserts, i.e. northern Africa and South
America, the Arabic peninsula, and India. We find that the reduction in O3 reduces
model biases compared to in situ measurements. There is significant improvement over Dubai and Bombay during March to November, when O3 is reduced by 10–15%. The simulated O3 column maximum over the Middle East is reduced by this process.
5
Over Caracas, there is a 3–5 ppbv (10%) O3decrease below 800 hPa from November
to August, when there is a long range transport from the Sahara. Over Lagos HNO3 uptake reduces O3by a maximum of 5%.
The uptake of HNO3on mineral dust implemented here, using a reaction probability
formulation for convenience, likely represents an upper limit. The particle alkalinity
10
would likely be consumed during continued exposure to HNO3 and H2SO4and would be better represented in an equilibrium partitioning. Aerosol nitrate could photolyze to regenerate NOx(Anastasio and Mc Gregor,2001). Nonetheless, we find observational
evidence in support of the reaction.
We also explored the effect of direct O3 destruction on mineral dust using
15
γ(O3)=10− 5
as recommended from recently laboratory measurements byHanisch and
Crowley (2003). The effect of this reaction on O3is smaller than that of HNO3 uptake as found byBauer et al. (2004). However O3 uptake had a large negative role over
Lagos during DJF in the lower troposphere, leading to a 15–20% reduction of the O3
biomass burning enhancement.
20
In summary, HNO3 uptake on mineral dust and the exclusion of HO2 uptake on
biomass burning aerosols improves the simulation versus MOZAIC and SHADOZ sites. This is not the case for O3uptake, which had no effect over the Middle East and India, and a negative effect over West Africa.
4.4 Sensitivity to dynamics
25
Convective transport has considerable implications for upper tropospheric O3(Lelieveld
ACPD
6, 11465–11520, 2006Tropical tropospheric ozone
B. Sauvage et al.
Title Page
Abstract Introduction
Conclusions References
Tables Figures
◭ ◮
◭ ◮
Back Close
Full Screen / Esc
Printer-friendly Version
Interactive Discussion
EGU at the NASA Global Modeling and Assimilation office provides two different
assimi-lated meteorological datasets, GEOS-3 and GEOS-4, for the year 2000. Three ma-jor differences between the two assimilations are the convective parameterization, the cloud optical depths, and cloud top heights. GEOS-3 uses the Relaxed Arakawa Schu-bert (Moorthi and Suarez,1992) convective parameterization, and GEOS-4 uses the
5
Zhang and Mc Farlane (Zhang and McFarlane,1995) convective parameterization. As discussed by Folkins et al. (2006) the tropical cloud divergence is quite weak at all altitudes with GEOS-3, and is stronger in the upper troposphere with GEOS-4 model. Cloud optical depths are smaller in GEOS-4 than GEOS-3 leading to more active pho-tochemistry (Liu et al.,2006). Cloud top heights are higher in GEOS-3 than GEOS-4
10
(Wu et al.,2006). We compare our standard simulation driven with GEOS-4
meteo-rological fields with one driven with GEOS-3 at the MOZAIC and SHADOZ sites for O3 (Fig. 10); and also for CO and RH (Fig. 9). For clarity Fig. 10 contains sites and
seasons that exhibited a high sensitivity to the dynamical scheme.
As shown in Fig. 10, the main differences in O3 between the standard simulation
15
using 4 and 3 are found in the middle and upper troposphere. GEOS-3 substantially overestimates O3compared to measurements, over all continental and oceanic regions, by 10–25 ppbv (15%–50%) with even higher overestimates over South America, the Middle East, and the Pacific. The main discrepancy above 400 hPa likely reflects an underestimate of convective detrainment which injects O3 depleted air as
20
shown by Folkins et al. (2006) with SHADOZ measurements. As a consequence, RH and CO modeled with GEOS-3 are generally more underestimated compared to MOZAIC at those levels (Fig. 9), than with the GEOS-4 standard simulation. These effects are apparent in a meridional average.
Figure 11 shows a meridional average (5◦W–30◦E), along MOZAIC flight altitudes,
25
200–300 hPa, during the monsoon season (JJA). MOZAIC data depict the ITCZ posi-tion over Africa (0–10◦N) with depleted O3 and enhanced RH and CO. GEOS-3
un-derestimates O3 and overestimates RH in contrast with GEOS-4. However GEOS-4
ACPD
6, 11465–11520, 2006Tropical tropospheric ozone
B. Sauvage et al.
Title Page
Abstract Introduction
Conclusions References
Tables Figures
◭ ◮
◭ ◮
Back Close
Full Screen / Esc
Printer-friendly Version
Interactive Discussion
EGU There are few instances where MOZAIC measurements are more consistent with
GEOS-3 than with GEOS-4. For example during SON over Lagos, Ascension (Fig. 10), and Reunion, upper tropospheric O3measurements are better reproduced with
GEOS-3, than with GEOS-4. This bias at Ascension appears to reflect the low altitude of convective outflow in GEOS-4, as supported by the improvement in the simulation with
5
enhanced intracloud lightning.
The two assimilation schemes also affect trace gases in the lower troposphere at some locations (Fig. 10, Lagos, Ascension, Bombay). The GEOS-3 simulation exhibits lower O3 concentrations than with GEOS-4 and in situ measurements. In contrast
both GEOS-3 and GEOS-4 underestimate lower tropospheric CO at Lagos and Delhi
10
(Fig. 9), but the simulation is within one standard deviation of the measurements and the CO seasonal cycle well reproduced. Both simulations are able to capture the lower tropospheric maximum in CO associated with the biomass burning season, in DJF and MAM over Lagos, and MAM over Delhi. CO is more sensitive than O3 to dynamics in the lower troposphere, reflecting the stronger gradients in CO. In the lower
tropo-15
sphere GEOS-4 CO is lower than GEOS-3, likely reflecting lower cloud optical depth that results in more active chemistry and more active convection that would transport CO from the lower troposphere.
The lower tropospheric CO underestimate with both GEOS-3 and GEOS-4, suggests an underestimate of CO emissions. We examine the possible implications in our O3
20
simulation by increasing CO biomass burning emissions by a factor 2. However the effect on O3is negligible, increasing the O3background by 3 ppbv.
More than a simple overview of two different meteorological datasets, this compari-son clearly shows convection and clouds as major processes driving tropospheric O3.
These processes may be as important as the remaining uncertainties in chemical
pro-25
ACPD
6, 11465–11520, 2006Tropical tropospheric ozone
B. Sauvage et al.
Title Page
Abstract Introduction
Conclusions References
Tables Figures
◭ ◮
◭ ◮
Back Close
Full Screen / Esc
Printer-friendly Version
Interactive Discussion
EGU
5 Conclusions
We used a global chemical transport model (GEOS-Chem) to evaluate the consistency of satellite measurements and to examine the processes affecting tropospheric O3over the Tropics. Space-based observations from the Global Ozone Monitoring Experiment (GOME), Optical Transient Detector (OTD) and Lightning Imaging sensor (LIS)
instru-5
ments are used to constrain the model emissions necessary for an accurate estimation and understanding of processes affecting tropical tropospheric ozone. In-situ measure-ments from the Measuremeasure-ments of ozone and water vapor by in-service Airbus aircraft (MOZAIC) aircraft program and the Southern Hemisphere Additional Ozonesondes (SHADOZ) ozonesonde network, were subsequently used to evaluate the simulation.
10
Our standard simulation featured substantial modifications over the original simu-lation. A climatology of flash counts from the OTD and LIS instruments are used to improve the spatial distribution of lightning NOx emissions in the model. Tropo-spheric NO2and HCHO columns retrieved from GOME are applied to provide top-down
constraints on emission inventories of NOx (biomass burning and soils) and VOCs
15
(biomass burning). We remove HO2 uptake on biomass burning aerosols, and imple-ment HNO3uptake on mineral dust.
Upper tropospheric O3 is highly sensitive to the spatial distribution of lightning NOx
emissions. The lightning rescaling improves the simulation of middle and upper tropo-spheric O3 for tropical sites, by 5–15 ppbv (10%–45%) versus in situ measurements
20
from SHADOZ and MOZAIC. Biases in the simulation of tropospheric ozone columns are reduced by 1–6 DU versus GOME, MOZAIC and SHADOZ measurements. We evaluate lightning emissions in terms of intensity, by testing ±2 Tg N/yr around the
5 Tg N/yr used in the standard simulation; and in term of distribution by increasing the NOx emitted from intracloud lightning. A lightning source strength of 5±2 Tg N/yr 25
ACPD
6, 11465–11520, 2006Tropical tropospheric ozone
B. Sauvage et al.
Title Page
Abstract Introduction
Conclusions References
Tables Figures
◭ ◮
◭ ◮
Back Close
Full Screen / Esc
Printer-friendly Version
Interactive Discussion
EGU substantial improvements are found at Ascension and Reunion during SON. A global
mean increase in intra-cloud lightning NOxis not supported by in situ O3profiles.
Prog-nostic determination of the IC/CG ratio could yield an improved simulation of tropical ozone.
The top-down constraints on NOx emissions inferred from GOME NO2 columns
in-5
crease biomass burning emissions, by a factor of 1.1 over Central Africa and by a factor of 2.6 over North Africa. The NOx emission factor inferred from GOME NO2columns over savanna/grassland is 3.4 gNO/kg dm, 40% higher than the recommendation by Andreae (Andreae and Merlet, 2001, personal communication, 2005) but within the given range. The GOME HCHO columns provide a measure of reactive VOC
emis-10
sions. An increase in HCHO and alkenes emissions by a factor of 2 over biomass burning regions is necessary to reproduce GOME observations of HCHO columns. The top-down emissions increase the simulation of lower tropospheric ozone by 5– 20 ppbv, improving the simulation versus MOZAIC in situ measurements, mainly over Africa where O3is most sensitive to surface sources. The improvement in simulated O3
15
provides an indirect validation of the retrieved tropospheric NO2and HCHO columns.
The modeled TOC are within 1–3 DU of GOME, and within 1–4 DU compared to in situ measurements. The seasonal variations are well reproduced.
We evaluate the biogenic a posteriori NOx emission inventory (Jaegl ´e et al.,2005)
versus in situ O3 measurements. The largest influence appears over Africa and
ad-20
jacent regions in MAM/JJA, with O3 increasing by 5–7 ppbv , and reducing a regional
model bias.
We drive GEOS-Chem with two different assimilation schemes, 3 and GEOS-4, that feature different convective parameterizations and cloud fields. The two different dynamical schemes have considerable effect on the ozone simulation. GEOS-4 better
25
represents O3observations by 5–20 ppbv due to enhanced convective detrainment in the upper troposphere, compared to GEOS-3 which overestimates O3. The role of
enhanced convective outflow is particularly apparent in relative humidity and O3in the
ACPD
6, 11465–11520, 2006Tropical tropospheric ozone
B. Sauvage et al.
Title Page
Abstract Introduction
Conclusions References
Tables Figures
◭ ◮
◭ ◮
Back Close
Full Screen / Esc
Printer-friendly Version
Interactive Discussion
EGU carbon monoxide in the lower troposphere, and observations are better reproduced
with GEOS-3 which has higher cloud optical depths.
Recent laboratory and field measurements provide evidence for uptake of HNO3
(γHNO3=0.1) on mineral dust, and the absence of HO2 uptake on biomass burning
aerosols. We evaluate those processes with in situ measurements of O3. HNO3uptake
5
reduces a regional model bias by 5–15% downwind of deserts. The neglect of HO2
uptake on biomass burning aerosols increases simulated O3 by 5 ppbv, improving our
simulations versus in situ measurements in biomass burning regions. Direct uptake of O3 (γO3=10−
5
) on mineral dust introduces a large model bias compared to MOZAIC O3measurements over West Africa.
10
We have shown that satellite observations of lightning and O3 precursors improve substantially the simulation of tropical tropospheric O3 with a global chemical
trans-port model due to better representation of emissions. The most prominent outstanding issues are related to lightning and convection. Future development of a prognostic parameterization of lightning that reproduces observed flash counts, should improve
15
the accuracy of O3simulations. In-situ measurements of trace gases in close
proxim-ity to deep convection in the Tropics would enable disentangling of issues related to lightning vertical profile and convective transport. Forthcoming high resolution space-based data, such as from Aura (Schoeberl et al., 2004), or GOME-2 and IASI should continue to provide additional insight into tropical tropospheric ozone.
20
Acknowledgements. The authors acknowledge MOZAIC funding agencies, the European Commission, CNRS (France), Forschungszentrum J ¨ulich (Germany), M ´et ´eo France, EADS (Airbus) and the airlines (Air France, Lufthansa, Austrian Airlines, and former Sabena who carry free of charge the MOZAIC equipment and perform the maintenance). We also acknowledge the European Agency, ESA/ERIN. SHADOZ is supported by NASA’s Atmospheric Chemistry
25
ACPD
6, 11465–11520, 2006Tropical tropospheric ozone
B. Sauvage et al.
Title Page
Abstract Introduction
Conclusions References
Tables Figures
◭ ◮
◭ ◮
Back Close
Full Screen / Esc
Printer-friendly Version
Interactive Discussion
EGU
References
Aghebo, A. M., Schultz, M. G., and Rast, S.: The influence of African air pollution on regional and global tropospheric chemistry, Atmos. Chem. Phys. Discuss., 6, 5797–5838, 2006. Alexander, B. J., Park, R. J., Jacob, D. J., Li, Q. B., Yantosca, R. M., Savarino, J., Lee, C. C.
W., and Thiemens, M. H.: Sulfate formation in sea-salt aerosols: Constraints from oxygen
5
isotopes, J. Geophys. Res., 110, D10307, doi:10.1029/2004JD005659, 2005.
Anastasio, C. and McGregor, K. G.: Chemistry of fog waters in California’s Central Valley: 1. In situ photoformation of hydroxyl radical and singlet molecular oxygen, Atm. Env., 35(6), 1079–1089, 2001. 11488
Andreae, M. O.: The influence of tropical biomass burning on climate and the atmospheric
10
environment, in: Biogeochemistry of Global Change: Radiatively Active Trace Gases, edited by: Oremland, R. S., 113–150, Chapman and Hall, New York, 1993.11467
Andreae, M. O. and Merlet, P.: Emission of trace gases and aerosols from biomass burning, Global Biogeochem. Cycles, 15(4), 955–966, doi:10.1029/2000GB001382, 2001. 11485,
11486,11492
15
Andreae, M. O., Artaxo, P., Fischer, H., et al.: Transport of biomass burning smoke to the upper troposphere by deep convection in the equatorial region, Geophys. Res. Lett., 28(6), 951–954, 2001.
Andreae, M. O., Rosenfeld, D., Artaxo, P., Costa, A. A., Frank, G. P., Longo, K. M., and Silva-Dias, M. A. F.: Smoking Rain Clouds over the Amazon, Science, 303, 1337–1342, 2004.
20
Burrows, J. P., Weber, M., Buchwitz, M., et al.: The Global Ozone Monitoring Experiment (GOME): Mission concept and first scientific results, J. Atmos. Sci., 56, 151–175, 1999.
11470
Bauer, S. E., Balkanski, Y., Schulz, M., Hauglustaine, D. A., and Dentener, F.: Global modeling of heterogeneous chemistry on mineral aerosol surfaces: Influence on
tropo-25
spheric ozone chemistry and comparison to observations, J. Geophys. Res., 109, D02304, doi:10.1029/2003JD003868, 2004. 11477,11487,11488
Bertram, T. H., Heckel, A., Richter, A., Burrows, J., and Cohen, R. C.: Satellite mea-surements of daily variations in soil NOx emissions, Geophys. Res. Lett., 32, L24812, doi:10.1029/2005GL024640, 2005.
30