www.hydrol-earth-syst-sci.net/16/2883/2012/ doi:10.5194/hess-16-2883-2012
© Author(s) 2012. CC Attribution 3.0 License.
Earth System
Sciences
Soil moisture and evapotranspiration of different land cover types in
the Loess Plateau, China
S. Wang, B. J. Fu, G. Y. Gao, X. L. Yao, and J. Zhou
State Key Laboratory of Urban and Regional Ecology, Research Center for Eco-Environmental Sciences, Chinese Academy of Sciences, P.O. Box 2871, Beijing 100085, P. R. China
Correspondence to:B. J. Fu (bfu@rcees.ac.cn)
Received: 26 March 2012 – Published in Hydrol. Earth Syst. Sci. Discuss.: 4 May 2012 Revised: 4 August 2012 – Accepted: 7 August 2012 – Published: 22 August 2012
Abstract. We studied the impacts of re-vegetation on soil moisture dynamics and evapotranspiration (ET) of five land cover types in the Loess Plateau in northern China. Soil mois-ture and temperamois-ture variations under grass (Andropogon), subshrub (Artemisia scoparia), shrub (Spiraea pubescens), plantation forest (Robinia pseudoacacia), and crop (Zea mays) vegetation were continuously monitored during the growing season of 2011. There were more than 10 soil mois-ture pulses during the period of data collection. Surface soil moisture of all of the land cover types showed an increas-ing trend in the rainy season. Soil moisture under the corn crop was consistently higher than the other surfaces. Grass and subshrubs showed an intermediate moisture level. Grass had slightly higher readings than those of subshrub most of the time. Shrubs and plantation forests were characterized by lower soil moisture readings, with the shrub levels con-sistently being slightly higher than those of the forests. De-spite the greater post-rainfall loss of moisture under subshrub and grass vegetation than forests and shrubs, subshrub and grass sites exhibit a higher soil moisture content due to their greater soil retention capacity in the dry period. The daily ET trends of the forests and shrub sites were similar and were more stable than those of the other types. Soils under sub-shrubs acquired and retained soil moisture resources more efficiently than the other cover types, with a competitive ad-vantage in the long term, representing an adaptive vegetation type in the study watershed. The interactions between vege-tation and soil moisture dynamics contribute to structure and function of the ecosystems studied.
1 Introduction
In arid and semi-arid regions, water represents the main eco-logical constraint for plant survival, and hydroeco-logical pro-cesses determine the direction of evolution and ecological functioning of soil-vegetation systems (Li, 2011). There-fore, understanding the relationship and coupling mecha-nisms among soil, water and vegetation interactions can help to understand the land surface development processes and biogeochemical balances in the dry lands.
Soil moisture dynamics are the central component of the hydrological cycle (Legates et al., 2011) and are mainly determined by processes including infiltration, percola-tion, evaporation and root water uptake. Obtaining accu-rate estimates of root water uptake and vegetation wa-ter use represents the weakest link in producing soil-vegetation-atmosphere transfer (SVAT) models (Schymanski al., 2008a). Optimality-based models have experienced rapid development in recent years and have shown strong predic-tive power, leading to the hypothesis that vegetation has de-veloped optimal water use strategies through co-evolution with natural conditions, including reducing water losses pas-sively and increasing water absorption capacities actively (Cowan and Farquhar, 1977; Schymanski, 2008). Schyman-ski et al. (2007, 2008a, b, c) successfully reproduced the sur-face soil moisture dynamics using an optimality-based model and further tested it in catchments with natural vegetation in Europe. These model results show that the natural vegetation has adapted its water use strategies to local conditions.
northwestern continental dry climate. Almost all of the nat-ural vegetation on the Loess Plateau has been replaced for cultivation as farmland in the last century. In the past three decades, to control soil erosion, a series of large reforesta-tion campaigns was initiated, such as the Grain-for-Green project, which began in 1999. Indeed, approximately 24 % of the area of erosion has been controlled, and vegetation cover-age increased from 6.5 % in the 1970s to 51 % in 2010 on the Loess Plateau (National Development and Reform Commis-sion, 2010). Most of the farmlands cultivated on slopes were planted with forests and shrubs, and some farmlands were abandoned as grass and subshrub communities dominate (Su et al., 2011).
However, concerns have been raised regarding the eco-hydrological effects of these artificial forests and shrubs that have induced unwanted environmental problems. Large-scale vegetation restoration has also aggravated water scarcity, gradually leading to soil desiccation (Shangguan and Zheng, 2006; Chen et al., 2008a). Low forest produc-tivity and growth efficiency resulted in “small aged trees” with heights of 3–5 m, a common scene in the region (Chen et al., 2008b). Vegetation-soil moisture feedback may lead to pattern formation (D’Odorico et al., 2007; Fu et al., 2011). Thus, understanding the interactions between these artificial vegetation types and soil moisture is urgently required as ba-sis for adjusting land use structures and ensuring sustainable provisions of desired ecosystem services in this area.
The ecohydrological effects of vegetation restoration in the Loess Plateau area have been reported (Gong et al., 2006; Li and Shao, 2006; Sun et al., 2006; Chen et al., 2007a, 2010; Chen et al., 2008a, b). Many investigators have paid a great deal of attention to soil desiccation resulting from the exces-sive depletion of deep soil water by artificial vegetation and long-term insufficient rainwater supplies (Li, 1983; Yang, 1996; Yang et al., 1998; Li and Shao, 2001; Mu et al., 2003; Fan et al., 2004; Yang and Tian, 2004). Chen et al. (2007a) measured the soil moisture, runoff and soil erosion in plots of five vegetation types and found that soil water was lost during the rainy season and was not fully replenished from rainfall in a shrubland and a semi-natural grassland with moderate– high moisture contents. The xylem sap flow in three species of trees was monitored in the field by Du et al. (2011), who found that the species vary in water use strategies, not only between exotic and native species, but also between the two native species. The number of studies on soil moisture spa-tial variability and temporal stability in the Loess Plateau continues to increase (Hu et al., 2009; Gao et al., 2011). These studies illustrated the water patterns for different veg-etation species. However, the dynamics of soil moisture pro-cesses under different vegetation cover types are not clear, especially regarding the differences of soil moisture deple-tion and its vertical distribudeple-tion. The main aim of this study is therefore to understand the soil moisture and water loss patterns under different land covers by continuously moni-toring soil moisture fluxes of grass (Andropogon), subshrubs
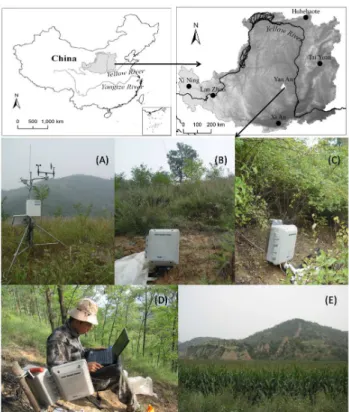
Fig. 1.Location of the study area and the typical land cover types: grass(A), subshrub(B), shrub(C), plantation forest(D)and crop
(E)site.
(Artemisia scoparia), shrubs (Spiraea pubescens), plantation forest (Robinia pseudoacacia), and crops (Zea mays) during and after rainfall events.
2 Study area
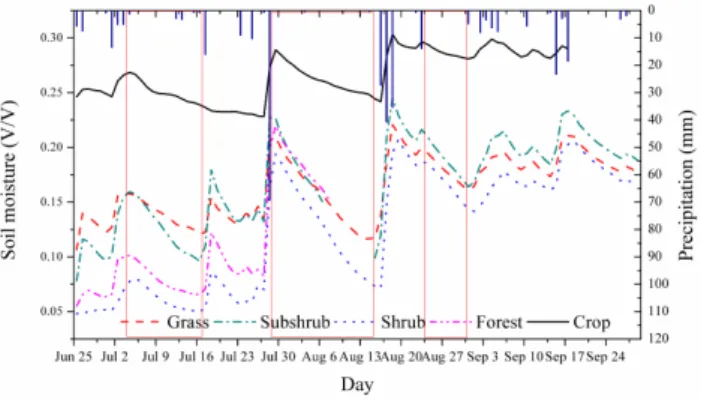
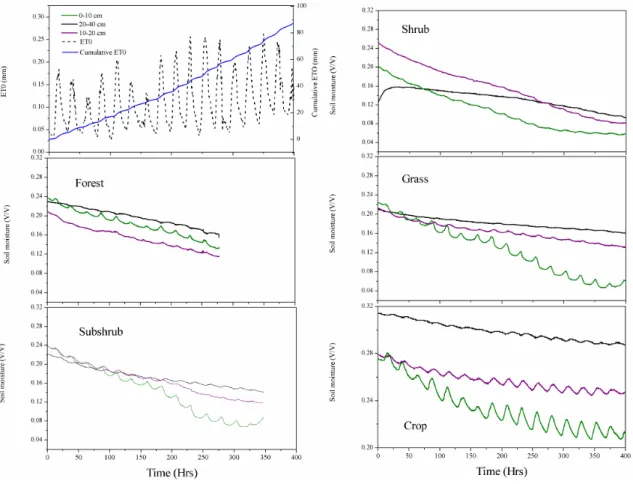
Fig. 2.Dynamics of the mean soil moisture and precipitation pro-files and the three selected typical decreasing moisture periods.
inter-annual variations, and spring and early summer are usu-ally characterized as a dry season. The growing season for the common deciduous tree species ranges from April to Octo-ber in this region. The soil in the study area is mainly derived from loess, with a depth of 50–200 m depending on topog-raphy. The loess in this area usually exhibits a texture con-sisting of more than 50 % silt (0.002–0.05 mm) and less than 20 % clay (<0.002 mm), with a porosity of approximately 50 %. The gravimetric field capacity and wilting percentage of the soil water in the region are 20–24 % and 3–6 %, re-spectively (Du et al., 2011).
The forest site was dominated by Acacia (Robinia pseu-doacacia) with a tree height of approximately 5.5 m; the distance between rows was 2.5 or 3 m. The shrub site was densely covered with Spiraea pubescens with a height of approximately 1.5 m and a sparse layer of planted acacia. The subshrub site was covered withArtemisia scopariawith a height of approximately 0.45 m imbedded with tussock and bare areas. The grass site was covered with Andro-pogon beard grass with a height of approximately 0.40 m with imbedded bare areas. The crop site was situated on dam land at the bottom of the valley and was cultivated with corn (Zea mays) with a height of approximately 2.20 m (Table 1). The grasses and subshrubs grew under conditions of natural succession. The slope gradients of the sites were approxi-mately 22◦, with only slight differences, except for the crop site.
3 Materials and methods
3.1 Field installation
A total of 12 soil moisture and temperature smart sensors in every site were installed at 6 depths below the ground at 10, 20, 40, 60, 80 and 100 cm. To install the probes, a pit was dug in the soil with a sufficient width to allow their insertion. The probes were inserted into the soil through the unaltered side of the pit and were positioned horizontally in the direction of the maximum slope of the terrain. Once the probes had
Fig. 3.Dynamics of the mean soil and air temperature during the study period.
been inserted, the pit was carefully refilled, avoiding pertur-bations as much as possible, and the surface was contoured in a manner similar to the surrounding slope. The site was set up at the end of April 2011, and measurements were not begun until 2 months later, when the soil settled.
3.2 Measurement sensor
H21 Soil moisture & Temp Logger Systems with S-SMC-M005 soil moisture probes and S-TMB-M006 soil tempera-ture probes (Decagon Devices Inc., Pullman, WA) were in-stalled to measure the soil profile moisture and temperature. The S-SMC-M005 soil moisture sensor is capable of mea-suring volumetric saturations between 0 % and 100 % with an accuracy of±1.0 %, and data were collected by HOBO weather station logger every 10 min. Rainfall was measured using a tipping bucket rain gauge, which was connected to a data logger with a precision of 0.2 mm. Concurrently, other meteorological parameters, such as the air temperature, rela-tive humidity, wind velocity and potential evapotranspiration (ET0), were recorded at a height of 2 m above the ground every 30 min.
3.3 Data analysis
We assumed that the volumetric soil water content was ac-curately measured with probes matching the different depths in the soil profiles. Based on the soil water balance princi-ple, the cumulative loss water can therefore be described as follows:
L=(Si−Se)×Zf (1)
where Si is the initial volumetric soil water content (cm3cm−3); Se is the volumetric soil water content (cm3cm−3)at the end stage;Zf is the measure depth (cm);
andLis the cumulative loss water (mm).
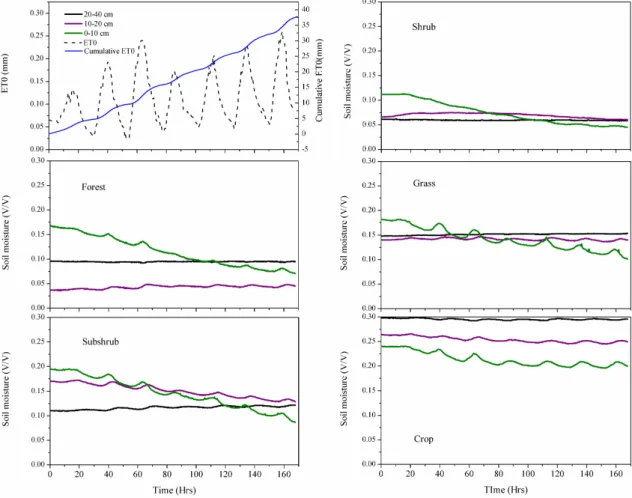
Fig. 4.Soil moisture decrease process under the five land cover types from 6 July to 12 July.
Table 1.Main characteristics for different land cover types.
Soil (0–1 m) and
Forest Shrub Subshrub Grass Crop
vegetation properties
Clay (%) 2.9a/0.2b 3.2/0.4 3.4/0.4 2.6/0.3 3.4/0.2
Silt (%) 59.3/2.6 57.08/3.9 59.0/4.9 55.1/4.1 56.9/3.1
Sand (%) 37.7/2.7 39.70/4.1 37.6/5.2 42.2/4.4 39.6/3.2
Bulk density (g cm−3) 1.3/0.1 1.22/0.1 1.2/0.1 1.2/0.1 1.4/0.1
Height (m) 5.5 1.5 0.45 0.4 2.2
Cover (%) 40 90 75 80 90
aMean value.bStandard error.
performed, after verifying the assumptions of normality and homogeneity of variances, to test the effects of land cover types on soil moisture. Multiple comparisons were made us-ing the least significant difference (LSD) method.
4 Results
4.1 Soil moisture pulse
Over the entire duration of the study, from June to Septem-ber, there was no obvious variability in the sensor readings
obtained at the 80 and 100 cm depths, and the average of the other four sensor readings under each land cover type was therefore used. Based on the responses of the moisture probes to rainfall events, there were more than 10 moisture pulses during the period of data collection (Fig. 2). In all of the rainfall episodes, a similar parallel, but different trend in moisture retention and reduction is noticeable between the five investigated land cover types. Typically, the variability in soil moisture readings was correlated with the amount of pre-cipitation received. The highest soil moisture content peak was experienced on 20 August due to three major rainfall events in the three preceding days. Throughout the observa-tion period, the surface soil moisture showed an increasing trend.
4.2 Comparison of soil moisture and temperature in
different land cover types
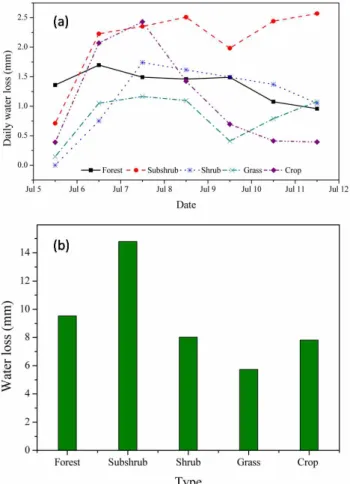
Fig. 5.Daily soil water loss(a)and cumulative water loss(b)under the five land cover types from 6 July to 12 July.
until 16 September (p=0.26), significantly different from others (p <0.01). The shrub (Spiraea pubescens) and plan-tation forest (Robinia pseudoacacia) sites presented lower soil moisture readings, with the shrub values being slightly higher than those of the forest site consistently (p=0.01), and significantly different from others (p <0.01) (Table 2). With exception of the corn land cover type, the average soil temperature was clearly affected by the growth of fo-liage. The average soil temperature exhibits approximately the same regime as the average moisture content among the other four cover types. The temporal trend of the average soil temperature contrasted with the moisture trend; they are significantly negative correlated for all these five types (p <0.01), and show a downward trend throughout the ob-servation period (Fig. 3).
4.3 Pattern of soil moisture decreases
Three typical decreasing moisture periods were chosen to compare the differences in the water loss rate between the five land cover types and their vertical distribution.
In the period of relatively lower soil moisture contents, from 6 July to 12 July, the initial average soil moisture
content was 0.15 cm3cm−3. The subshrub site lost the great-est amount of water of up to 15 mm over these 7 days, which was mainly contributed by the 0–10 cm and 10–20 cm layers. Additionally, the daily water loss was higher for subshrub than for the other cover types, ranging from 0.7 to 2.6 mm. The lowest total water loss value over this 7-day period of only 6 mm was observed for grass cover, which showed a daily water loss trend that was similar to but lower than that of subshrub, ranging from 0.15 to 1.09 mm. The daily wa-ter loss for corn was the most variable, ranging from 0.38 to 2.43 mm, and the cumulative water loss for this cover type was 7.8 mm. Plantation forest and shrub showed an interme-diate level, with the value for the forest site being slightly higher than that of shrub. These last two sites showed cumu-lative water losses of 9.5 and 7.2 mm, respectively, and their daily water loss trends were similar and more stable com-pared to the other cover types. The water losses of these four cover types were mainly contributed by the 0–10 cm layer in this period (Figs. 4 and 5).
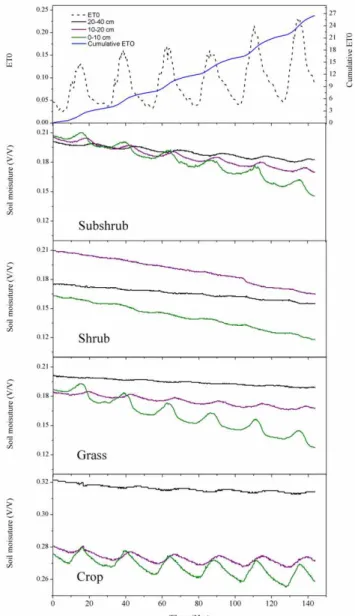
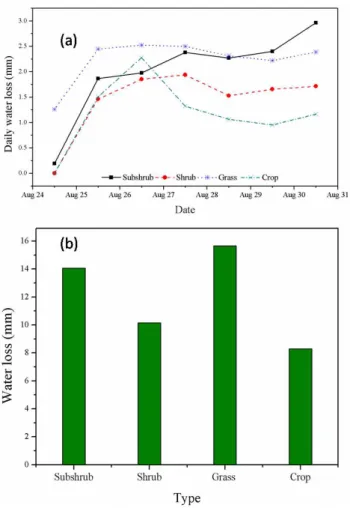
In the periods of relatively higher soil moisture content, from 31 July to 15 August (Figs. 6 and 7) and 25 August to 31 August (Figs. 8 and 9), the initial average soil moisture content for all was 0.22 cm3cm−3. The data for the forest site were missing for 9 August, and those of the shrub site were missing from 8 to 15 August. During these two periods, the average daily water losses for subshrub and grass were 2.3 and 2.2 mm, respectively. Corn showed the lowest average daily water loss of 1 mm. The forest and shrub sites presented an intermediate level, exhibiting average daily water losses of 1.7 and 1.8 mm, respectively. All three layers contributed to the water loss among the five cover types.
5 Discussion
5.1 Soil moisture dynamics
Fig. 6.Soil moisture decrease process under the five land cover types from 31 July to 15 August.
Table 2.The comparisons of average soil moisture between the five land cover types.
Average soil
Grass Subshrub Shrub Forest Crop moisture (cm3cm−3)
Grass 0.181 0
Subshrub 0.173 0.008 (0.262) 0
Shrub 0.111 0.070 (0.000)a 0.062 (0.000)a 0
Forest 0.096 0.084 (0.000)a 0.077 (0.000)a 0.015 (0.012)b 0
Crop 0.252 −0.071 (0.000)a −0.078 (0.000)a −0.141 (0.000)a −0.155 (0.000)a 0
The significance is within the brackets.arepresents significant correlation at level of 0.01.brepresents significant correlation at level of 0.05.
usually cannot be separated (Wang et al., 2012). A large frac-tion of the soil moisture in the surface layer is lost through direct evaporation due to high temperatures and low root den-sities, while the rates of plant water uptake increase, and evaporation and vapor diffusion rates decrease in deeper soil (Schwinning and Sala, 2004). Thus, the larger the rainfall event is, the deeper the associated pulse depth and the larger the fraction of precipitation leaving the soil via transpiration and contributing to the primary productivity of higher plants. The loss of soil moisture through the transpiration of higher plants, especially the woody plants with deeper root, is more stable than the evaporation from soil due to their constant
Fig. 7.Daily soil water loss(a)from 31 July to 15 August and cu-mulative water loss(b)under the five land cover types from 31 July to 7 August.
subshrubs led to a higher moisture loss rate, whereas grass cannot maintain this high rate for as long a period due to the smaller amount of water acquired. The initial soil moisture content of the subshrub and grass sites was higher than that of forest and shrub, and the moisture loss rates for subshrub and grass were also higher than those of the forest and shrub sites in this short wet period, leading to the gap between them becoming smaller. The corn site, situated on check dam land in the bottom of the valley, received more water flow from hillslope, and the valley areas had lower temperature, result-ing in their higher and more stable soil moisture content.
5.2 Soil temperature and water loss
Temperature is one of the main factors causing the loss of soil moisture under conditions of high moisture content, which is also influenced by leaf area index (LAI) and factors. In the wet period after a rainfall event, soil moisture loss is controlled by atmospheric demand or energy (S. Wang et al., 2011). The corn site, which was located on dam land, differed from the other cover types because of its terrain and soil properties. Among the other four types, subshrub
Fig. 8. Soil moisture decrease process under the five land cover types from 25 August to 31 August.
Fig. 9.Daily soil water loss(a)and cumulative water loss(b)under the five land cover types from 25 August to 31 August.
in wetter patches experiencing more rapid soil moisture loss than other surfaces. Although the plantation forest and shrub vegetation consumed more water in the growing season, as the growing season and the rainy season coincide, the con-sumed water was supplemented during this period. The soil moisture gap occurred in the dry season when the soil mois-ture loss was mainly controlled by the capacity of plants to absorb water from the soil (S. Wang et al., 2011). Forest and shrub vegetation can maintain high and stable transpi-ration during the dry season, whereas subshrubs and grass are smaller, which with other factors contributed to the dif-ferences in the soil moisture content between them.
5.3 Implications for re-vegetation
The most important lesson regarding water and soil conser-vation in the Loess Plateau area of China is that “precip-itation should be impeded to allow it to infiltrate locally” (Chen et al., 2007b) to reduce surface runoff and enhance in-filtration. Following implementation of the Grain-for-Green project for more than 10 yr, most of the cultivated lands on the slope were planted with artificial forests and shrubs,
though grasses, in some cases succeeding to subshrubs, were also grown on some of the abandoned cultivated lands. The effects of this re-vegetation regarding impeding surface flows are obvious, with runoff being reduced and the goal of soil and water conservation achieved. Unfortunately, because the amount of rainfall interception associated with forest and shrub vegetation is greater than crops, the high ET results in higher soil bulk density and the soil becomes firmer with lower infiltration capacity. Thus, the amount and depth of infiltration associated with plantation forest are lower than for grass soils. The higher evapotranspiration capacity asso-ciated with plantation forest and shrub vegetation results in a lower soil moisture content and even a drier layer (Chen et al., 2010). Sparely distributed subshrubs acquire and re-tain soil moisture resources more efficiently than plantations and dense shrub vegetation. This is due to the efficient im-pediment effects and medial root water uptake capacity of subshrub vegetation, which also gathered and maintained a high clay content. Hillslope plot experiments suggest that grass cover yields more runoff (Liu et al., 2011), leading to more sand and lower clay content. However, the grass site could retain more moisture due to its shallow root distribu-tion and lower water uptake capacity. The amount of water loss of grass is determined by the initial moisture content, so grass cover will develop into subshrubs, as the subshrubs have a competitive advantage on the long term. More than 100 000 check dams have been built over the last 50 yr in the Loess Plateau, which store 21 billion m3sediments, and 3200 km2of dam croplands have been created, and the car-bon storage in check dams of the Loess Plateau can amount to 0.952 Gt (Y. F. Wang et al., 2011). However, dam lands exhibit a higher moisture content but a low permeability and a potential for salinization as well as higher bulk density and a clay layer in deep soils.
6 Conclusions
for more than 20 yr. The runoff and run-on patches associated with this vegetation type acquire and retain soil moisture re-sources more efficiently than other cover types. Thus, sub-shrubs represent an adaptive vegetation type in this area.
Acknowledgements. This work was funded by the State Forestry Administration (No. 201004058), National Basic Research Pro-gramme of China (2009CB421104), the National Natural Science Foundation of China (Nos. 40930528 and 41101096) and State Key Laboratory of Soil Erosion and Dryland Farming on the Loess Plateau. We thank Prof. Ge Sun and three anonymous reviewers for their constructive comments which improved the overall quality of the manuscript.
Edited by: G. Sun
References
Chen, H. S., Shao, M. A., and Li, Y. Y.: Soil desiccation in the Loess Plateau of China, Geoderma, 143, 91–100, 2008a.
Chen, H. S., Shao, M. A., and Li, Y. Y.: The characteristics of soil water cycle and water balance on steep grassland under natural and simulated rainfall conditions in the Loess Plateau of China, J. Hydrol., 360, 242–251, 2008b.
Chen, L. D., Huang, Z. L., Gong, J., Fu, B. J., and Huang, Y. L.: The effect of land cover/vegetation on soil water dynamic in the hilly area of the loess plateau, China, Catena, 70, 200–208, 2007a. Chen, L. D., Wei, W., Fu, B. J., and L¨u, Y. H.: Soil and water
con-servation on the Loess Plateau in China: review and perspective, Prog. Phys. Geog., 31, 389–403, 2007b.
Chen, L. D., Wang, J. P., Wei, W., Fu, B. J., and Wu, D. P.: Effects of landscape restoration on soil water storage and water use in the Loess Plateau Region, China, Forest Ecol. Manag., 259, 1291– 1298, 2010.
Cowan, I. R. and Farquhar, G. D.: Stomatal Function in Relation to Leaf Metabolism and Environment, in: Integration of activity in the higher plant, edited by: Jennings, D. H., 471–505, Cambridge University Press, Cambridge, 1977.
De Lannoy, G., Verhoest, N. E. C., Houser, P. R., Gish, T. J., and Van Meirvenne, M.: Spatial and temporal characteristics of soil moisture in an intensively monitored agricultural field (OPE319), J. Hydrol., 331, 719–730, 2006.
D’Odorico, P., Caylor, K., Okin, G. S., and Scanlon, T. M.: On soil moisture-vegetation feedbacks and their possible effects on the dynamics of dryland ecosystems, J. Geophys. Res., 112, G04010, doi:10.1029/2006JG000379, 2007.
Du, S., Wang, Y. L., Kume, T., Zhang, J. G., Otsuki, K., Yamanaka, N., and Liu, G. B.: Sapflow characteristics and climatic responses in three forest species in the semiarid Loess Plateau region of China, Agr. Forest Meteorol., 151, 1–10, 2011.
Fan, J., Hao, M. D, and Shao, M. A.: Water consumption of deep soil layers and eco-environmental effects of agricultural ecosys-tem in the Loess Plateau, Transactions of the CSAE, 20, 61–64, 2004 (in Chinese with English abstract).
Fu, B. J., Liang, D., and L¨u, N.: Landscape ecology: Coupling of pattern, process, and scale, Chinese Geogra. Sci., 21, 385–391, 2011.
Gao, X. D., Wu, P. T., Zhao, X. N., Shi, Y. G., Wang, J. W., and Zhang, B. Q.: Soil moisture variability along transects over a well-developed gully in the Loess Plateau, China, Catena, 87, 357–367, 2011.
Gong, J., Chen, L. D., Fu, B. J., Huang, Y. L., Huang, Z. L., and Peng, H. J.: Effect of land use on soil nutrients in the loess hilly area of the Loess Plateau, China, Land Degrad. Dev., 17, 453– 465, 2006.
Hu, W., Shao, M. A., Wang, Q. J., and Reichardt, K.: Time stability of soil water storage measured by neutron probe and the effects of calibration procedures in a small watershed, Catena, 79, 72– 82, 2009.
Legates, D. R., Mahmood, R., Levia, D. F., DeLiberty, T. D., Quir-ing, S., Houser, C., and Nelson, F. E.: Soil Moisture: A central and unifying theme in physical geography, Prog. Phys. Geog., 35, 65–86, 2011.
Li, X. Y.: Mechanism of coupling, response and adaptation between soil, vegetation and hydrology in arid and semiarid regions, Sci. Sin. Terrae., 41, 1721–1730, 2011 (in Chinese).
Li, Y. S.: The properties of water cycle in soil and their effect on water cycle for land in the Loess Plateau, Acta Ecologica Sinica, 3, 91–101, 1983 (in Chinese with English abstract).
Li, Y. Y. and Shao, M. A.: Climatic change, vegetation evolution and low moisture layer of soil on the Loess Plateau, J. Arid Land Resour. Environ., 15, 72–77, 2001 (in Chinese with English ab-stract).
Li, Y. Y. and Shao, M. A.: Change of soil physical properties under long-term natural vegetation restoration in the Loess Plateau of China, J. Arid Environ., 64, 77–96, 2006.
Liu, Y., Fu, B. J., L¨u, Y. H., Wang, Z., and Gao, G. Y.: Hydrological responses and soil erosion potential of abandoned cropland in the Loess Plateau, China, Geomorphology, 138, 404–414, 2011. Mu, X. M., Xu, X. X., Wang, W. L., Wen, Z. M., and Du, F.: Impact
of artificial forest on soil moisture of the deep soil layer on Loess Plateau, Acta Pedol. Sin., 40, 210–217, 2003 (in Chinese with English abstract).
National Development and Reform Commission: Comprehensive management planning framework for Loess Plateau area (2010– 2030), 69 pp., 2010 (in Chinese).
Odindi, J. O. and Kakembo, V.: The hydrological response of Pteroniaincana-invaded areas in the Eastern Cape Province, South Africa, Ecohydrology, 4, 832–840, 2011.
Schwinning, S. and Sala, O. E.: Hierarchy of responses to resource pulses in arid and semi-arid ecosystems, Oecologia, 141, 211– 220, 2004.
Schymanski, S. J.: Optimality as a Concept to Understand and Model Vegetation at Different Scales, Geography Compass, 5, 1580–1598, 2008.
Schymanski, S. J., Roderick, M. L., Sivapalan, M., Hutley, L. B., and Beringer, J.: A test of the optimality approach to modelling canopy properties and CO2uptake by natural vegetation, Plant Cell Environ., 30, 1586–1598, 2007.
Schymanski, S. J., Sivapalan, M., Roderick, M. L., Beringer, J., and Hutley, L. B.: An optimality-based model of the coupled soil moisture and root dynamics, Hydrol. Earth Syst. Sci., 12, 913– 932, doi:10.5194/hess-12-913-2008, 2008a.
Resour. Res., 45, W01412, doi:10.1029/2008WR006841, 2008b. Schymanski, S. J., Sivapalan, M., Roderick, M. L., Beringer, J., and Hutley, L. B.: A canopy scale test of the optimal water use hy-pothesis. Plant Cell Environ., 31, 97–111, 2008c.
Shangguan, Z. P. and Zheng, S. X.: Ecological properties of soil water and effects on forest vegetation in the Loess Plateau, Int. J. Sust. Dev. World., 13, 307–314, 2006.
Su, C. H., Fu, B. J., L¨u, Y. H., L¨u, N., Zeng, Y., He, A. N., and Lam-parski, H.: Land use change and anthropogenic driving forces: a case study in Yanhe River Basin, Chinese Geogr. Sci., 21, 587– 599, 2011.
Sun, G., Zhou, G. Y., Zhang, A. Q., Wei, X. H., McNulty, S. G., and Vose, J. M.: Potential water yield reduction due to forestation across China, J. Hydrol., 328, 548–558, 2006.
Wang, L., D’Odorico, P., Evans, J. P., Eldridge, D., McCabe, M. F., Caylor, K. K., and King, E. G.: Dryland ecohydrology and climate change: critical issues and technical advances, Hydrol. Earth Syst. Sci. Discuss., 9, 4777–4825, doi:10.5194/hessd-9-4777-2012, 2012.
Wang, S., Fu, B. J., He, C. S., Sun, G., and Gao, G. Y.: A compar-ative analysis of forest cover and catchment water yield relation-ships in northern China, Forest Ecol. Manag., 262, 1189–1198, 2011.
Wang, Y. F., Fu, B. J., L¨u, Y. H., Song, C. J., and Luan, Y.: Local-scale spatial variability of soil organic carbon and its stock in the hilly area of the Loess Plateau, China, Quaternary Res., 73, 70–76, 2010.
Wang, Y. F., Fu, B. J., Chen, L. D., L¨u, Y. H., and Gao, Y.: Check dam in the Loess Plateau of China: engineering for environmen-tal services and food security, Environ. Sci. Technol., 45, 10298– 10299, 2011.
Yang, W. X.: The preliminary discussion on soil desiccation of arti-ficial vegetation in the northern regions of China, Scientia Silvae Sinicae, 32, 78–84, 1996 (in Chinese with English abstract). Yang, W. Z. and Tian, J. L.: Essential exploration of soil aridization
in Loess Plateau, Acta Pedol. Sin., 41, 1–6, 2004 (in Chinese with English abstract).