1 1
2
STUDY OF CONSUMER ACCEPTANCE ABOUT THE POTENTIAL INTRODUCTION IN 3
THE MARKET OF A CHEESE WITH BERRIES 4
5
Running Title: CONSUMER SURVEY ABOUT A NEW CHEESE PRODUCT 6
7
Ana Cristina Ferrão1*, Raquel P. F. Guiné1,2, Paula M. R. Correia1
8 9 10
1
CI&DETS Research Centre and Department of Food Industry, Polytechnic Institute of Viseu, Portugal. 11
2CITAB, University of Trás-os-Montes, Vila Real, Portugal. 12
13 14
*Corresponding author: 15
Ana Cristina Ferrão
16
Escola Superior Agrária de Viseu, Quinta da Alagoa, Estrada de Nelas, Ranhados, 3500-606 Viseu, Portugal.
17 Tel: + 351 232 446 600; Fax: +351 232 426 536 18 E-mail: [email protected] 19 20 21 Abstract 22
BACKGROUND: Nowadays, consumers are more concerned about the issues related to the 23
maintenance and promotion of health, trying to combine the pleasure in the consumption of certain 24
foods with health benefits. Therefore, there has been an increasing in the market of functional foods. 25
OBJECTIVE: The present study was carried out in order to explore the consumers’ acceptance 26
regarding the possibility of introducing in the market a new dairy product with functional properties, 27
namely a cheese with berries. 28
METHODS: A descriptive cross-sectional study was undertaken on a non-probabilistic sample of 29
335 adult participants. The questionnaires were applied online after informed consent only to adults 30
(aged 18 or over) and the data were collected from August 2016 to March 2017 among the 31
Portuguese population. 32
RESULTS: The results obtained showed that approximately 92% of the participants consumed 33
cheese of any type regularly and 50% consumed cheese two or three times per week. Most of the 34
participants (~62%) revealed that they did not consume any type of cheese with additional benefits. 35
CITATION:
Ferrão AC, Guiné RPF, Correia PMR (2019) Study of Consumer Acceptance About the Possible Commercialization of a Cheese with Berries. Current Nutrition and Food Science, 15 (2), 185-195.
2
Nevertheless, they indicated that they might be potential consumers of a cheese with berries (~73%) 36
and would like the product to have the ability to improve cardiovascular health (~73%) and have 37
high antioxidant capacity (~51%). Participants recognized as very important the addition of 38
ingredients such as blackberry, raspberry, gooseberry, blueberry, strawberry or cherry, and 39
manifested that all of the ingredients suggested might combine well with cheese. 40
CONCLUSION: This work showed that the introduction in the market of this new dairy product, a 41
cheese with berries, might be a successful strategy. 42
43
Keywords: Acceptance, cheese, consumers, functional foods, health benefits, market study, new 44
product development, survey 45
46 47
1. INTRODUCTION 48
Cheese is a fermented dairy product, traditionally present in the Mediterranean diet, and it is 49
characterized by being easily digestible and normally well tolerated [1,2]. It is a rich source of 50
dietary calcium, since approximately 35 g of hard cheese can provide 250 mg of calcium [3]. In 51
normal dietary conditions, the bioavailability of calcium is higher in milk and dairy products than in 52
other foods, such as vegetables and cereals [4–6]. Furthermore, cheese can also be a good alternative 53
to milk for those who are lactose intolerant [2,3]. However, some cheeses have a high content of 54
saturated fatty acids that could contribute to elevated low-density lipoprotein cholesterol, a well-55
defined risk factor for cardiovascular diseases [7]. For that reason, dietary guidelines recommend the 56
consumption of low-fat dairy products, avoiding high-fat ones [8]. 57
Nowadays, foods are not only intended to provide basic nutrients but also to improve physical 58
and mental well-being of humans and prevent nutrition-related diseases [9,10]. In the last decades, it 59
has been reported the rising awareness and interest of consumers for health and functional foods, 60
such as low-fat, low-sugar, high-antioxidant or high-fibre. Considering the increasing market of 61
functional foods, gaining more insight on consumers’ preferences for a wide range of heath-62
enhancing dairy products may benefit not only consumers, but also manufacturers [11–13]. Berries, 63
such as blackberry, raspberry, gooseberry, blueberry and strawberry, are widely known for their 64
antioxidant properties, among others [14–16]. 65
In an increasingly competitive food market, the developing of a new food product can be very 66
challenging for the food manufacturers, as they need to ensure that those products and ideas meet the 67
expectations of the consumers [17–19]. Therefore, marketing communication strategies that inform 68
consumers about product benefits plays a major role in order to encourage consumers to adopt 69
3
product innovations [20,21]. However, before the development of a new food product there are some 70
considerations that are need to be addressed, such as, consumers needs and marketing and 71
technological opportunities [22–24]. According to Lancaster's theory, consumers make choices based 72
on their preferences for attributes of goods. Hence, choices are determined by particular 73
combinations of product attributes [25,26]. Consumer surveys and market research are key factors in 74
the success of a new food product, since they make it possible to see, in time for corrective action, 75
the positive and less positive aspects valued by potential consumers [27,28]. 76
The aim of the present work was to investigate the consumer’s acceptance towards the 77
possibility of introducing in the market a new dairy product with added functional foods, namely a 78
cheese with berries. 79
80
2. MATERIALS AND METHODS 81
2.1. Instrument 82
For this study a questionnaire was purposely created to undertake a market study to investigate 83
the potential for marketing a new type of dairy product as well as to evaluate consumer acceptance. 84
The questionnaire included several sections, destined to collect information about several 85
important issues: 86
Part I – Sociodemographic data (1. Age, 2. Gender, 3. Highest Level of Education achieved, 4. 87
Civil State, 5. Profession); 88
Part II – Eating habits related to cheese (6. Do you eat cheese (any type) regularly, 7. Do you eat 89
fresh cheese regularly, 8. What is the preference regarding the cheese origin, 9. What is the 90
preference regarding the milk origin for cheese, 10. What is the preference regarding the purchase of 91
cured cheese, 11. What is the preference regarding the purchase of fresh cheese, 12. What is the 92
preference regarding the cheese consistency, 13. What are the types of chess consumed regularly, 14. 93
What is the frequency of consumption of cheese, 15. What is the amount of cheese consumed daily, 94
16. Do you usually consume chesses with additional health benefits); 95
Part III – Acceptance of the new product (17. Are you aware of the health benefits associated 96
with the consumption red berries, 18. Would be a potential consumer of cheese with red berries, 19. 97
What attributes for health enhancing would you like to find in a cheese with red berries, 20. What 98
reasons could contribute to make you consume cheese with red berries); 99
Part IV – Attitudes towards new ingredients for cheese (21 to 26 a). Classify the importance of 100
the health effects attributed to the following red fruits: Blackberry, Cherry, Raspberry, Currant, 101
Blueberry, Strawberry; b) Do you think these ingredients may combine with fresh cheese). 102
4
All questions were built with prefixed answers, except for age, for which the respondents would 103
indicate their age in years. 104
105
2.2. Data collection 106
It was undertaken a descriptive cross-sectional study on a non-probabilistic sample of 335 107
participants. The dimension of the sample was intended to be over 300 people who consumed 108
cheese, as specified by the company promoting the development of this new food product. The data 109
were collected from August 2016 to March 2017 among the Portuguese population. The 110
questionnaires were applied online after informed consent only to adults (aged 18 or over). All 111
ethical issues were verified when formulating and applying the questionnaire. 112
113
2.3. Statistical analysis 114
Several basic descriptive statistical tools were used for exploratory analysis of the data. In order 115
to assess the relations between some of the categorical variables under study, were used the crosstabs 116
and the chi square test. In all tests the level of significance considered was 5%. 117
To evaluate the strength of the significant relations found between some of the variables at 118
study, Cramer’s V coefficient was used. This coefficient varies from 0 to 1, and for V ≈ 0.1 the 119
association is considered weak, for V ≈ 0.3 the association is moderate and for V ≈ 0.5 or over, the 120
association is strong [29]. 121
For all data analyses it was used the SPSS software from IBM Inc. (version 24). 122
123
3. RESULTS AND DISCUSSION 124
3.1. Sample characterization 125
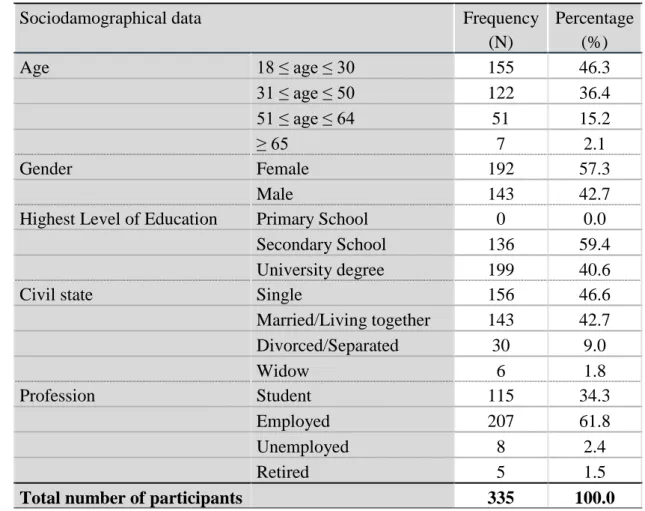
Table 1 summarizes the demographical data for the sample studied. This work involved 335 126
participants aged a minimum of 18 years and maximum of 71 years, being on average 36 ± 14 years, 127
from which 57.3% were women and 42.7% were men. The average age of men, 36 ± 15 years, was 128
similar to that of women, 36 ± 13 years. As for age, the participants were classified into categories 129
according to: young adults (18 ≤ age ≤ 30), corresponding to 46.3%; average adults (31 ≤ age ≤ 50), 130
accounting for 36.4%; senior adults (51 ≤ age ≤ 64), representing 15.2%; and finally elderly (≥ 65), 131
which accounted for 2.1% of the sample. 132
Regarding the level of education, 59.4% of the participants had a university degree, while 40.6% 133
had completed secondary school, and none had the lowest level of education (primary school) as 134
their terminal education. 135
5
Concerning the civil state, 46.6% of the participants were single, 42.7% were married or lived 136
together as a marital couple, 9.0% were separated or legally divorced and 1.8% were widow. 137
As for the profession, most of the participants were employed 61.8%, 34.3% were students, 138
2.4% were unemployed, and only 1.5% were retired. 139
140
Table 1. Sociodemographical characterization. 141
Sociodamographical data Frequency
(N) Percentage (%) Age 18 ≤ age ≤ 30 155 46.3 31 ≤ age ≤ 50 122 36.4 51 ≤ age ≤ 64 51 15.2 ≥ 65 7 2.1 Gender Female 192 57.3 Male 143 42.7
Highest Level of Education Primary School 0 0.0
Secondary School 136 59.4
University degree 199 40.6
Civil state Single 156 46.6
Married/Living together 143 42.7 Divorced/Separated 30 9.0 Widow 6 1.8 Profession Student 115 34.3 Employed 207 61.8 Unemployed 8 2.4 Retired 5 1.5
Total number of participants 335 100.0
142 143
3.2. Consumption habits about cheese 144
According to the information of International Dairy Federation and Statistics Canada, in 2015 145
the consumption of cheese in the European Union was 18.3 Kg per capita [30]. Various factors, such 146
as socioeconomic status, demographics, taste, convenience, food cost, lifestyle characteristics, 147
security, cultural and religious beliefs or nutrition knowledge, influence not only food choices but 148
also food intake [31,32]. Thus, being the main purpose of this survey the consumer acceptance of a 149
new cheese product, the habits of the participants regarding the consumption of cheese were 150
investigated. 151
6
The results obtained showed that most of the participants (92.2%) consumed cheese regularly, of 152
any type, being this percentage higher for men (95.8%) when compared to women (89.4%). 153
According to age groups, it was verified that senior adults were the ones who consumed more cheese 154
regularly (98.0%), followed by young adults (91.6%), average adults (90.9%) and finally the 155
elderlies, with a percentage of 85.7%. It was also analysed, specifically, the frequency of 156
consumption of fresh cheese. In this case, there was a slightly lower percentage of participants 157
consuming fresh cheese regularly (85.6%), with the percentage for men being again a little higher 158
than for women (93.0% and 80.1%, respectively). As for the age group, the regularity of the 159
consumption of fresh cheese was higher for the elderly group (100.0%), followed by the young 160
adults (89.0%), senior adults (86.3%) and average adults (80.2%). 161
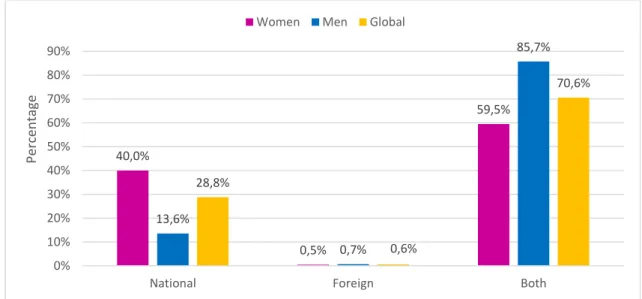
Figure 1 shows the participants’ preferences regarding cheese origin, and it was observed that 162
the majority of the participants did not have a preference for national or foreign cheese (70.6%), 163
while 28.8% preferred national cheese and only a few preferred specifically foreign cheese (0.6%). 164
Both women and men showed similar indifferentiation for national or foreign cheese (59.5% and 165
85.7%, respectively), 40.0% of the women preferred national cheese against 13.6% of men, and 166
again only a small percentage of women or men preferred specifically foreign cheeses. These trends 167
were not much different between participants with a university degree and secondary school, with 168
the option of equally liking foreign or national cheeses, being the most favoured (63.3% and 81.3%, 169
respectively). 170
171
Figure 1. Preference of cheese regarding the origin, according to gender. 172
173
As to the possible association between the variables Cheese Origin versus Gender and versus 174
Education Level, it was found that there were significant associations between the variables, and 175 40,0% 0,5% 59,5% 13,6% 0,7% 85,7% 28,8% 0,6% 70,6% 0% 10% 20% 30% 40% 50% 60% 70% 80% 90%
National Foreign Both
Perc
en
ta
ge
7
therefore gender (Chi square test: 2= 27.465; p = 0.000) and education level (Chi square test: 2=
176
13.030; p = 0.001) influenced the preference for cheese origin. The values of Cramer’s coefficient, 177
indicated that the association was weak for gender (V=0.288) and also weak for education level 178
(V=0.199). 179
It is well established the relationship between milk quality and cheese quality [33]. The milk of 180
different animal species has variable composition, particularly in fat and protein, thus inducing 181
differences also in the dairy products made with them [34,35]. Therefore, it was evaluated the 182
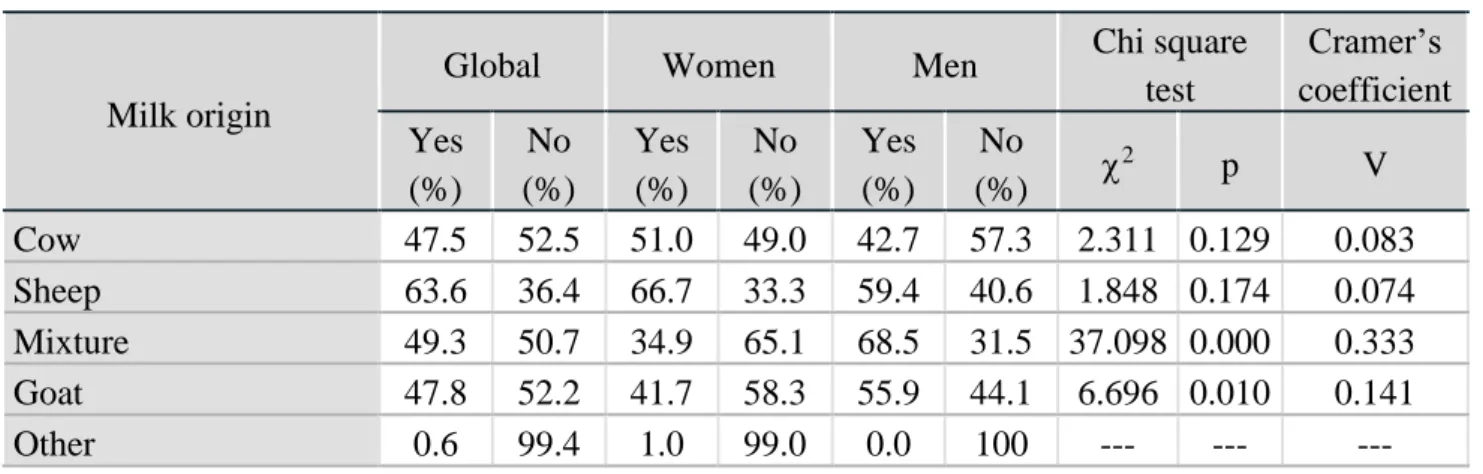
participants’ preference of cheese according to the milk origin. Table 2 presents the participants’ 183
preferences regarding the milk origin, and the results showed that cheese made with sheep milk was 184
the most appreciated by the participants (63.6%), being that type of cheese more appreciated by 185
women (66.7%) than by men (59.4%). This finding is contrary to that of Vargas-Bello-Pérez et al. 186
[36], according to which in Chile the most preferred type of cheese was from cow’s milk. For men, 187
the preferred type of cheese was the mixture one, corresponding to 68.5% of the male participants. In 188
the last years, sheep dairy products have gained market size due to the product's quality, high yield, 189
and nutritional value [37,38]. Sheep milk is an excellent matrix for cheese production, because of its 190
high levels of protein, fat and calcium by casein unit [39,40]. 191
192
Table 2. Preference of cheese regarding the milk origin. 193
Milk origin
Global Women Men Chi square
test Cramer’s coefficient Yes (%) No (%) Yes (%) No (%) Yes (%) No (%) 2 p V Cow 47.5 52.5 51.0 49.0 42.7 57.3 2.311 0.129 0.083 Sheep 63.6 36.4 66.7 33.3 59.4 40.6 1.848 0.174 0.074 Mixture 49.3 50.7 34.9 65.1 68.5 31.5 37.098 0.000 0.333 Goat 47.8 52.2 41.7 58.3 55.9 44.1 6.696 0.010 0.141 Other 0.6 99.4 1.0 99.0 0.0 100 --- --- --- 194
The results of the Chi square test showed that gender only influenced the preference for mixture 195
and goat cheese (2= 37.098; p = 0.000 and 2= 6.696; p = 0.010, respectively). As for Cramer’s 196
coefficients, the values indicated that the association between the variable Preference of cheese 197
regarding the milk origin versus Gender, was moderate for mixture cheese (V=0.333) and weak for 198
goat cheese (V=0.141). 199
Purchasing intention is affected by how consumers perceive that the product, through its usage, 200
can satisfy their needs [25]. In this way, one of the questions aimed at knowing the effect of the 201
8
cheese presentation on the buying preferences, due to the convenience associated with this variable. 202
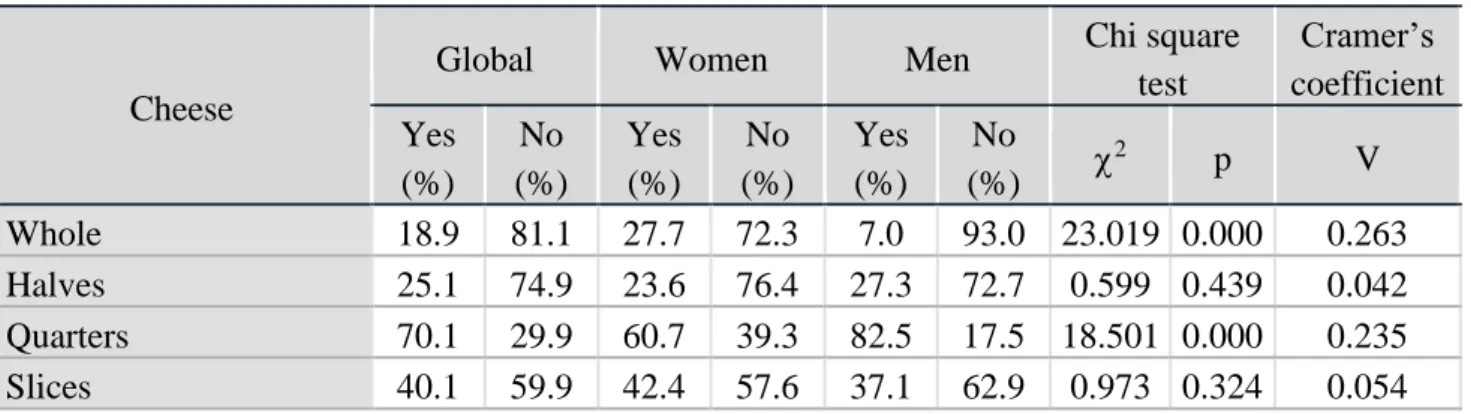
Table 3 shows the cured cheese purchase preference by the participants in this survey. The cheese in 203
quarters was the most preferred (70.1%), either by women (60.7%) or by men (82.5%). Following in 204
preference appeared slices (40.1%), halves (25.1%) and whole (18.9%). Regarding whole cheese 205
purchasing, it was observed that a higher percentage of women preferred purchasing cheese in that 206
form (27.7%) when compared to men (7.0%). 207
208
Table 3. Cured cheese purchase preference. 209
Cheese
Global Women Men Chi square
test Cramer’s coefficient Yes (%) No (%) Yes (%) No (%) Yes (%) No (%) 2 p V Whole 18.9 81.1 27.7 72.3 7.0 93.0 23.019 0.000 0.263 Halves 25.1 74.9 23.6 76.4 27.3 72.7 0.599 0.439 0.042 Quarters 70.1 29.9 60.7 39.3 82.5 17.5 18.501 0.000 0.235 Slices 40.1 59.9 42.4 57.6 37.1 62.9 0.973 0.324 0.054 210
The results revealed that there was an association between the variables Cured cheese purchase 211
preference versus Gender for whole cheese (2= 23.019; p = 0.000) and cheese in quarters (2=
212
18.501; p = 0.000), and hence, gender influenced the purchase preference of cured cheese in these 213
forms. This association was weak to moderate for whole cheese (V=0.263) and weak for cheese in 214
quarters (V=0.235). 215
As for the preference of fresh cheese purchase, from the sample at study, 49.2% of the 216
participants preferred purchasing fresh cheese in unitary packages, 29.8% in groups of two or four 217
units and 20.9% preferred to purchase the fresh cheese by weight. According to gender, most of the 218
women (36.4%) favoured purchasing fresh cheese in groups of two or four, but as for men they 219
preferred to purchase fresh cheese by weight (70.9%). Chi square test showed that existed an 220
association between the fresh cheese purchase preference and gender (2= 50.425; p = 0.000), which 221
means that gender influenced the purchase preference of fresh cheese, with a moderate association 222
(V=0.394). 223
It was also analysed the fresh cheese purchase preference according to civil state, as well as the 224
association between these variables. In this case, most of the participants, regardless of civil state, 225
preferred to purchase fresh cheese by weight. The Chi square test showed that civil sate also 226
influenced fresh cheese purchase preference (2= 31.364; p = 0.000), but with a weak association
227
(V=0.220). 228
9
The consistency of cheese affects directly its texture. Texture is an important characteristic used 229
to differentiate many cheese varieties [41–43] and is considered by the consumer to be a determinant 230
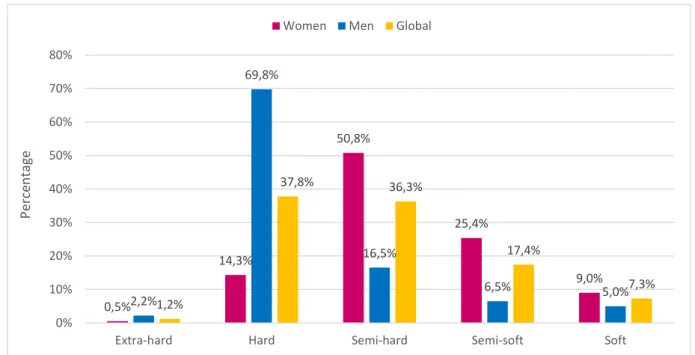
of overall quality and preference [44–46]. Figure 2 presents the preference regarding the consistency 231
of cheese, and the results showed that hard cheese was appreciated by 37.8% of the participants, 232
being that form of cheese much more appreciated by men than by women (69.8% and 14.3%, 233
respectively). For female participants, the most appreciated form of cheese was the semi-hard 234
(50.8%) and for both genders, the least appreciated form of cheese was the extra-hard. These 235
findings are consistent with the results obtained in other study, where men also preferred harder and 236
more adhesive textures [47]. 237
These differences between genders were statically significant (2= 111.108; p = 0.000), and 238
gender demonstrated to influence the preference for consistency of cheese, with a strong association 239
(V=0.582). 240
241
242
Figure 2. Preference for consistency of cheese, according to gender. 243
244
Food preferences and aversions are governed by many psychological and biological factors and 245
despite the fact that there are certain predispositions, mostly of food likes and dislikes are acquired 246
through experience [48,49]. 247
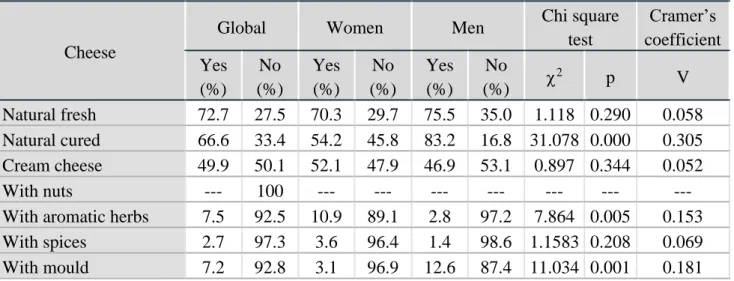
Table 4 shows participants’ consumption regarding some types of cheese. Natural fresh cheese 248
and natural cured cheese are the two most consumed types (72.7% and 66.6%, respectively). 249
However, when the types of cheese consumption is analysed by gender, the results showed that 250
women consumed more natural fresh cheese (70.3%) and men more natural cured cheese (83.2%). 251 0,5% 14,3% 50,8% 25,4% 9,0% 2,2% 69,8% 16,5% 6,5% 5,0% 1,2% 37,8% 36,3% 17,4% 7,3% 0% 10% 20% 30% 40% 50% 60% 70% 80%
Extra-hard Hard Semi-hard Semi-soft Soft
Pe
rce
n
ta
ge
10
Neither women nor men consumed cheese with nuts. The results of the Chi square test made to the 252
association between the variables Types of cheese consumed versus Gender, showed that there was a 253
significant association between these two variables for natural cured cheese (2= 31.078; p = 0.000;
254
V=0.305, meaning a moderate association), cheese with aromatic herbs (2= 7.864; p = 0.005; 255
V=0.153, weak association) and cheese with mould (2= 11.034; p = 0.001; V=0.181, weak 256
association). 257
258
Table 4. Some types of cheeses consumed by the participants. 259
Cheese
Global Women Men Chi square
test Cramer’s coefficient Yes (%) No (%) Yes (%) No (%) Yes (%) No (%) 2 p V Natural fresh 72.7 27.5 70.3 29.7 75.5 35.0 1.118 0.290 0.058 Natural cured 66.6 33.4 54.2 45.8 83.2 16.8 31.078 0.000 0.305 Cream cheese 49.9 50.1 52.1 47.9 46.9 53.1 0.897 0.344 0.052 With nuts --- 100 --- --- --- --- --- --- ---
With aromatic herbs 7.5 92.5 10.9 89.1 2.8 97.2 7.864 0.005 0.153 With spices 2.7 97.3 3.6 96.4 1.4 98.6 1.1583 0.208 0.069 With mould 7.2 92.8 3.1 96.9 12.6 87.4 11.034 0.001 0.181 260
The frequency of consumption of cheese is presented in Figure 3, and shows that 50.4% of the 261
participants consumed cheese 2/3 times per week, being the percentages different for women and 262
men (62.5% and 34.3%, respectively). In second place came the daily consumption of cheese, also 263
with an important expression (41.5%) and those who consumed cheese once a week or less 264
represented a minority. Most of the men consumed cheese daily (60.1%), against 27.6% of women. 265
These results indicate that cheese plays an important role in people’s diet and therefore this is an 266
important factor for the development of a new cheese product. 267
11 269
Figure 3. Frequency of consumption of cheese, according to gender. 270
271
As to the possible association between the variables Frequency of consumption versus Gender, it 272
was found that there was a significant association (2= 36.344; p = 0.000) between these variables, 273
which means that gender influences the frequency of the consumption of cheese. The Cramer´s 274
coefficient was equal to 0.329, meaning that there was a moderate association between these 275
variables. 276
There were also investigated other possible associations, namely the influence of variables like 277
Civil state and Age group on the frequency of consumption of cheese. The results revealed that both 278
variables influenced the frequency of the consumption of cheese: Age group (2= 19.432; p = 0.022) 279
and Civil state (2= 20.657; p = 0.014). Nevertheless, these associations were weak, given the low 280
values of Cramer’s coefficient (V=0.139 for age and V=0.143 for civil state). 281
Recommendations for dairy intake vary from region to region, but most countries have 282
quantitative recommendations that usually range from 2 to 3 servings or cups of milk or yogurt or 283
sometimes the equivalent serving of cheese [50]. When asked about the daily consumption of cheese, 284
most of the participants (55.2%) indicated that they consumed a slice per day (corresponding to 30 285
g/day), followed by the daily consumption of two slices (27.9%), three slices or more (11.4%) and 286
half-slice or less (5.4%). However, when women were compared to men, the results were quite 287
different, since 66.9% consumed a slice per day against only 39.6% of the men. Most of the male 288
participants revealed that they consumed two slices per day (40.3%). The consumptions of two slices 289
per day or three or more slices per day were also quite different between men and women, being 290
these percentages higher for men than women. According to the age group and civil state, most of 291 27,6% 62,5% 5,7% 4,2% 60,1% 34,3% 4,2% 1,4% 41,5% 50,4% 5,1% 3,0% 0% 10% 20% 30% 40% 50% 60% 70%
Daily Two or three times/week Once/week Sporadically
Perc
en
ta
ge
12
the participants also consumed a slice of cheese per day. As for the civil state, the exception was the 292
single participants, being that 42.3% of them consumed two slices per day. It was also observed that 293
none of the elderly participants consumed two or three or more slices of cheese per day. These 294
results suggest that, in generally, participants include dairy products in their daily diet. 295
The results of the Chi square test revealed that in all cases were significant associations, and 296
therefore Gender (2= 29.423; p = 0.000; V=0.306, meaning a moderate association), Age group 297
(2= 37.194; p = 0.000; V=0.198, weak association) and Civil state (2= 48.668; p = 0.000; V=0.227, 298
weak association) influenced the daily habits of consumption of cheese. 299
Table 5 presents the types of cheeses with additional health benefits consumed by the 300
participants in this survey. Most of the participants, 65.2%, answered that they didn’t consume any 301
cheeses with additional health benefits, followed by the participants who consumed light cheeses 302
(31.5%) and in third place came those who consumed chesses enriched with calcium (12.1%). These 303
trends were very different between women and men, being that 52.4% of the women consumed light 304
cheese against only 3.5% of the men. As for men, most of them indicated that they didn’t consume 305
any cheese with additional health benefits (93.6%). Usually women are more concerned about gain 306
weight than men [51]. Therefore, lower fat cheeses allow those who want to eat cheese still 307
remaining within theirs personal dietary goals [52]. 308
309
Table 5. Types of cheeses with additional health benefits consumed by the participants. 310
Cheese
Global Women Men Chi square
test Cramer’s coefficient Yes (%) No (%) Yes (%) No (%) Yes (%) No (%) 2 p V Lactose free 0.6 99.4 1.1 98.9 0.0 100.0 1.501 0.220 0.067 Enriched with calcium 12.1 87.9 19.0 81.0 2.8 97.2 19.992 0.000 0.246 Weight control (light) 31.5 68.5 52.4 47.6 3.5 96.5 89.230 0.000 0.520
None 65.2 34.8 43.9 56.1 93.6 6.4 87.862 0.000 0.516
311
As for the association between the variables Types of cheeses with health benefits versus 312
Gender, it was observed that there were significant associations between these two variables for three 313
types of cheeses: cheese enriched with calcium (2= 19.992; p = 0.000; V=0.246, weak association), 314
light cheese (2= 89.230; p = 0.000; V=0.520, strong association) and none (2= 87.862; p = 0.000; 315
V=0.516, strong association). Therefore, gender influenced the consumption of cheeses with 316
additional health benefits. 317
13 3.3. Acceptance of the new product
319
Berries represent a variety of small fruits characterized by the red, purple, and blue colour. The 320
most common berries are: blueberry, bilberry, cranberry, blackberry, raspberry, black, white or red 321
currant, and strawberry [53]. In recent years, the attention given to berries has increased due to their 322
important role in the modulation of oxidative stress, vascular function, inflammation, and lipid 323
metabolism [16,54–56]. 324
From the participants in the survey, 73.1% replied that they were aware about the benefits 325
associated with the consumption of berries, being this percentage higher for women (83.2%) when 326
compared to men (59.4%). The results of the Chi square test for the association of the variables 327
Knowledge about berries benefits versus Gender showed significant differences (2= 23.542; p = 328
0.000), meaning that gender influenced knowledge about berries benefits for human health, The 329
value of Cramer’s coefficient (V = 0.265) indicated that the association was moderate. 330
It was also analysed the association between the knowledge about health benefits of berries and 331
education level. The difference between these two variables was found significant (2= 38.291; p = 332
0.000), indicating that also education level influenced the knowledge about berries benefits for health 333
and the participants with university degree were significantly more aware of these benefits than those 334
who had secondary school. Again the association was moderate (V=0.339). 335
Other possible associations were investigated, namely the influence of the variables Age group 336
and Profession on the knowledge about health benefits of berries. The results revealed that in both 337
cases were found significant associations (Age group: 2= 55.568; p = 0.000 and for Profession: 2=
338
62.274; p = 0.000). Average adults and senior adults were more aware about the health benefits of 339
berries, as well as employed and unemployed participants. The retired participants were the ones 340
who showed a lower knowledge about the health benefits of berries. As for the Cramer´s coefficient, 341
it was found a moderate to strong association for both variables (V=0.408 for Age group and 342
V=0.432 for Profession). 343
According to the evidences, normally women tend to have greater levels of nutrition knowledge 344
than men. Higher levels of nutrition knowledge are also associated with higher education level or 345
socio-economic status [31,57–59] and tend to be equally higher among middle-aged persons than 346
among younger or older ones [59–61]. 347
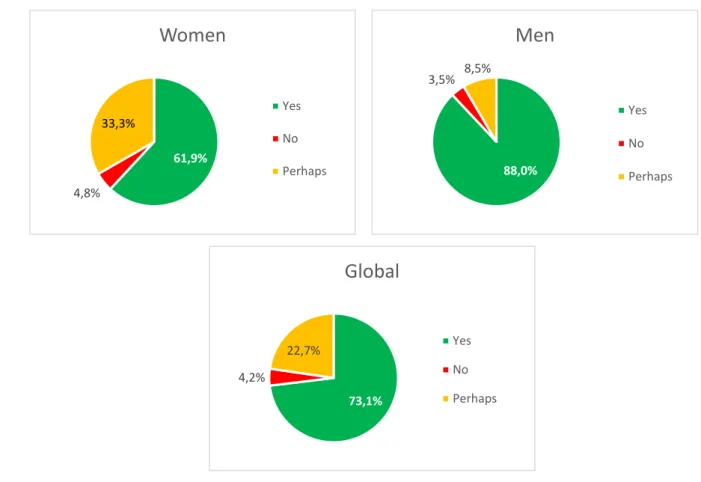
Figure 4 shows the intention of consuming this new product, a fresh cheese with berries, and 348
73.1% answered that they would consume it. When seen by gender, the results were different, with 349
men manifesting more interest in consuming this product (88.0%) than women (61.9%). These 350
differences between genders were statistically different (2= 30.019; p = 0.000), therefore gender 351
14 61,9% 4,8% 33,3%
Women
Yes No Perhapsinfluenced if the participants might be potential consumers of this product or not. The association 352
was found moderate (V=0.301). 353 354 355 356 357 358 359 360 361 362 363 364 365 366 367
Figure 4. Intention of consuming a cheese with berries. 368
369
As for Age group, it was also found an association between that variable and the Intention of 370
consuming (2= 22.105; p = 0.001), being the young adults and the elderlies those who manifested a
371
higher intention of consuming this product (82.9% and 85.7%, respectively), although, in this case 372
the association between these variables was considered weak (V=0.183). 373
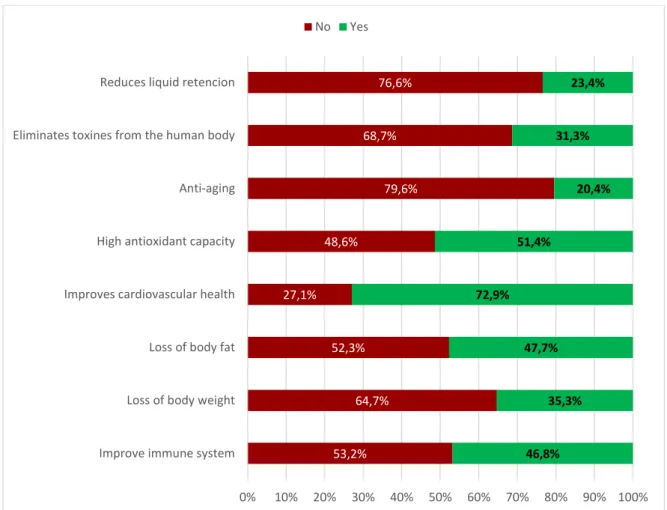
Figure 5 presents the attributes that the participants would like to find in a cheese with berries. In 374
first place came the improvement of cardiovascular health, with 72.9% of positive answers and in 375
second came high antioxidant capacity (51.4%). All the other attributes were not so valued by the 376
possible consumers, with percentages under 50%. 377 88,0% 3,5% 8,5%
Men
Yes No Perhaps 73,1% 4,2% 22,7%Global
Yes No Perhaps15 378
Figure 5. Attributes that the participants would like to find in a cheese with berries. 379
380
Table 6 shows some reasons that could lead the participants to consume this product. According 381
to the results obtained, it was observed that the main reason presented by the participants for the 382
consumption of this kind of cheese was the flavour (92.8%), being this percentage similar either for 383
women and men (92.1% and 93.6%, respectively). Following in importance appeared the health 384
benefits (68.1%). In this case, as it was expected, when women were compared to men, the results 385
were quiet different, since 75.9% of women believed that the health benefits are an important reason 386
to consume this product, against only 57.4% of the men. 387
Regarding the visual appearance and colour, women seem to be more concerned about these 388
attributes than men. On the other hand, men (51.8%) demonstrated more preoccupation about the 389
texture of the product when compared to women (35.6%). 390
Except for flavour, all the others reasons were influenced by gender, as it was shown by the 391
results of the Chi square test. Nevertheless, in all cases the associations between the variables were 392 weak. 393 394 395 53,2% 64,7% 52,3% 27,1% 48,6% 79,6% 68,7% 76,6% 46,8% 35,3% 47,7% 72,9% 51,4% 20,4% 31,3% 23,4% 0% 10% 20% 30% 40% 50% 60% 70% 80% 90% 100% Improve immune system
Loss of body weight Loss of body fat Improves cardiovascular health High antioxidant capacity Anti-aging Eliminates toxines from the human body Reduces liquid retencion
16
Table 6. Reasons that could lead the participants to consume this product. 396
Global Women Men Chi square
test Cramer’s coefficient Yes (%) No (%) Yes (%) No (%) Yes (%) No (%) 2 p V Flavour 92.8 7.2 92.1 7.9 93.6 6.4 0.262 0.609 0.068 Visual appearance 14.2 85.8 19.4 80.6 7.1 92.9 10.065 0.002 0.174 Colour 2.7 97.3 4.7 95.3 0.0 100.0 6.829 0.009 0.143 Texture 42.5 57.5 35.6 64.4 51.8 48.2 8.682 0.003 0.162 Innovation 24.4 75.6 20.4 79.6 29.8 70.2 3.860 0.049 0.108 Health benefits 68.1 31.9 75.9 24.1 57.4 42.6 12.732 0.000 0.196 397
3.4. New ingredients for cheese 398
There are a wide variety of berries, therefore it was also investigated how the potential 399
consumers faced the more common berries regarding their main health functionalities and their 400
possible combinations with the product in question. 401
Table 7 refers to the importance of each suggested ingredient, considering their main health 402
benefits. In general all ingredients were recognized as very important (score 5), with percentages of 403
answers varying between 74.9% and 82.8%. 404
405
Table 7. Recognized importance of the suggested ingredients based on their main health benefits. 406
Ingredient Main functionalities Score1
(% of answers)
1 2 3 4 5
Blackberry Anti-aging 2.1 2.4 8.9 11.6 74.9
Cherry Anti-inflammatory 1.2 1.2 6.7 8.3 82.5
Raspberry Diuretic 3.7 0.9 9.3 9.0 77.2
Currant Prevents diabetes 1.5 0.9 8.3 8.0 81.2
Blueberry Reduces cholesterol levels 1.2 0.9 5.2 9.8 82.8
Strawberry Helps alkalinizing blood 1.9 0.9 8.0 9.6 79.6
1scale: 1 = not important, 2 = of little importance, 3 = moderately important, 4 = important, 5 = very important
407 408
Figure 6 is relative to the participants’ opinions about the possible combination of different 409
ingredients with cheese. All ingredients had been identified as having the potential to combine well 410
in cheese. Nevertheless, according to the participants’ answers, the ingredients that could combine 411
better with cheese were raspberry (92.3% positive answers) and blueberry (91.6%). 412
17 414
Figure 6. Opinions of the participants about the combination of different ingredients with cheese. 415
416
4. CONCLUSION 417
Among the most relevant results are the frequency of consumption of cheese, with most of the 418
participants consuming cheese regularly. According to the preference for milk origin and type of 419
cheese, the majority of the participants indicated to have preference for cheese made with sheep milk 420
and for natural fresh cheese. As for the consumption of cheeses with additional health benefits, most 421
of the participants indicated that they did not consume any cheese with these characteristics. 422
Regarding the intention of consuming a cheese with berries, the majority of the participants 423
revealed that they might be potential consumers of this product, and particularly the men with higher 424
levels of education. The participants indicated that they would like that this product would have the 425
ability to improve cardiovascular health and have high antioxidant capacity. 426
Participants recognized as very important adding berries in cheese, because of their health 427
effects and believe that all of the ingredients suggested might combine well with cheese. In this way, 428
it would be possible to have a dairy product with improved health benefits, thus contributing for the 429
expansion of the dairy industry and at the same time promoting better public health. 430
431
5. CONFLICT OF INTEREST 432
The authors have no conflict of interest to declare. 433 434 10,6% 13,7% 7,4% 12,8% 8,4% 8,8% 89,1% 86,0% 92,3% 87,2% 91,6% 91,2% 0% 10% 20% 30% 40% 50% 60% 70% 80% 90% 100% Blackberry Cherry Raspberry Gooseberry Blueberry Strawberry No Yes
18 6. ACKNOWLEDGMENT
435
The author thanks Instituto Politécnico de Viseu/CI&DETS and FCT - Fundação para a Ciência 436
e Tecnologia, I.P., for financial support under the project UID/Multi/04016/2016. 437
438
7. REFERENCES 439
[1] Hinrichs J. Mediterranean milk and milk products. Eur J Nutr 2004;43:i12–7. 440
doi:10.1007/s00394-004-1104-8. 441
[2] Chen G-C, Wang Y, Tong X, Szeto IMY, Smit G, Li Z-N, et al. Cheese consumption and risk 442
of cardiovascular disease: a meta-analysis of prospective studies. Eur J Nutr 2016:1–11. 443
doi:10.1007/s00394-016-1292-z. 444
[3] Rozenberg S, Body J-J, Bruyère O, Bergmann P, Brandi ML, Cooper C, et al. Effects of Dairy 445
Products Consumption on Health: Benefits and Beliefs—A Commentary from the Belgian 446
Bone Club and the European Society for Clinical and Economic Aspects of Osteoporosis, 447
Osteoarthritis and Musculoskeletal Diseases. Calcif Tissue Int 2016;98:1–17. 448
doi:10.1007/s00223-015-0062-x. 449
[4] Caroli A, Poli A, Ricotta D, Banfi G, Cocchi D. Invited review: Dairy intake and bone health: a 450
viewpoint from the state of the art. J Dairy Sci 2011;94:5249–62. doi:10.3168/jds.2011-4578. 451
[5] KELLER JL, LANOU AJ, BARNARD ND. The Consumer Cost of Calcium From Food and 452
Supplements. Journal of the American Dietetic Association 2002;102:1669–71. 453
doi:10.1016/S0002-8223(02)90355-X. 454
[6] Weaver CM, Proulx WR, Heaney R. Choices for achieving adequate dietary calcium with a 455
vegetarian diet. Am J Clin Nutr 1999;70:543s–548s. 456
[7] Mihaylova B, Emberson, J, Blackwell L, Keech A, Simes J, Barnes E, et al. The effects of 457
lowering LDL cholesterol with statin therapy in people at low risk of vascular disease: meta-458
analysis of individual data from 27 randomised trials. The Lancet 2012;380:581–90. 459
doi:10.1016/S0140-6736(12)60367-5. 460
[8] Piepoli MF, Hoes AW, Agewall S, Albus C, Brotons C, Catapano AL, et al. 2016 European 461
Guidelines on cardiovascular disease prevention in clinical practiceThe Sixth Joint Task Force 462
of the European Society of Cardiology and Other Societies on Cardiovascular Disease 463
Prevention in Clinical Practice (constituted by representatives of 10 societies and by invited 464
experts)Developed with the special contribution of the European Association for 465
Cardiovascular Prevention & Rehabilitation (EACPR). Eur Heart J 2016;37:2315–81. 466
doi:10.1093/eurheartj/ehw106. 467
[9] Annunziata A, Vecchio R. Functional foods development in the European market: A consumer 468
perspective. Journal of Functional Foods 2011;3:223–8. doi:10.1016/j.jff.2011.03.011. 469
[10] Menrad K. Market and marketing of functional food in Europe. Journal of Food Engineering 470
2003;56:181–8. doi:10.1016/S0260-8774(02)00247-9. 471
[11] Bimbo F, Bonanno A, Nocella G, Viscecchia R, Nardone G, De Devitiis B, et al. Consumers’ 472
acceptance and preferences for nutrition-modified and functional dairy products: A systematic 473
review. Appetite 2017;113:141–54. doi:10.1016/j.appet.2017.02.031. 474
[12] Kaur N, Singh DP. Deciphering the consumer behaviour facets of functional foods: A literature 475
review. Appetite 2017;112:167–87. doi:10.1016/j.appet.2017.01.033. 476
19
[13] Valls DJ, Pasamontes N, Pantaleón A, Vinaixa S, Vaqué M, Soler A, et al. Prospects of 477
Functional Foods/Nutraceuticals and Markets. In: Ramawat KG, Mérillon J-M, editors. Natural 478
Products, Springer Berlin Heidelberg; 2013, p. 2491–525. doi:10.1007/978-3-642-22144-6_67. 479
[14] de Souza VR, Pereira PAP, da Silva TLT, de Oliveira Lima LC, Pio R, Queiroz F. 480
Determination of the bioactive compounds, antioxidant activity and chemical composition of 481
Brazilian blackberry, red raspberry, strawberry, blueberry and sweet cherry fruits. Food 482
Chemistry 2014;156:362–8. doi:10.1016/j.foodchem.2014.01.125. 483
[15] Lila MA, Raskin I. Health-related Interactions of Phytochemicals. Journal of Food Science 484
2005;70:R20–7. doi:10.1111/j.1365-2621.2005.tb09054.x. 485
[16] Nile SH, Park SW. Edible berries: Bioactive components and their effect on human health. 486
Nutrition 2014;30:134–44. doi:10.1016/j.nut.2013.04.007. 487
[17] Almli VL, Næs T, Enderli G, Sulmont-Rossé C, Issanchou S, Hersleth M. Consumers’ 488
acceptance of innovations in traditional cheese. A comparative study in France and Norway. 489
Appetite 2011;57:110–20. doi:10.1016/j.appet.2011.04.009. 490
[18] Menezes E, Deliza R, Chan HL, Guinard J-X. Preferences and attitudes towards açaí-based 491
products among North American consumers. Food Research International 2011;44:1997–2008. 492
doi:10.1016/j.foodres.2011.02.048. 493
[19] Urala N, Lähteenmäki L. Consumers’ changing attitudes towards functional foods. Food 494
Quality and Preference 2007;18:1–12. doi:10.1016/j.foodqual.2005.06.007. 495
[20] Deliza R, Rosenthal A, Abadio FBD, Silva CHO, Castillo C. Application of high pressure 496
technology in the fruit juice processing: benefits perceived by consumers. Journal of Food 497
Engineering 2005;67:241–6. doi:10.1016/j.jfoodeng.2004.05.068. 498
[21] Onwezen MC, Bartels J. Which perceived characteristics make product innovations appealing 499
to the consumer? A study on the acceptance of fruit innovations using cross-cultural consumer 500
segmentation. Appetite 2011;57:50–8. doi:10.1016/j.appet.2011.03.011. 501
[22] Ares G, Gámbaro A. Influence of gender, age and motives underlying food choice on perceived 502
healthiness and willingness to try functional foods. Appetite 2007;49:148–58. 503
doi:10.1016/j.appet.2007.01.006. 504
[23] Siró I, Kápolna E, Kápolna B, Lugasi A. Functional food. Product development, marketing and 505
consumer acceptance—A review. Appetite 2008;51:456–67. doi:10.1016/j.appet.2008.05.060. 506
[24] van Kleef E, van Trijp HCM, Luning P, Jongen WMF. Consumer-oriented functional food 507
development: how well do functional disciplines reflect the ‘voice of the consumer’? Trends in 508
Food Science & Technology 2002;13:93–101. doi:10.1016/S0924-2244(02)00068-7. 509
[25] Eldesouky A, Mesías FJ, Elghannam A, Gaspar P, Escribano M. Are packaging and 510
presentation format key attributes for cheese consumers? International Dairy Journal 511
2016;61:245–9. doi:10.1016/j.idairyj.2016.06.011. 512
[26] Lancaster K. A New Approach to Consumer Theory. The Journal of Political Economy 513
1996;74:132–57. 514
[27] Bogue J, Collins O, Troy AJ. Market analysis and concept development of functional foods. In: 515
Bagchi D, Nair S, editors. Developing New Functional Food and Nutraceutical Products, San 516
Diego: Academic Press; 2017, p. 29–45. doi:10.1016/B978-0-12-802780-6.00002-X. 517
[28] Derbyshire J, Giovannetti E. Understanding the failure to understand New Product 518
Development failures: Mitigating the uncertainty associated with innovating new products by 519
20
combining scenario planning and forecasting. Technological Forecasting and Social Change 520
n.d. doi:10.1016/j.techfore.2017.02.007. 521
[29] Witten R, Witte J. Statistics. 9th ed. NJ: Wiley; 2009. 522
[30] International Dairy Federation and Statistics Canada. Per Capita Global Consumption of Cheese 523
- Canadian Dairy Information Centre (CDIC) 2016.
524
http://www.dairyinfo.gc.ca/index_e.php?s1=dff-fcil&s2=cons&s3=consglo&s4=tc-ft (accessed 525
April 25, 2017). 526
[31] Spronk I, Kullen C, Burdon C, O’Connor H. Relationship between nutrition knowledge and 527
dietary intake. Br J Nutr 2014;111:1713–26. doi:10.1017/S0007114514000087. 528
[32] Deshmukh-Taskar P, Nicklas TA, Yang S-J, Berenson GS. Does Food Group Consumption 529
Vary by Differences in Socioeconomic, Demographic, and Lifestyle Factors in Young Adults? 530
The Bogalusa Heart Study. J Am Diet Assoc 2007;107:223–34. doi:10.1016/j.jada.2006.11.004. 531
[33] Skeie SB. Quality aspects of goat milk for cheese production in Norway: A review. Small 532
Ruminant Research 2014;122:10–7. doi:10.1016/j.smallrumres.2014.07.012. 533
[34] Claeys WL, Verraes C, Cardoen S, De Block J, Huyghebaert A, Raes K, et al. Consumption of 534
raw or heated milk from different species: An evaluation of the nutritional and potential health 535
benefits. Food Control 2014;42:188–201. doi:10.1016/j.foodcont.2014.01.045. 536
[35] Pereira PC. Milk nutritional composition and its role in human health. Nutrition 2014;30:619– 537
27. doi:10.1016/j.nut.2013.10.011. 538
[36] Vargas-Bello-Pérez E, Aguilar C, Toro-Mujica P, Vera RR, Cerda M, Briones I. 539
Characterization of cheese consumers in Santiago Province, Chile. Ciencia e Investigación 540
Agraria 2014;41:327–35. doi:10.4067/S0718-16202014000300005. 541
[37] Balthazar C f., Pimentel T c., Ferrão L l., Almada C n., Santillo A, Albenzio M, et al. Sheep 542
Milk: Physicochemical Characteristics and Relevance for Functional Food Development. 543
COMPREHENSIVE REVIEWS IN FOOD SCIENCE AND FOOD SAFETY 2017;16:247–62. 544
doi:10.1111/1541-4337.12250. 545
[38] Park YW, Juárez M, Ramos M, Haenlein GFW. Physico-chemical characteristics of goat and 546
sheep milk. Small Ruminant Research 2007;68:88–113.
547
doi:10.1016/j.smallrumres.2006.09.013. 548
[39] Barłowska J, Szwajkowska M, Litwińczuk Z, Król J. Nutritional Value and Technological 549
Suitability of Milk from Various Animal Species Used for Dairy Production. Comprehensive 550
Reviews in Food Science and Food Safety 2011;10:291–302. doi:10.1111/j.1541-551
4337.2011.00163.x. 552
[40] Moatsou G, Samolada M, Katsabeki A, Anifantakis E. Casein fraction of ovine milk from 553
indigenous Greek breeds. Lait 2004;84:285–96. doi:10.1051/lait:2004006. 554
[41] Lee C-H, Imoto EM, Rha C. Evaluation of Cheese Texture. Journal of Food Science 555
1978;43:1600–5. doi:10.1111/j.1365-2621.1978.tb02552.x. 556
[42] Antoniou K d., Petridis D, Raphaelides S, Omar ZB, Kesteloot R. Texture Assessment of 557
French Cheeses. Journal of Food Science 2000;65:168–72. doi:10.1111/j.1365-558
2621.2000.tb15974.x. 559
[43] Wendin K, Langton M, Caous L, Hall G. Dynamic analyses of sensory and microstructural 560
properties of cream cheese. Food Chemistry 2000;71:363–78. doi:10.1016/S0308-561
8146(00)00200-4. 562
21
[44] Adda J, Gripon JC, Vassal L. The chemistry of flavour and texture generation in cheese. Food 563
Chemistry 1982;9:115–29. doi:10.1016/0308-8146(82)90073-5. 564
[45] Guinard J-X, Mazzucchelli R. The sensory perception of texture and mouthfeel. Trends in Food 565
Science & Technology 1996;7:213–9. doi:10.1016/0924-2244(96)10025-X. 566
[46] Brown JA, Foegeding EA, Daubert CR, Drake MA, Gumpertz M. Relationships Among 567
Rheological and Sensorial Properties of Young Cheeses. Journal of Dairy Science 568
2003;86:3054–67. doi:10.3168/jds.S0022-0302(03)73905-8. 569
[47] Kälviäinen N, Schlich P, Tuorila H. Consumer Texture Preferences: Effect of Age, Gender and 570
Previous Experience. Journal of Texture Studies 2000;31:593–607. doi:10.1111/j.1745-571
4603.2000.tb01022.x. 572
[48] Rozin P, Vollmecke TA. Food likes and dislikes. Annu Rev Nutr 1986;6:433–56. 573
doi:10.1146/annurev.nu.06.070186.002245. 574
[49] Tan HSG, Fischer ARH, Tinchan P, Stieger M, Steenbekkers LPA, van Trijp HCM. Insects as 575
food: Exploring cultural exposure and individual experience as determinants of acceptance. 576
Food Quality and Preference 2015;42:78–89. doi:10.1016/j.foodqual.2015.01.013. 577
[50] Weaver CM. How sound is the science behind the dietary recommendations for dairy? Am J 578
Clin Nutr 2014;99:1217S–1222S. doi:10.3945/ajcn.113.073007. 579
[51] Keel PK, Forney KJ. Psychosocial risk factors for eating disorders. Int J Eat Disord 580
2013;46:433–9. doi:10.1002/eat.22094. 581
[52] Childs JL, Drake M. Consumer Perception of Fat Reduction in Cheese. Journal of Sensory 582
Studies 2009;24:902–21. doi:10.1111/j.1745-459X.2009.00243.x. 583
[53] Vendrame S, Del Bo’ C, Ciappellano S, Riso P, Klimis-Zacas D. Berry Fruit Consumption and 584
Metabolic Syndrome. Antioxidants (Basel) 2016;5. doi:10.3390/antiox5040034. 585
[54] Blanch N, Clifton PM, Keogh JB. A systematic review of vascular and endothelial function: 586
effects of fruit, vegetable and potassium intake. Nutr Metab Cardiovasc Dis 2015;25:253–66. 587
doi:10.1016/j.numecd.2014.10.001. 588
[55] Del Bo’ C, Martini D, Porrini M, Klimis-Zacas D, Riso P. Berries and oxidative stress markers: 589
an overview of human intervention studies. Food Funct 2015;6:2890–917. 590
doi:10.1039/c5fo00657k. 591
[56] Vendrame S, Klimis-Zacas D. Anti-inflammatory effect of anthocyanins via modulation of 592
nuclear factor-κB and mitogen-activated protein kinase signaling cascades. Nutr Rev 593
2015;73:348–58. doi:10.1093/nutrit/nuu066. 594
[57] Beydoun MA, Wang Y. Do nutrition knowledge and beliefs modify the association of socio-595
economic factors and diet quality among US adults? Preventive Medicine 2008;46:145–53. 596
doi:10.1016/j.ypmed.2007.06.016. 597
[58] De Vriendt T, Matthys C, Verbeke W, Pynaert I, De Henauw S. Determinants of nutrition 598
knowledge in young and middle-aged Belgian women and the association with their dietary 599
behaviour. Appetite 2009;52:788–92. doi:10.1016/j.appet.2009.02.014. 600
[59] Parmenter K, Waller J, Wardle J. Demographic variation in nutrition knowledge in England. 601
Health Educ Res 2000;15:163–74. doi:10.1093/her/15.2.163. 602
[60] Grunert KG, Wills J, Celemín LF, Lähteenmäki L, Scholderer J, Storcksdieck genannt 603
Bonsmann S. Socio-demographic and attitudinal determinants of nutrition knowledge of food 604
22
shoppers in six European countries. Food Quality and Preference 2012;26:166–77. 605
doi:10.1016/j.foodqual.2012.04.007. 606
[61] Heaney S, O’Connor H, Michael S, Gifford J, Naughton G. Nutrition knowledge in athletes: a 607
systematic review. International Journal of Sport Nutrition and Exercise Metabolism 608
2011;21:248–61. 609