http://acc.sagepub.com/
Care
European Heart Journal: Acute Cardiovascular
http://acc.sagepub.com/content/early/2014/03/31/2048872614528858 The online version of this article can be found at:
DOI: 10.1177/2048872614528858
published online 31 March 2014
European Heart Journal: Acute Cardiovascular Care
Ana T Timóteo, Ana L Papoila, Pedro Rio, Fernando Miranda, Maria L Ferreira and Rui C Ferreira
syndromes: added value on top of GRACE risk score
Prognostic impact of admission blood glucose for all-cause mortality in patients with acute coronary
Published by:
European Society of Cardiology
ESC Working Group on Acute Cardiac Care
and
http://www.sagepublications.com
can be found at: European Heart Journal: Acute Cardiovascular Care
Additional services and information for
http://acc.sagepub.com/cgi/alerts Email Alerts: http://acc.sagepub.com/subscriptions Subscriptions: http://www.sagepub.com/journalsReprints.nav Reprints: http://www.sagepub.com/journalsPermissions.nav Permissions: What is This? - Mar 31, 2014 OnlineFirst Version of Record
European Heart Journal: Acute Cardiovascular Care 1 –7
© The European Society of Cardiology 2014 Reprints and permissions:
sagepub.co.uk/journalsPermissions.nav DOI: 10.1177/2048872614528858 acc.sagepub.com EUROPEAN SOCIETY OF CARDIOLOGY®
Prognostic impact of admission
blood glucose for all-cause mortality
in patients with acute coronary
syndromes: added value on top of
GRACE risk score
Ana T Timóteo
1, Ana L Papoila
2,3, Pedro Rio
1, Fernando
Miranda
4, Maria L Ferreira
1and Rui C Ferreira
1Abstract
Background: Abnormal glucose metabolism is a predictor of worse outcome after acute coronary syndrome (ACS).
However, this parameter is not included in risk prediction scores, including GRACE risk score. We sought to evaluate whether the inclusion of blood glucose at admission in a model with GRACE risk score improves risk stratification.
Methods: Study of consecutive patients included in a single centre registry of ACS. Our primary endpoint was the
occurrence of all-cause mortality at one-year follow-up. The ability of the two logistic regression models (GRACE risk score alone and in combination with blood glucose) to predict death was analysed. Continuous net reclassification improvement (NRI) and integrated discrimination improvement (IDI), with corresponding 95% confidence intervals (CIs), were also calculated.
Results: We included 2099 patients, with a mean age of 64 (SD=13) years, 69% males. In our sample, 55.1% presented
with ST-segment elevation ACS and 13.1% in Killip class ≥ 2. Only 25% were known diabetic at admission. In-hospital mortality was 5.8% and 9.7% at one-year follow-up. The best cut-point for blood glucose was 160 mg/dl (sensitivity 62% and specificity 68%), and 35.2% of the patients had increased levels. This group was elderly, had more prevalence of cardiovascular risk factors, worse renal function and GRACE score as well as more frequently Killip class ≥2. Treatment was similar in both groups besides less frequent use of clopidogrel in high glycaemic patients. The hyperglycaemia group had higher one-year mortality (17.2% vs. 5.6%, p<0.001). Moreover, binary blood glucose remained a predictor of death independently of the GRACE risk score and the presence of diabetes (odds ratio (OR) 1.99, 95% CI 1.40–2.84, p<0.001). The inclusion of blood glucose, as a continuous variable, in a logistic regression model with GRACE score, increased the area under the ROC curve from 0.80 to 0.82 (p=0.018) as well as the goodness-of-fit and was associated with an improvement in both the NRI (37%) and the IDI (0.021), suggesting effective reclassification.
Conclusions: A blood glucose level on admission ≥ 160 mg/dl is an independent predictor of mortality in
medium-term follow-up. It offers an incremental predictive value when added to the GRACE risk score, although with a modest magnitude of improvement, probably due to the high predictive performance of the GRACE risk score alone.
Keywords
Admission blood glucose, GRACE risk score, acute coronary syndromes, prognosis
Received: 18 November 2013; accepted: 3 March 2014
1 Cardiology Department, Santa Marta Hospital, Centro Hospitalar de
Lisboa Central, Lisbon, Portugal
2 Biostatistics Department, CEAUL, Medical Sciences Faculty, New
University of Lisbon, Portugal
3 Research Department, Hospital Dona Estefânia, Centro Hospitalar de
Lisboa Central, Lisbon, Portugal
Original scientific paper
4 Clinical Pathology Department, Santa Marta Hospital, Centro
Hospitalar de Lisboa Central, Lisbon, Portugal
Corresponding author:
Ana Teresa Timóteo, Cardiology Department, Hospital Santa Marta, Rua Santa Marta, 1169-024 Lisboa, Portugal.
2 European Heart Journal: Acute Cardiovascular Care
Introduction
Elevated admission blood glucose is an important marker of worse outcome in patients with myocardial infarction.1 It is useful in patients both with and without diabetes.2–9 It is usually caused by stress hyperglycaemia induced by cat-echolamines, which, in turn, are correlated with myocardial lesion extension.1 However, risk scores applied in clinical practice do not include this variable.
The Global Registry of Acute Coronary Events (GRACE) risk score is a validated and established score for risk strati-fication of patients with acute coronary syndromes, obtained from a multicentre registry.10 It is used worldwide with very good predictive value for short- and medium-term all-cause mortality. It incorporates several clinical and laboratorial variables to which a score is given to obtain the final score. Although better than previous risk scores, some patients are still incorrectly classified and some improvement in predic-tive accuracy would be important, particularly with the use of an easily obtainable variable.
Few studies are found in the literature that assessed the incremental prognostic value of admission blood glucose in combination with the GRACE risk score. However, these studies are somewhat small and showed no significant ben-efit.11,12 We sought to investigate the incremental value of admission blood glucose when considered with the GRACE risk score for the prediction of all-cause mortality at one-year, in a large sample of patients with the whole spectrum of acute coronary syndromes.
Methods
This is an observational study of all consecutive patients admitted to our intensive care unit (ICU) with ACS (with and without ST-segment elevation) during the years 2008 to 2010. Data were collected prospectively and recorded on a computer database of ACS patients admitted to our institu-tion’s ICU (single-centre registry of ACS). Inclusion crite-ria were a history of chest pain at rest or other symptoms suggestive of an ACS, with the most recent episode occur-ring within 24 hours of admission. This could be associated with new or presumed new significant ST-segment–T wave changes/new left bundle branch block or elevated levels of biomarkers of myocardial damage (cardiac troponin I and creatine kinase). Myocardial infarction was defined by a rise and/or fall of cardiac troponin I with at least one value above 0.06 ng/ml. We evaluated demographic characteris-tics of the patients, risk factors for coronary artery disease, previous cardiac history, laboratorial data and vital signs on admission as well as in-hospital treatment. Automated lab-oratory equipment (Beckman Coulter LXiTM analyser) was used for glucose determination by the glucose-oxidase method (coefficient of variation: 2.0%).
We enrolled all consecutive patients if they had a record of admission blood glucose. There were no exclusion criteria.
Patients with increased blood glucose on admission were defined by a cut-off obtained with the statistical anal-ysis described below.
Hypertension, diabetes and hyperlipidaemia were defined as either previously known or on specific therapy. Patients that had smoked during the previous six months were classified as smokers and were self-reported. Estimated glomerular filtration rate (eGFR) was calculated according to the Cockcroft–Gault formula.13 For each patient, a numerical scoring according to the previously described GRACE risk score was calculated from the initial clinical history, electrocardiogram and laboratory values collected on admission.10
Follow-up was obtained for every patient that survived to discharge by reviewing the medical records and/or by tele-phone interview with the patient or family members at 30 days and one year after admission. Follow-up information was obtained in 99.8% of the patients. The study primary endpoint was all-cause mortality at one-year follow-up.
The study complies with the Declaration of Helsinki and informed consent was obtained from all the subjects.
Statistical analysis
Continuous variables are expressed as mean (SD) and groups were compared with Student’s t-test. Categorical variables are expressed as percentage and Pearson’s chi-squared test or Fisher’s exact test were used, whenever appropriate.
Two logistic regression models were fitted to the data, one with the GRACE risk score alone and the other with the inclusion of blood glucose as a continuous variable. Predictive and discriminative abilities of these models were assessed by the Hosmer–Lemeshow goodness of fit test and by the area under the receiver operating characteristic (ROC) curve (AUC), respectively. The former compares the observed frequencies of patients with the event of inter-est with the expected frequencies based on the values of the estimated probabilities obtained by the logistic regression models. In this test, a high p-value (non-significant) indi-cates that the model is performing well and has a good fit. The AUC ranges from 0 to 1 and provides a measure of the model’s ability to discriminate between those subjects who experience the outcome of interest and those who do not. An AUC equal to 0.5 means no classification accuracy. To compare the AUCs from each of these models, the method described by DeLong et al. was used.14
Continuous net reclassification improvement (NRI) and integrated discrimination improvement (IDI) were also cal-culated. The net proportion of patients who died (with events) with higher probabilities of death (NRIevents) and of patients who did not die (without events) with lower prob-abilities of death (NRInon-events), were calculated considering both models. The NRI is the sum of NRIevents and NRInon-events and quantifies the correctness of upward and
downward reclassification or movement of predicted prob-abilities as a result of adding a new marker.15 The IDI is a measure of the improvement in prediction and may be viewed as the difference between improvement in average sensitivity and average 1-specificity.16
Regarding the categorization of blood glucose, mini-mum p-value approach was used. This method obtains the best cut-point from a grid of marker values that is associ-ated with the minimum chi-squared p-value.17 A new logis-tic regression model was fitted considering the GRACE risk score and the categorized blood glucose, as independ-ent variables.
For all comparisons, a p-value ≤ 0.05 was considered statistically significant. Whenever appropriate, 95% confi-dence intervals (CIs) were calculated.
Statistical analysis was carried out using IBM SPSS Statistics, Version 19.0 (IBM Corp., North Castle, NY, USA) and R software.18
Results
From a total of 2216 consecutive patients included in our registry, 2099 had information about admission blood glu-cose and were included in the study, with a mean age of 64 (SD=13) years, 69% males. The population baseline char-acteristics are described in Table 1. The in-hospital, 30-day and one-year mortality rates were 5.1%, 5.8% and 7.8% respectively.
By ROC curve analysis, the AUC of blood glucose for the prediction of one-year mortality was 0.68 (95% CI 0.64–0.72). Univariable analysis showed that blood glu-cose at admission, as a continuous variable, is a predictor of outcome (OR 1.07, 95% CI 1.05–1.08, p < 0.001, per 10 mg/dl increase) and it remained an independent predictor of mortality after adjustment for the GRACE risk score and for the presence of diabetes (OR 1.04, 95% CI 1.02–1.06, p < 0.001).
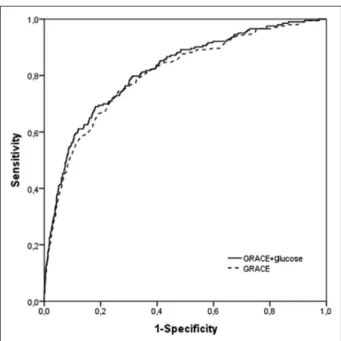
Models with GRACE risk score alone and after inclu-sion of blood glucose were then fitted to the data. The AUC increased significantly after the inclusion of blood glucose in the model (AUC=0.80 vs. AUC=0.82; p=0.018) (Figure 1) as did the goodness of fit (Table 2). Overall, the inclu-sion of blood glucose in a model with GRACE risk score was associated with a NRI of 37%, suggesting effective reclassification. Significant reclassification occurred mainly in the events group. In fact, for NRI non-events, a net 48% of patients who did not die had a sub-stantial and significant reduction of the calculated risk. The IDI again showed that the model performance was improved by adding blood glucose to the GRACE risk score (IDI = 0.021) and, although modest, it was statisti-cally significant.
Aware of the importance of biomarker cut-points in daily clinical practice, minimum p-value approach was used in order to find the blood glucose level that best
discriminates the occurrence of all-cause mortality at one-year follow-up. A value of 160 mg/dl was obtained (Figure 2), with a sensitivity of 62% and a specificity of 68%. Patients with increased blood glucose were older, less often males, and had more risk factors for coronary artery disease, as well as previous stroke/transient ischemic attack (Table 1). They presented more often as a STEMI and with signs of heart failure. Renal insuffi-ciency was more prevalent. They were more often sub-mitted to coronary angiography and had more multivessel disease. Treatment was similar, except for clopidogrel, which was less frequently prescribed in patients with increased admission glucose. Mortality was significantly higher in this group (p<0.001).
Finally, the results of a new logistic regression model showed that blood glucose, as a binary variable, remained a predictor of death independently of the GRACE risk score and the presence of diabetes (OR 1.99, 95% CI 1.40–2.84,
p<0.001).
Discussion
Elevated blood glucose level at admission for myocardial infarction is associated with worse outcome in both non-diabetic and non-diabetic patients.1–9 In fact, in a broad ACS population, hyperglycaemia at admission is a short-term and long-term prognostic marker.1 A high glucose level at admission is often attributed to ‘stress hyperglycaemia’ and might reflect an acute response to the hyperadrenergic state, with catecholamine release and induction of glycog-enolysis.1 It is also associated with the increase in free fatty acids, insulin resistance, inactivation of nitric oxide and the production of oxygen reactive species, generating oxidative stress, as well as enhanced thrombin formation, platelet activation and fibrin clot resistance to lysis.1,19 Hyperglycaemia is associated with impaired coronary flow before reperfusion therapy in ST-elevation myocardial infarction patients.20
A report from the GRACE registry showed that short-term and six-month mortality was increased significantly with higher admission glucose levels in patients across the whole spectrum of acute coronary syndromes.1 This asso-ciation is probably mainly driven by an increased risk of early death, consistent with the paradigm that admission glucose level is a marker of stress rather than a reflection of a general glucometabolic state.21 A U-shaped curve of risk associated with admission glucose level is described, con-sistent with previous reports of adverse outcome associated with low levels (< 100 mg/dl) in patients presenting with an acute myocardial infarction and in diabetic patients with ACS.1,22 It might be related to inadequate stress response. This registry also showed the association between fasting glucose levels and short-term and six-month mortality, sug-gesting that this might be a better independent marker than admission glucose level.1
4 European Heart Journal: Acute Cardiovascular Care
Two previously published papers showed no benefit in risk stratification after ACS with the inclusion of admission blood glucose in a logistic regression model with GRACE risk score. However, the samples were relatively small and in one case only hospital mortality was analysed.11,12
Correia et al. studied a small sample (148 patients) with only non-ST segment elevation ACS.11 There was no benefit in either AUC or NRI. Admission blood glucose was intro-duced directly inside the GRACE risk score model without any type of validation. De Mulder et al. studied a larger sam-ple (550 patients), but the inclusion period was from 2003 to 2006, and does not reflect contemporary treatment.12 Both
AUC and NRI improvement showed a trend, although not of statistical significance. The data from our large and unse-lected population confirmed that admission glucose is an independent predictor of all-cause mortality in the whole spectrum of acute coronary syndromes, even after adjust-ment for diabetic status and GRACE risk score. They also showed significant benefit in risk stratification after the inclusion in a model with the GRACE risk score.
Mere associations with incident all-cause mortality, although important, do not automatically mean that adding a new marker to traditional risk prediction models will improve outcome risk prediction. Therefore, we performed
Table 1. Clinical characteristics of both groups according to glucose levels.
Total
n=2099 Glucose < 160 mg/dln=1361 Glucose ≥ 160 mg/dln=738 p-value
Age (years) 64 ± 13 63 ± 13 66 ± 14 <0.001 Male gender (%) 69.1 71.1 65.3 0.007 Risk factors (%) Hypertension 65.7 63.0 70.7 <0.001 Hyperlipidaemia 49.8 51.5 46.6 0.036 Diabetes 25.5 10.9 52.4 <0.001 Smoking 36.4 40.4 29.0 <0.001 Previous history (%) Myocardial infarction 15.7 15.5 16.1 0.756 PCI 10.5 11.5 8.7 0.055 CABG 4.2 3.7 5.1 0.159 Stroke/TIA 6.3 5.1 8.5 0.002 Initial presentation STEMI (%) 55.1 52.5 59.8 0.002 Killip class >1 (%) 13.1 8.4 21.8 <0.001
Heart rate (beats/min) 78 ± 19 76 ± 18 81 ± 21 <0.001
Systolic blood pressure (mmHg) 133 ± 28 134 ± 28 132 ± 29 0.121 Laboratory data
eGFR < 60 ml/min per 1.73 m2 (%) 28.1 24.2 35.4 <0.001
Blood glucose (mg/dl) 163 ± 82 119 ± 21 244 ± 90 <0.001
GRACE risk score 145 ± 36 138 ± 34 158 ± 36 <0.001
LVEF < 35% (%) 7.5 5.2 11.8 <0.001 Coronary angiography (%) 76.9 75.5 79.5 0.032 Multivessel disease 66.8 63.1 72.7 <0.001 Treatment (%) ASA 97.4 97.7 96.7 0.234 Clopidogrel 93.3 94.1 91.7 0.046 ACEI 86.7 86.3 87.3 0.596 Beta-blocker 81.8 82.4 80.9 0.438 Statin 92.6 93.3 91.2 0.093 PCI 74.6 74.2 75.3 0.607 CABG 1.1 1.0 1.4 0.535 All-cause mortality (%) In-hospital mortality 5.1 2.8 11.2 <0.001 One-year mortality 7.8 5.6 17.2 <0.001
PCI: percutaneous coronary intervention; CABG: coronary artery bypass grafting; TIA: transient ischemic attack; STEMI: ST elevation myocardial infarction; eGFR: estimated glomerular filtration rate; LVEF: left ventricular ejection fraction; ASA: acetylsalicylic acid; ACEI: angiotensin converting enzyme inhibitor
tests to discriminate and calibrate different prediction models. Discriminative analysis of a model with GRACE risk score alone and after admission glucose inclusion showed that the AUC increased significantly. The predic-tive performance also improved. Considering the other new statistical metrics, recently proposed, to quantify the degree of correct reclassification, the inclusion of glucose
in a model with GRACE risk score was associated with a NRI of 37%, suggesting effective reclassification. The new model better identifies the group without events. The IDI again showed that the model performance was signifi-cantly, although slightly, improved by adding glycaemia to the GRACE risk score.
The magnitude of improvement was small. However, in the presence of a fairly robust risk score, such as in the case of the GRACE risk score, the quantitative improvement in model performance introduced by adding new variables to the existing model is expected to be small. Also the new model better identifies those who do not have events than those who do. The new model significantly reduced the cal-culated risk in 48% of those without events. Thus the new model (with the addition of admission blood glucose to GRACE score) is better at identifying ‘truly low-risk’ patients and is as good as in identifying patients who develop events. This might not be ideal when we are evaluating a risk score to identify high-risk patients. However, recent cardio-vascular disease guidelines are encouraging a practice shift toward greater focus on identification of ‘truly low-risk’ patients instead of focusing on identification of high-risk patients. This allows a better selection of patients avoiding unnecessary interventions that might increase costs as well as the risk of procedure-related adverse events.
Limitations
This is a single-centre study, which might limit its conclu-sions. It is also a retrospective study. It might not be applicable to other populations with different baseline char-acteristics. In particular, our population has a predominance of ST elevation myocardial infarction patients, explained by the fact that we are a tertiary centre which receives many patients from other hospitals for primary percutaneous coronary intervention. However, this does not reflect the
Figure 1. ROC curve analysis comparing the GRACE risk
score and the new model with the inclusion of blood glucose (p-value = 0.018).
Table 2. Statistics for model improvement with the addition of
blood glucose. Events (n) 203 Non-events (n) 1896 Continuous NRI (%) cNRIevents –10 (–24 to 3) cNRInon-events 48 (44 to 52) cNRI 37 (23 to 52) IDI statistics IDIevents 0.019 IDInon-events 0.002 IDI 0.021 (0.008 to 0.033) AUC
GRACE risk score 0.80 (0.77–0.84) Combination model 0.82 (0.79–0.85) Difference (p-value) 0.018 Goodness of fit (GRACE risk score)a 0.732
Goodness of fit (combination model)a 0.946
The 95% confidence intervals are shown in parenthesis.
aHosmer–Lemeshow goodness of fit test (p-value).
NRI: net reclassification improvement; IDI: integrated discrimination im-provement; AUC: area under the receiver operator characteristic curve
Figure 2. Resulting plot of minimum p-value approach.
Chi-squared values measuring the association between death at one-year follow-up and dichotomized blood glucose are plotted as a function of different blood glucose cut-points. The shape of the plot suggests the existence of a cut-point at 160 mg/dl.
6 European Heart Journal: Acute Cardiovascular Care
distribution in other cohort studies of ACS and some cau-tion should be used when translating our results for other cohorts.
The cut-off proposed by the present work was not exter-nally validated. However, other authors from Spain and Italy (Mediterranean countries) proposed similar cut-offs (140 mg/ dl and 170 mg/dl, respectively).23–25 Other, Eastern European, countries suggest higher cut-points (≥ 200 mg/dl).26,27 Probably there is some genetic/environmental explanation for these results and local studies seem to be important.
Conclusions
In a population of patients with the whole spectrum of acute coronary syndromes, blood glucose adds prognostic infor-mation to established risk factors, even in combination with the GRACE risk score. A level at admission ≥ 160 mg/dl is an independent predictor of mortality in medium-term fol-low-up. We encourage its wider use.
Conflict of interest
The authors declare that there is no conflict of interest.
Funding
The statistical analysis performed by ALP was supported by the Fundação Nacional para a Ciência e Tecnologia, Portugal – FCT, under the project PEst-OE/MAT/UI0006/2014.
References
1. Sinnaeve PR, Steg PG, Fox KAA, et al. Association of ele-vated fasting glucose with increased short-term and 6-month mortality in ST-segment elevation and non-ST-segment elevation acute coronary syndromes. Arch Intern Med 2009; 169: 402–409.
2. Timmer JR, van der Horst IC, Ottervanger JP, et al., on behalf of Zwolle Myocardial Infarction Study Group. Prognostic value of admission glucose in non-diabetic patients with myocardial infarction. Am Heart J 2004; 148: 399–404.
3. Otten R, Kline-Rogers E, Meier DJ, et al. Impact of predia-betic state on clinical outcomes in patients with acute coro-nary syndrome. Heart 2005; 91: 1466–1468.
4. Rocha S, Nabais S, Magalhães S, et al. Admission glycemia: A predictor of death after acute coronary syndrome in non-diabetic patients? Rev Port Cardiol 2007; 26: 1367–1377. 5. Svensson AM, McGuire DK, Abrahamsson P, et al.
Association between hyper- and hypoglycaemia and 2 year all-cause mortality risk in diabetic patients with acute coro-nary events. Eur Heart J 2005; 26: 1255–1261.
6. Capes SE, Hunt D, Malmberg K, et al. Stress hyperglyce-mia and increased risk of death after myocardial infarction in patients with and without diabetes: A systematic overview.
Lancet 2000; 355: 773–778.
7. Monteiro S, Monteiro P, Gonçalves F, et al. Hyperlycemia at admission in acute coronary syndrome patients: Prognostic value in diabetics and non-diabetics. Eur J Cardiovasc Prev
Rehabil 2010; 17: 155–159.
8. Norhammar A, Tenerez A, Nilsson G, et al. Glucose metabo-lism in patients with acute myocardial infarction and no pre-vious diagnosis of diabetes mellitus: A prospective study.
Lancet 2002; 359: 2140–2144.
9. Stranders I, Diamant M, van Gelder RE, et al. Admission blood glucose level as risk indicator of death after myocar-dial infarction in patients with and without diabetes mellitus.
Arch Intern Med 2004; 164: 982–988.
10. Fox KA, Dabbous OH, Goldberg RJ, et al. Prediction of risk of death and myocardial infarction in the six months after presentation with acute coronary syndrome: Prospective multinational observational study (GRACE). BMJ 2006; 333: 1091–1094.
11. Correia LC, Rocha MS, Bittencourt AP, et al. Does acute hyperglycemia add prognostic value to the GRACE score in individuals with non-ST elevation acute coronary syn-dromes? Clin Chim Acta 2009; 410: 74–78.
12. de Mulder M, van der Ploeg T, de Waard GA, et al. Admission glucose does not improve GRACE score at 6 months and 5 years after myocardial infarction. Cardiology 2011; 120: 227–234.
13. Cockcroft DW and Gault MH. Prediction of creatinine clear-ance from serum creatinine. Nephron 1976; 16: 31–41. 14. DeLong ER, DeLong DM and Clarke-Pearson DL.
Comparing the areas under two or more correlated receiver operating characteristic curves: A nonparametric approach.
Biometrics 1988; 44: 837–845.
15. Pencina MJ, D’Agostino RB and Steyerberg EW. Extensions of net reclassification improvement calculations to measure usefulness of new biomarkers. Stat Med 2011; 30: 11–21. 16. Huang Y, Pepe MS and Feng Z. Evaluating the predictiveness
of a continuous marker. Biometrics 2007; 63: 1181–1188. 17. Mazumdar M and Glassman JR. Tutorial in biostatistics –
categorizing a prognostic variable: Review of methods, code for easy implementation and applications to decision-making about cancer treatments. Stat Med 2000; 19: 113–132. 18. R Core Team (2013). R: A language and environment for
sta-tistical computing. R Foundation for Stasta-tistical Computing,
Vienna, Austria. ISBN 3-900051-07-0, URL http://www. R-project.org/.
19. Undas A, Wiek I, Stepien E, et al. Hyperglycemia is associ-ated with enhanced thrombin formation, platelet activation, and fibrin clot resistance to lysis in patients with acute coro-nary syndromes. Diabetes Care 2008; 31: 1590–1595. 20. Timmer JR, Ottervanger JP, de Boer MJ, et al. Zwolle
Myocardial Infarction Study Group. Hyperglycemia is an important predictor of impaired coronary flow before rep-erfusion therapy in ST-segment elevation myocardial infarc-tion. J Am Coll Cardiol 2005; 45: 999–1002.
21. Zeller M, Cottin Y, Brindisi MC, et al. Impaired fasting glu-cose and cardiogenic shock in patients with acute myocardial infarction. Eur Heart J 2004; 25: 308–312.
22. Pinto DS, Skolnick AH, Kirtane AJ, et al. TIMI Study Group. U-shaped relationship of blood glucose with adverse out-comes among patients with ST-segment elevation myocardial infarction. J Am Coll Cardiol 2005; 46:178–180.
23. Sanjuán R, Nunez J, Blasco ML, et al. Prognostic implica-tions of stress hyperglycemia in acute ST elevation myo-cardial infarction. Prospective observational study. Rev Esp
24. Lazzeri C, Valente S, Chiostri M, et al. In-hospital peak glyce-mia and prognosis in STEMI patients without earlier known diabetes. Eur J Cardiovasc Prev Rehabil 2010; 17: 419–423. 25. Corrada E, Cappelleri A, Belli G, et al. Admission glyce-mia and markers of inflammation are independent outcome predictors in primary PCI in non-diabetic patients. Minerva
Cardioangiol 2008; 56: 445–452.
26. Kazberuk AT, Kozuch M, Malyszko J, et al. What level of hyperglycaemia on admission indicates a poor prognosis in patients with myocardial infarction treated invasively?
Kardiol Pol 2012; 70: 564–572.
27. Bronisz A, Kozinski M, Magielski P, et al. Stress hypergly-caemia in patients with first myocardial infarction. Int J Clin