Outubro, 2019
Orientador: Manuel J. Mendes, Professor Assistente,
Faculdade de ciências e tecnologias, Universidade NOVA de Lisboa
Co-orientador: Doutora Ana Reis Machado, Investigadora Auxiliar,
Faculdade de ciências e tecnologias, Universidade NOVA de Lisboa
Júri:
Presidente: Doutor Luís Miguel Nunes Pereira
Arguente: Doutor Carlos Manuel Faria de Barros Henriques
Vogal: Doutor Manuel João de Moura Dias Mendes
André Castanheira Lourenço
[Nome completo do autor]
[Nome completo do autor]
[Nome completo do autor]
[Nome completo do autor]
[Nome completo do autor]
[Nome completo do autor]
[Nome completo do autor]
Licenciado em Engenharia de Micro e Nanotecnologias
[Habilitações Académicas] [Habilitações Académicas] [Habilitações Académicas] [Habilitações Académicas] [Habilitações Académicas] [Habilitações Académicas] [Habilitações Académicas]
Sunlight-driven CO
2
-to-fuel conversion:
exploring thermal and electrical coupling
between photovoltaic and electrochemical
systems for optimum solar-methane production
[Título da Tese]
Dissertação para obtenção do Grau de Mestre em
Engenharia de Micro e Nanotecnologias
Dissertação para obtenção do Grau de Mestre em
iii
Sunlight-driven CO2-to-fuel conversion: exploring thermal and electrical coupling between photovoltaic and electrochemical systems for optimum solar-methane production Copyright ©André Castanheira Lourenço, Faculdade de Ciências e Tecnologia, Universidade Nova de Lisboa.
A Faculdade de Ciências e Tecnologia e a Universidade Nova de Lisboa têm o direito, perpétuo e sem limites geográficos, de arquivar e publicar esta dissertação através de exemplares impressos reproduzidos em papel ou de forma digital, ou por qualquer outro meio conhecido ou que venha a ser inventado, e de a divulgar através de repositórios científicos e de admitir a sua cópia e distribuição com objetivos educacionais ou de investigação, não comerciais, desde que seja dado crédito ao autor e editor.
v
Acknowledgments
Em primeiro lugar gostaria de agradecer ao Professor Doutor Rodrigo Martins, como presidente do Departamento de Ciência dos Materiais, e à Professora Doutora Elvira Fortunato, como Diretora do Centro de Investigação de Materiais, por todo o apoio e dedicação do DCM, CENIMAT e do curso de Engenharia de Micro e Nanotecnologias, que me permitiram crescer e formar como pessoa nos últimos 5 anos. Um agradecimento especial ao Prof. Manuel J. Mendes, meu orientador, e à Dra. Ana Reis Machado, minha coorientadora, pela oportunidade de trabalhar neste tema inovador e pela ajuda prestada sempre que a solicitei.
Quero agradecer também ao DCM e a todos os professores que me habilitaram com as ferramentas necessárias que me tornaram num engenheiro.
Um muito obrigado aos colegas de curso, em especial ao meu grupo mais próximo, Pedro, Carlos e Jorge, que tornaram tudo mais fácil, mas também ao Fábio Vieira que, já tendo trabalhado neste tema, se mostrou sempre disponível para me ajudar.
vii
Abstract
Artificial photosynthesis is regarded as the best way to protect the environment while producing carbon-based fuels, because it closes the anthropogenic carbon cycle. Herein we simulate a Photovoltaics-Electrochemical (PV-EC) system capable of converting CO2 into usable carbon-based
fuels, in order to analyse the implementation of synergetic techniques such as intermediate electronic regulation and thermal coupling on the improvement of the energetic performance. We proved that, when thermally coupled, the two cells of the system exhibit a symbiotic behaviour: the solar-to-fuel efficiency stays almost temperature-independent due to improved reaction kinetics which compensates for photovoltaic thermal losses. The electronic regulation is equally important to enhance efficiency because it guarantees that we make use of the full PV power output to the EC load. These solutions are tested in two pathways for methane production: 1-step, CO2→CH4, and 2-step, CO2→Syngas→CH4,
exhibiting solar-to-fuel efficiency gains up to 586% and 43%, respectively, when compared with the systems without both the thermal coupling and the DC-to-DC converter. Lastly, an energetic comparison of the two pathways was made. The direct production (1-step) of methane showed to provide 20% less energy than the second path, where syngas is produced and converted to methane through a Fischer-Tropsch synthesis at 350 °C and 10 atm.
Keywords: Artificial Photosynthesis, Solar-powered Fuel synthesis; CO2 Electrochemical reduction;
Photovoltaic-Electrochemistry Thermal coupling; DC-to-DC converter; Fischer-Tropsch synthesis; Analytical Modelling of Solar Fuel generation
xix
Resumo
A fotossíntese artificial é considerada a melhor maneira de proteger o ambiente enquanto se produz combustíveis à base de carbono porque fecha o ciclo antropogénico do carbono. Neste trabalho simulamos um sistema Fotovoltaico-Eletroquímico (PV-EC) capaz de converter CO2 em combustíveis
usáveis à base de carbono, de maneira a analisar a implementação de técnicas sinergéticas, como é o caso da regulação eletrónica e o acoplamento térmico, na melhoria de performance do sistema. Provou-se que quando o sistema está termicamente acoplado as duas células exibem um comportamento simbiótico: a eficiência fica praticamente independente da temperatura devido às melhorias na cinética da reação, que vão compensar as perdas térmicas do fotovoltaico. A regulação eletrónica é igualmente importante no aumento da eficiência porque garante que conseguimos usar toda a energia fornecida pelo PV no favorecimento da reação eletroquímica. Estas soluções são testadas em dois métodos alternativos para a produção de metano: processo a 1-passo, CO2→CH4, e a 2-passos, CO2→Syngas→CH4, exibindo ganhos na eficiência total de 586% e 43%, respetivamente, comparando com o sistema sem acoplamento térmico nem usando conversor de DC-para-DC. Por fim a comparação energética dos dois métodos foi feita. A produção direta de metano (processo a 1-passo) mostrou ser 20% menos energética que a outra alternativa, onde o gás de síntese é produzido e convertido em metano através do processo de Fischer-Tropsch nas condições de 350 °C e 10 atm.
Palavras-Chave: Fotossíntese Artificial; Produção de combustível usando energia solar; Célula Eletroquímica alimentada por energia solar; Redução eletroquímica de CO2; Acoplamento térmico
Fotovoltaico-Eletroquímico; Conversor DC-para-DC; Síntese de Fischer-Tropsch; Modelação analítica da produção de combustível usando energia solar;
xxi
Contents
Introduction... 1
1.1 Electrochemical considerations ... 2
1.2 Photovoltaic and Electrolyser integration ... 3
1.3 Fischer-Tropsch synthesis ... 5
Methods and Model Description ... 7
2.1 Electrochemical model ... 7
2.2 Photovoltaic model ... 9
2.3 Fischer-Tropsch (FT) model ... 10
Results and Discussion ... 11
3.1 Electrochemical reactions ... 11
3.1.1 Methane electrolyser (1-step process: CO2 → Methane) ... 11
3.1.2 Syngas electrolyser (2-step process: CO2 → Syngas) ... 13
3.2 Solar cells ... 15
3.3 Photovoltaic-Electrochemical (PV-EC) thermal coupling ... 17
3.4 Process efficiency ... 18
3.5 Fuel production ... 20
3.6 Intermediate electronic regulation ... 22
3.7 Fischer-Tropsch synthesis (FTS) and energetic comparison of processes ... 25
3.8 Building integration study ... 28
xxii Future Perspectives ... 30 References ... 31 Appendix I ... 34 Appendix II ... 37 Annex I ... 40 Annex II ... 41 Annex III ... 42
xxiii
List of Figures
Figure 1.1 – Photovoltaic-powered paths of reaction studied to obtain methane from CO2 and water.
The top scheme is the 1-step reaction, where methane is obtained right after the EC process. The bottom path is the 2-step process, which requires two reactions: a first one that produces an intermediate product called syngas (combination of CO and H2), and a second (FT synthesis) that from
syngas, using high temperature and pressure, obtains methane. The picture also shows some consumer applications for the “solar methane” produced. ... 2
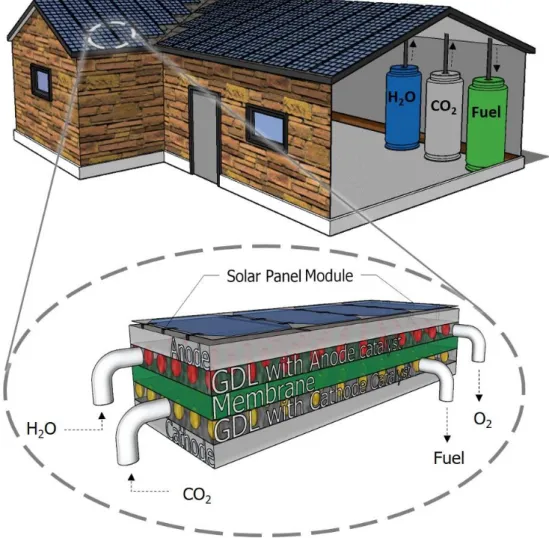
Figure 1.2 – Representation of a possible implementation of the integrated PV-EC system (i.e. EC integrated beneath solar panels, on the house’s roof). The attachment of the EC cells to the rear of the solar cells allow thermal coupling between the PV and EC for better combined performance. The close-up of the PV-EC system shows the assembly: EC system based on PEM and MEA assembly, without liquid electrolyte and with catalysts, for selectivity improvements. The gas inlets and outlets are connected to gas bottles inside the house. ... 4
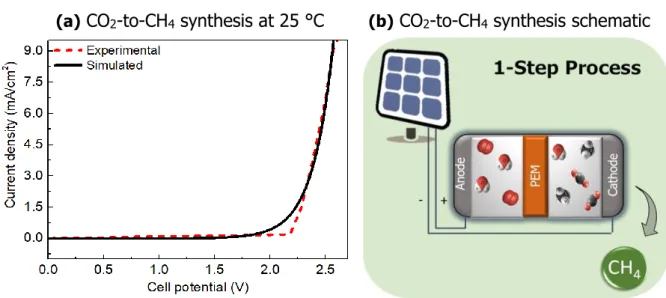
Figure 3.1 – Carbon dioxide to methane EC synthesis: (a) – Experimental [7] and simulated curves at 298 K for the methanation process; (b) - Schematic of the process: connected PV and EC systems to produce methane. Voltage values are presented in absolute value. ... 12
Figure 3.2 –CO2 to syngas (CO + H2) synthesis: (a) - Experimental [8] and simulated curves at 298 K
and 328 K which show the success of the implemented model at different temperatures; (b) - Schematic of the process: connected PV and EC systems to produce syngas. Voltage values are presented in absolute value. ... 13
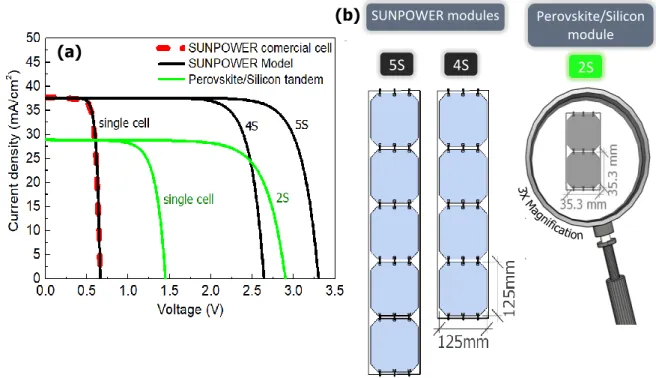
Figure 3.3 – Solar cells considered in the simulations: (a) - Solar cells’ JV curves representation at 1000 Wm-2, AM 1.5G and 298 K. In green we have the JV curves of a single and 2 series-connected
(2S) Perovskite/Silicon tandem cells. The mono-Si arrangements, based on SUNPOWER cells, are represented by the black curves: it shows the JV curves of a single cell and modules of 4 series-connected (4S) and 5 series-series-connected (5S) cells. Our model for SUNPOWER cell exhibits a perfect fit with its experimental data (in dashed red). SUNPOWER datasheet provided in Appendix I; (b) – sketches of the modules with the different series-connected PV cells, showing their respective size. ... 15
Figure 3.4 - Simulation of the PV (i.e. Si) and EC (i.e. syngas electrolyser) systems for 3 different temperatures: 298 K, 328 K, 358 K: (a) – is the uncoupled system; (b) – is the thermally coupled system. The solar maximum power points (MPP) and operating points (OP) are represented at each curve. We represented a Si-syngas system, but the others operate accordingly. ... 18
Figure 3.5 – Solar-to-fuel efficiencies of the studied electrolysers : Plots (a) and (b) show the EC and PV efficiency, respectively, for the two electrolysers in combination with the two types of PV (mono-Si
xxiv
and Perovskite/Si). Plots (c) and (d) show the overarching solar-to-fuel efficiency - the curves in blue correspond to the CO2-to-syngas electrolyser, which will be responsible to produce multiple CO:H2
ratios depending on the cathode constitution, and the curves in green correspond to the CO2
-to-methane electrolyser. A comparison between Thermally Coupled (TC) and Thermally Uncoupled (NoTC) systems is made, where the uncoupled systems show decreasing efficiency with increasing temperature. Plots (c) and (d) differ in the type of solar cells used. In (c) we tested a module of 2 Perovskite/Si tandem (double junction) cells connected in series while in (d) we used a module of 4 (for syngas) or 5 (for methane) monocrystalline Silicon cells from SUNPOWER connected in series. . 19
Figure 3.6 – Total mass of gas fuel produced from both electrolysers. Multiple CO:H2 ratios were simulated. Results of both thermal coupled (TC) and uncoupled (NoTC) systems are presented. Each colour represents a different apparatus of EC cell to output the desired gas. A Faradaic efficiency of 96.7% is taken for the syngas electrolyser [9], while for CH4 we assumes 80% [40]. ... 21
Figure 3.7 – Results of the use of a DCDC converter between PV and EC for 50 ºC: (a) - Methodology used for DCDC converter tests/simulations. By identifying the maximum power point (MPP) of the PV we can trace the equivalent power line (dashed black) and find a better Operating Point (OP); (b) - mass and solar-to-fuel efficiency with and without the DCDC converter for the mono-Si and Perovskite/Si cell, respectively. The values at each point represent the improvement (in percentage) allowed by the DCDC converter. The points without number did not have significant improvements. 24
Figure 3.8 – Annual fuel energy equivalent production powered by Perovskite/Si cells, (a), and mono-Si cells, (b). The red curve shows the energetic capability of syngas in the 2-step process, after the EC stage. The pink part with three tonalities corresponds to the complete 2-step process, where the curve is the energy harvested in methane form, after the FTS process, and the pink filled areas represent the FTS process losses to obtain methane: the darkest part right below the curve is the energetic cost to increase temperature while the rest (the main cost) comes from pressure increase, being the middle pink region for 10 atm and the lighter region for 30 atm. Everything considered, the 2-step final energy (in methane) at 30 atm is lower than the 1-step process (curve in black). ... 27
Figure A. 1 - total efficiency as a function of temperature for comparison of the system with and without DCDC converter. ... 36
Figure A. 2 - production over area ratio as a function of temperature for comparison of the system with and without DCDC converter. ... 39
Figure A. 3 - Datasheet for B50 Solar Cell by SUNPOWER. ... 40 Figure A. 4 – EC current density versus Voltage (vs RHE) from Manthiram et al. work [7]. ... 41 Figure A. 5 – EC current density versus Voltage (vs RHE) at different temperatures from Kutz et al. work [8]. ... 42
xxv
List of tables
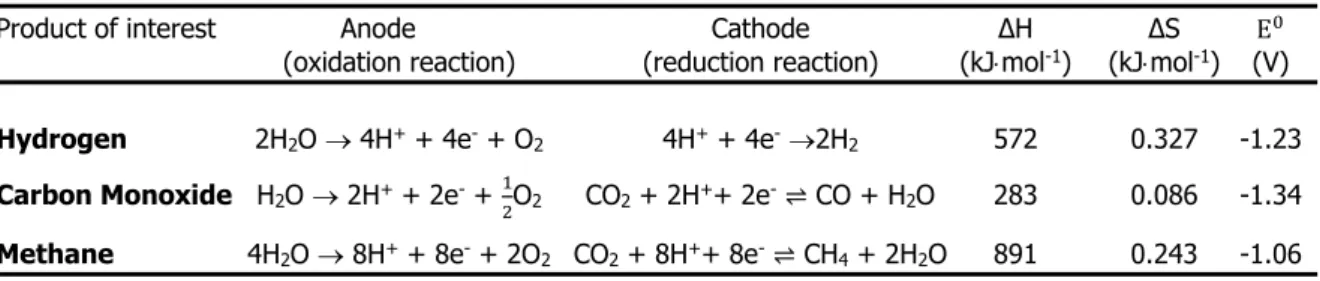
Table 2.1 - Half-cell reactions for each considered product. From it, we calculate the Gibbs energy variation (products - reactants) from tabulated values of the formation enthalpy and entropy. Finally, the cell potential (E0) is calculated assuming T = 298 K [5]. ... 8
Table 3.1 - Parameter set used in the methane electrolyser’s model to fit the experimental results. 12 Table 3.2 – Parameter set used in the syngas electrolyser’s model to fit the experimental results. . 14 Table 3.3 – Parameters used in the solar cell model for both mono-Si (SUNPOWER) cell and Perovskite/Si double junction cell. Working conditions of 1000 Wm-2, AM 1.5G illumination and 298 K.
... 16 Table 3.4 – Representation of the characteristic parameters of the different PV modules studied. The Perovskite/Si double-Junction 2-series cell (2S) module was used to obtain all the products. For Monocrystalline-Si, the 4-series cell (4S) module is used in syngas while the 5 series cell (5S) module is used in methane production only. Solar efficiency is calculated based on the MPP, to be independent of any load. ... 17
Table 3.5 – Production over area ratio (POAR) for the two production mechanisms at the different PV conditions. Results are given for three different PV temperatures: 25 °C, 55 °C, 85 °C. The syngas values show the results for independent production of CO and H2 (which have the same rate, since the
cathode selectivity is about the same) and for simultaneous production of CO and H2 at the proportion of 1:3. ... 22
Table 3.6 – Production-over-area ratio (POAR) using DCDC converter and its gain (in %) compared with the system with only thermal coupling (without DCDC) and the system without both thermal coupling and DCDC. Results are given for both types of electrolysers. ... 25
xxvii
Symbols
Linear parameter
AM
Air mass Coefficient
E
0Thermodynamic cell potential (V)
I
0Saturation current (A)
I
phLight generated current (A)
I
scShort-circuit current (A)
J
0Exchange current density (mAcm
-2)
J
0refCurrent density at the reference temperature (mAcm
-2)
K
BBoltzmann constant (JK
-1)
m
iMass of the specie i (g)
M
iMolar mass of species i (gmol
-1)
N
sNumber of solar cells in series
P
iPressure at the condition i
R
pShunt resistance (Ω)
R
sSeries resistance (Ω)
s
iStoichiometric coefficient of this specie i
T
refReference Temperature (K)
V
iVolume at the condition i
V
opOperational voltage (V)
V
TThermal voltage (V)
α
aAnodic transfer coefficient
α
𝑐Cathodic transfer coefficient
η
ECElectrochemical efficiency
xxviii
η
𝑑diode ideality/quality factor
C
Specific heat (kJKg
-1K)
E
Cell potential (V)
Ea
Activation energy (Jmol
-1)
F
Faraday’s constant (Cmol
-1)
G
Solar irradiance (Wm
-2)
I
Working current (A)
J
Current density (mAcm
-2)
m
Exponent parameter
n
Number of electrons involved in the reaction
q
Electronic charge (C)
Q
Heat (J)
R
Gas constant (JK
-1mol
-1)
T
Working temperature (K)
t
Production time (s)
V
Applied voltage (V)
ΔH
Enthalpy variation (kJmol
-1)
ΔS
Entropy variation between products and reactants (kJmol
-1)
η
Overpotential (V)
xxix
Acronyms
PV
Photovoltaic
EC
Electrochemical
PEC
Photoelectrochemical
FTS
Fischer-Tropsch Synthesis
FT
Fischer-Tropsch
SPE
Solid Polymer Electrolyte
MEA
Membrane Electrode Assembly
Mono-Si
Monocrystalline Silicone
GDL
Gas Diffusion Layer
CO2RR
CO
2Reduction Reaction
GHG
Greenhouse Gas
SHE
Standard Hydrogen Electrode
EE
Electric Efficiency
RHE
Reversible Hydrogen Electrode
MPP
Maximum Power Point
OP
Operating Point
TC
Thermal Coupling
NoTC
No Thermal Coupling
EE
PVSolar-to-electricity efficiency
EE
Electrochemical Efficiency
POAR
Power Over Area Ratio
DCDC
DC-to-DC converter
LHV
Lower Heating Value or net calorific value
xxxi
Motivation and Objectives
The increasing demand for energy, which followed the industrial revolution and world’s population increase, favours the continuous use of fossil fuels, since this is a mature energy source, the technologies for its exploitation are also mature and yields excellent energy vectors (natural gas, gasoline, diesel). However, such increasing demand stresses our planet with the ever-increasing greenhouse gas emissions, which calls for more environmentally friendly approaches. Solar energy is in a good place to replace the fossil fuels, not only because exploiting only 0.01% of the total solar power that reaches Earth would be enough to cover the global consumption, but also because this technology is now reaching a point of maturity where the cost per kWh (after diminishing in the last decades) is now close to the cost from the grid. Unfortunately, problems regarding its intermittency, storage and transport have slowed the deployment of this technology. By getting the best of the two worlds, artificial photosynthesis shows to be a better approach, as Figure 1 depicts [1]. It combines a solar harvesting mechanism (photovoltaics) with a chemical “reactor” (electrochemical cell) to produce carbon-based fuels (i.e. solar fuels) from solar energy, water and even from gas emissions (e.g. CO2 captured from exhaust as the carbon source). This way, it will still be possible to satisfy the energetic demand for the next decades without increasing the amount of greenhouse gases in the atmosphere. This work aims to module and study this type of process: to understand the best way to integrate the two systems, how temperature influences production and if it is possible to place a system like this in everyone’s homes. Methane production will be the main purpose of our study since it is widely used in building applications, which are the leading energy consumers in Europe (40%) [2], [3].Figure 1 – solar fuels production cycle. Water, CO2 and solar energy as input
1
Introduction
The present energetic and environmental issues that we are facing in a global scale have shown that the future of our society’s primary power source should be clean and renewable, such as wind and solar energies. However, despite the energy per hour provided by those sources being more than enough to our yearly necessities (~16 TW) [4], the mechanisms to extract power from them are not yet efficient enough to surpass the carbon-based fuels. Moreover, the lack of cost-effective technologies (normally batteries) to store their intermittent power supplies makes the energy difficult to transport and distribute (i.e. providing solar converted electricity to a country with low solar irradiance would be difficult). Also, fuels allow much higher density (e.g. ~50 MJKg-1 for Natural Gas) than batteries (~1MJKg-1 for advanced Li-batteries) and does not degrades as fast [5]. Therefore, nowadays, we still
depend too much on Carbon-based fuels which magnifies the global warming problem. In Europe, for example, buildings are responsible for the highest energetic consumptions and carbonic footprint (40%). From it, 79% is due to the space heating and hot water provision, which are mainly generated from fossil fuels-based energy sources (84% - only 16% use of renewable energies) [2], [3].
Thus, once carbon-based fuels will remain in our lives for the next decades, one can find sustainable ways to produce and even reutilize them. That is the aim of this work: to use sunlight to power processes that contribute to the reduction of CO2 emissions and transform it into usable carbon-based
gases/fuels. An idea as novel and sustainable as a CO2 recycling mechanism using solar energy could
mitigate the current energetic and environmental issues for the well-being of future generations. Fuels generated by artificial photosynthesis processes, also known as solar-fuels, are in the base of such ideas. It relies in a combination of a Photovoltaic (PV) system and CO2 flow of gas to feed an
electrochemical (EC) system that synthesises the required carbon-based fuel. In an alternative approach, photoelectrochemical (PEC) devices, have the photoabsorber/photovoltaic material directly in contact with the catalyst and inside the electrolyte. Although being a more compact approach with a single device, this leads to excessive exposure of the semiconductor and consequent fast degradation [6], [7]. Consequently, PV-EC systems which simply integrate separate PV and EC components are a better solution, not only from the point of view of longevity but also for optimization purposes since we can trim both systems independently. As such, in this work we will focus on PV-EC systems.
This thesis will mainly focus on the production of CH4 since it is the main constituent of Natural Gas,
which gathers a set of important characteristics: (1) has high energy density, ~50 MJKg-1; (2) it is a
conceptually simple, easy-to-obtain hydrocarbon; (3) infrastructures for its use and storage are already in place; (4) has many uses in our society, mainly at the residential level which is the main cause for the carbonic footprint. As such, a cleaner methane production process would create a higher impact in our society, in comparison with other fuels. We compared methane production from two different routes: 1) by a direct EC production (1-step process), and 2) via the synthesis of syngas intermediate followed by a Fischer-Tropsch (FTS) reaction (2-step process), both presented in Figure 1.1. The electrochemical reactions involving these processes are the following [5]:
2
Syngas production reactions: CO2 + H2O ⇌ CO + H2O + 1
2O2 (1)
2H2O ⇌ 2H2 +O2 (2)
Methane production reaction: CO2 + 2H2O ⇌ CH4 + 2O2 (3)
Simulations will be made considering a Solid Polymer Electrolyte (SPE) in a Membrane Electrode Assembly (MEA) that can directly produce methane or syngas (that is, a combination of CO and H2) at
tunable ratios, allowing further transformation of products in usable fuels. Our EC components were based on the most state-of-the-art papers that we could find in literature [8], [9], and the PV systems were simulated according to both commercially available solar Monocrystalline-Silicone (mono-Si) cells (SUNPOWER – datasheet presented in Appendix I) and an advanced, close to theoretical limits, Perovskite/Silicon tandem cell (which we always refer as Perovskite/Si cell). The latter uses a double junction which allows for efficiency improvements. The high bandgap Perovskite top sub-cell absorbs high energy photons (from UV and Visible spectrum) while the bottom Silicon sub-cell makes use of the remaining visible and near-infrared light. Light trapping is also considered, which improves the amount of light converted in photonic solutions [10]–[13]. For 1000 Wm-2, AM (air mass coefficient) of 1.5G
irradiation(1-Sun) and 298 K this cell has an open-circuit voltage of 1.45 V and a short-circuit current of 28.9 mAcm-2, giving an efficiency of 30.9 %.
1.1 Electrochemical considerations
Over the years many efforts have been made in this field which makes possible to identify key factors for a successful, affordable and efficient EC system [6], [14], [15]: (a) Temperature; (b) Pressure; (c) pH;
Figure 1.1 – Photovoltaic-powered paths of reaction studied to obtain methane from CO2 and water. The top
scheme is the 1-step reaction, where methane is obtained right after the EC process. The bottom path is the 2-step process, which requires two reactions: a first one that produces an intermediate product called syngas (combination of CO and H2), and a second (FT synthesis) that from syngas, using high temperature and pressure,
3
(d) Electrodes and catalyst constitution (activity and selectivity); (e) Overpotentials; (f) Type of electrolyte and assembly; (g) electrochemical cell design; (h) stability over time; (i) Economic viability.
Usually high temperature and pressure facilitates the chemical reaction but require a more robust and less affordable apparatus. However, the higher costs of working at higher pressure may be compensated by increased energy efficiencies, due to minimization of intermediate compression steps and the direct coupling of downstream high pressure processes [16], [17]. The use of different electrodes and catalysts could influence both the overpotential of the process, sometimes making it more energetically consuming, and the pathway of the reaction, outputting different products such as methane (CH4), ethanol (CH3CH2OH), carbon monoxide (CO),
hydrogen (H2) and other compounds (e.g. Ag and Zn for CO, Cu for CH4, Ni for H2) [18]. The control of pH, as
performed by Masel et al. [19], allows for a very high tunability of the cell’s products but requires a watertight cell design is neither the most efficient nor convenient. Moreover, the change of cell design brought significant improvements. Instead of using the typical “H-cell” design, researchers started using flow cells that allowed constant circulation of products and reactants, reducing previous limitations with mass transportation [15]. Some works also refer that the removal of liquid electrolytes is beneficial. Liquid electrolytes necessitate a first diffusion of CO2 before the reaction can occur, but CO2 has low solubility limits in aqueous media (current density limited
to 30 mA·cm-2). Instead, a flow of hydrated carbon dioxide reacts in the gas phase [15], [20].
Accordingly, the migration to structures of the type membrane electrode assembly (MEA) assisted by gas diffusion layers (GDL), as shown in Figure 1.2, to facilitate the flow of elements permits reaching much higher current densities (around 200 mA·cm-2) in the CO2 reduction reaction (CO2RR).Many works have been
undertaken in the past decades related with the production of H2 from PV-EC, since it is an easy product to obtain
and the process can easily reach 100% selectivity, but H2 is a highly volatile gas which is hard to safely store and transport. So, other products are more promising, which are the cases of CH4 and syngas. Syngas is a combination
of CO and H2 and is very useful as an intermediate product, as it is quite versatile, normally used to obtain other
hydrocarbons like CH4 by the Fischer-Tropsch (FTS) process [21]–[27]. Exploring the production of CH4 is also
very important because, as mentioned before, heat provision in buildings is presently the most energy-consuming activity in developed countries, and it depends mostly on CH4 (Natural Gas) [28], [29]. Also, its demand will
increase since Europe intends to reduce greenhouse gas (GHG) emissions by 80% to 95% by 2050, and it is only possible to do so through replacing current heating systems by gas-based ones [28]. Being able to produce it from a sustainable process could be an important step to reduce our environmental footprint even faster.
1.2 Photovoltaic and Electrolyser integration
There are several important aspects to take into consideration when connecting two independent PV & EC systems. Firstly, we must guarantee that both systems are state-of-the-art so they can have the highest efficiencies possible. Secondly, the connection must have minimum losses and the working point must be wisely chosen so we can transfer all the power obtained by the PV system to the EC cell. This tuning can be achieved either by manipulating the ratio of areas of the two parts, and/or simply by implementing a DC-DC converter. This way we guarantee that the full power provided by the PV is provided to the EC load, in order to produce the
4
highest possible quantity of products. Finally, we benefit from symbiotic behaviour when integrating/connecting both systems. As it is well known, solar cells lose efficiency for increasing temperatures. On the other hand, the EC reactions considered in this work are endothermic processes (ΔH > 0), meaning that temperature increases favour the yield of products (Le Chatelier’s Principle). Consequently, by thermally coupling both systems, it is possible to achieve higher efficiencies and more stability over a wide temperature range. Our results will show that the efficiency variations can go up to 29% when the systems are not coupled. These results support the idea of building a compact system to be implemented on the rooftop, as sketched in Figure 1.2. This strategy will turn the disadvantages of individual systems into competitive advantages of the system under study.
Previous works have addressed similar aspects, but not as performed in this work. In our we try to complement previous experimental works - that normally only focuses one element of the PV-EC system that we discussed before (either PV or EC or integration or implementation) - by analysing the state-of-the-art systems from all the perspectives in order to anticipate a real-life application. For example, Schreier et al. [14] created a PEC system with liquid electrolyte that could reach 13.4% of efficiency but misses an analysis on the implementation. Other
Figure 1.2 – Representation of a possible implementation of the integrated PV-EC system (i.e. EC integrated beneath solar panels, on the house’s roof). The attachment of the EC cells to the rear of the solar cells allow thermal coupling between the PV and EC for better combined performance. The close-up of the PV-EC system shows the assembly: EC system based on PEM and MEA assembly, without liquid electrolyte and with catalysts, for selectivity improvements. The gas inlets and outlets are connected to gas bottles inside the house.
5
work developed at our centre [27] with the same intentions as us, shows efficiency of 13.26% but without the stability over the temperature range that we manage to have and without obtaining the solar-to-fuel efficiencies of 18% that we manage to reach.
1.3 Fischer-Tropsch synthesis
To compare the two processes depicted in Figure 1.1, it is important to analyse them not only from the production point of view (efficiency and mass of gas supplied), but also from the energetic balance point of view. Taking another look to Figure 1.1, in the 1-step process the output can be directly used for consumption while the second path needs syngas conversion by the Fischer-Tropsch process which will require some energy input besides gases. The methanation reaction is the following [25]:
CO + 3H2 ⇌ CH4 + H2O (4)
It relies on the manipulation of Temperature, Pressure, proportion of input gas(es) and catalyst constitution to form the desired hydrocarbons, since they control the degree of polymerization and the distribution of products [26].From the thermodynamic point of view, we can conclude that low temperature, high pressure and precise CO:H2 proportion (3:1, in this case) facilitates the reaction. However, the reaction requires catalysts
to promote the reaction and avoid the production of unwanted by-products. Catalysts are not as active at low temperatures as they are at high temperatures, making very-low temperature (below 300 °C) FTS process a challenge [23]. Also, every catalyst will behave differently, so it is not only important to consider its activity but also its selectivity towards methanation. Important metals for the methanation process have been found to be Ru, Ni, Co, Fe and Mo which can be compared as follows [22], [25]:
Activity: Ru > Fe > Ni > Co > Mo
Selectivity: Ni > Co > Fe > Ru
The most desirable metals are ruthenium and iron, due to their relatively high activity and low price, respectively. However, cost and low selectivity in the first case and selectivity in the second, make them unsuitable for direct use without proper filtering. Molybdenum shows low activity and is more selective towards C2+ hydrocarbons, which we want to avoid. Between Nickel and Cobalt, Ni takes advantage in all factors,
meaning it is the most adequate metal for the methanation process. Also, Ni performance can be improved by increasing the pressure [22].Gao et al. [23] performed a thermodynamic study that showed around 100% efficiency for CH4 production from syngas (at 350 °C and above 10 atm), results that comply with the selectivity
and yield of some commercially available products using Ni catalysts. We have used these results in our analysis. Despite syngas having higher production efficiencies, as shown in our results and studied literature [8], [9], the final FTS efficiency and power consumption can greatly influence the 2-step results. Herein we provide an estimation of the energetic cost of FTS process and compare the two possible paths of Figure 1.1 to see which one is more viable.
7
Methods and Model Description
The simulations studies performed in this thesis were based on state-of-the-art experimental data concerning previous published experimental works or on products available in the market, which we describe in section 3. The reactions kinetics, PV models and efficiency assessment formulas necessary to model those datasets are presented in this section. The models presented here were computed for further study using Origin and Wolfram Mathematica Software. The former was very useful for plotting and adjusting the models to the datasets, while the latter, an analytical calculation and simulation tool, was important in the manipulation of the models to, using programming skills, estimate the desired results.2.1 Electrochemical model
In fuel cells the working principles are redox reactions. For this type of reaction, we can have either galvanic cells (electrochemical cells of which batteries are an example) and electrolytic cells. The former ones occur spontaneously and correspond to the inverse reaction of the latter ones. The reactions we are working with are electrolytic, so we need to apply a potential difference to start the process. The relation between the total current and the applied potential can be described by the Butler-Volmer equation [18], [20], [27], [30]–[34]: J = J0× (exp ( αaF(V − η − E) RT ) − exp ( αcF(V − η − E) RT )) (5)
Where J is the reactor current density (mAcm-2), J
0 is the exchange current density (mAcm-2), T is the Temperature (K), V corresponds to the applied voltage (V), R and F are two constants which represent, respectively, the constant of gases (8.3144 JK-1mol-1) and Faraday’s constant (96485 Cmol -1), α
a and αc are, accordingly, the anodic and cathodic transfer coefficients and define how the potential influences each side of the reaction in relation to the other. η are the overpotentials (V). As the name suggests, it is a parameter that includes all the phenomena that make the working voltage value higher than the thermodynamic cell potential (E0). It includes mass transport overpotential, ohmic overpotential and other assembly and material related overpotentials [33]. The cell potential, E, depends on the thermodynamic cell potential (E0), which corresponds to the theoretical potential value at which the reaction should start, and its value is given by the following formula:
E0=TΔS − ΔH
nF (6)
Where ΔS and ΔH are, respectively, the entropy and enthalpy variations between products and reagents (in kJmol-1) and n is the number of electrons involved in the reaction. These values depend on the
8
numerator corresponds to minus Gibbs free energy variation (-ΔG). Non-spontaneous reactions (electrolytic reactions) have negative values of E0 and positive values of ΔG, meaning that the higher (in absolute value) the cell potential is the more energy needs to be provided for the reaction to start.
Table 2.1 - Half-cell reactions for each considered product. From it, we calculate the Gibbs energy variation (products - reactants) from tabulated values of the formation enthalpy and entropy. Finally, the cell potential (E0) is calculated assuming T = 298 K [5].
Product of interest Anode Cathode ΔH ΔS E0
(oxidation reaction) (reduction reaction) (kJmol-1) (kJmol-1) (V)
Hydrogen 2H2O → 4H+ + 4e- + O2 4H+ + 4e- →2H2 572 0.327 -1.23
Carbon Monoxide H2O → 2H+ + 2e- + 1
2O2 CO2 + 2H
++ 2e- ⇌ CO + H2O 283 0.086 -1.34
Methane 4H2O → 8H+ + 8e- + 2O2 CO2 + 8H++ 8e- ⇌ CH4 + 2H2O 891 0.243 -1.06
Besides the assembly-based overpotentials, the reaction rate also has influence in the cell potential. Its influence can be described by the Nernst Equation as follows [5], [18]:
E = E0+ RT
F × log(e) × n× log (
[reductors]
[oxidants]) (7)
The concentration of oxidants and reductants can be substituted by their partial pressures since we are dealing with gases.
Another issue that needs to be considered is the type of electrode system of the EC cell. Usually, the EC systems are only analysed in the cathodic half-cell (making the system a 3-electrode cell: anode, cathode which can also be called working electrode and reference electrodes), which is the side where the products of interest are produced (CH4, CO, H2), since the anode is always related to H+ production.
This means that the measured potential only belongs to the half-cell and depends on the reference electrode, making it inadequate to introduce in expression (5). Fortunately, the anodic half reaction is always the same (Table 2.1), meaning that the potential difference from half to full reactions is always the same, -1.23 V (that is the hydrogen reaction potential) for the standard hydrogen electrode (SHE) according to [5].
For the purpose of this work, the influence with Temperature also needs to be considered. Although expressions (5) and (6) depend on temperature, they cannot correctly predict changes in temperature for endothermic reactions, because J0 also depends on temperature, as Vieira explained in his thesis
[27]. A better accounting of the temperature dependence has been derived, in which J0 is expressed as [32], [35]: J0= J0ref× exp [− Ea R × ( 1 T− 1 Tref )] (8)
Where Ea is the activation energy (Jmol-1), J
0ref is the current density (mAcm-2) at the reference temperature Tref (K), T is the working temperature (K). The original equation also includes a factor that
9
relates the geometrical and active area of contacts, but we have made it equal to 1 as a simplification, since we do not have information about it in the data we have used.
For the calculation of the mass of generated product, the following formula was used [36]:
mi= siMiIt
nF (9)
Where mi is the mass of the specie i that was formed (g), si the stoichiometric coefficient of this species, Mi is the molar mass (gmol-1), I the working current (A) and t the production time (s). The EC efficiency is derived from:
ηEC= E Vop
× EF (10)
Where Vop is the operational voltage (V) chosen for the process and EF the faradaic efficiency which is the selectivity of the process to the desired product.
2.2 Photovoltaic model
The PV systems were simulated based on the single diode model, which corresponds to the following I-V curve [30], [37]–[39]: I = Iph− I0[exp ( q(V + IRs) η𝑑KBT ) − 1] −V + IRs Rp (11)
Where Iph is the light generated current (A), I0 the saturation current (A), η𝑑 the diode ideality factor, q is the electron charge (1.6×10⁻¹⁹ C), V the voltage (V), KB the Boltzman constant (1.38×10⁻²³ JK-1), T the temperature (K), Rs and Rp the series and parallel resistances, respectively.
Since the parameter I0 is difficult to estimate one can mathematically manipulate expression (11) so that the I-V curve does not explicitly depend from it [38], [39]:
I = 1 − (1 − )v− (V 2+ 1 2 ) m (12) = 1 − Voc IscR𝑝 (13) m = 1 −1 + Voc NsnVT+ θIscRs (14)
Where V𝑜𝑐is the open circuit voltage (V), Isc the short-circuit current (A), Rp the shunt resistance (Ω), VT the thermal voltage (V), Ns the number of solar cells in series and Rs the series resistance (Ω). θ is an empirical value without any physical meaning.
10 EEPV=
Vop× Iop
G × Area (15)
Where G is the solar input power (solar irradiance), usually 1000 Wm-2.
2.3 Fischer-Tropsch (FT) model
The FT process consists in the second part of the 2-step process (see Figure 1.1). Here we intend to calculate the energetic cost of this supplementary step, considering temperature change and pressure rise in the calculations. For a constant gas volume, the heat transfer can be represented by the classic calorimetry calculation of heat:
Q = m ∫ C dT (16)
Where Q is the heat transferred (J), m the mass of gas produced in the EC process that is introduced in the FT chamber (Kg), C is the specific heat (kJKg-1K-1)and T the temperature variation that the gas
will suffer, in Kelvin. For our calculations the gas will be heated to 350 °C, since this will ensure that the CH4 yield is close to 100% for Ni catalysts, according to literature [23].
Considering that the temperature stabilizes and having set the working pressure, the following formula allow the calculation of the energetic cost of pressure (in Joule):
EA→B= PBVBln ( PA PB
) + (PB+ PA)VB (17)
This formula is obtained from the ideal gas law and E = P×dV. Where Pi and 𝑉i are respectively the pressure (atm) and the volume (m3) at the instant i. The subscript A stands for the initial condition and
11
Results and Discussion
In this chapter all the simulations and results are shown for both the 1-step direct methane production and for the 2-step process with syngas intermediate (see Fig. 1.1).We start by applying the models described in the previous section to both solar and EC cells so we can study them in more detail. Secondly, with the models in place, we are able to simulate different PV-EC systems in order to understand how much, why and how the new state-of-the-art Perovskite/Si solar cells, intermediate electronic regulation (DCDC converter) and the thermal coupling can improve the system’s performance. Finally, with these improvements implemented, we conclude about the most energetically efficient path for producing methane, taking in consideration that the 2-step process has an intermediate process, called Fischer-Tropsch that has its own energetic requirements. The results will culminate in the amount (i.e. area) of PV-EC necessary to power an average European house to analyse the feasibility of the concepts and to see if further improvements in the different elements of the system are still necessary.3.1 Electrochemical reactions
The reactions comprise a complex sequence of steps that unfold after an electric potential is applied. The confirmation that the reaction is occurring is the appearance of an electric current. It confirms that electrons are flowing and that the oxidation and reduction processes are occurring at the respective side of the cell. The higher the current the more gas is produced because it means that more electrons are participating in the redox reactions. In this section we study the J(V) curves of EC cells. Both systems were considered in the same ambient and test conditions, that is, constant CO2 flux of 20
mLmin-1, temperature and pressure at ambient conditions (298 K and 1 atm).
3.1.1 Methane electrolyser (1-step process: CO
2→ Methane)
For the methane production (top path in Figure 1.1 which corresponds to Figure 3.1b) we have considered the total cell current from the article Manthiram et al. [8] to model the JV curve. The cathode and anode catalysts are made from Cu and IrO2 nanoparticles, respectively. Equations (5) to (8) are
used in the present model, and the results are shown in Figure 3.1a. The fitting was made in Origin using information from Table 2.1, yielding the fitting parameters indicated in Table 3.1. The starting point are the already known theoretical parameters: n assumes the value 8 because the cathodic product is methane which involves eight-electron transfer reactions (Table 2.1); the entropy and enthalpy are the values of methane found in literature and presented in Table 2.1 [5]; the pressure in both sides of the cell is the same (i.e. 1 atm). An ideal flow- through system is assumed in which the gases are always flowing and do not accumulate, keeping their pressures at 1 atm. Only the CO2 flow
is at a slightly higher pressure, 1.2 atm. For simulations at 298 K this is the necessary information, as the missing parameters are inferred using the fitting capabilities of ORIGIN software. However, for
12
other temperatures we lack information the reaction activation energy (Ea) since the experimental results did not include EC curves at other temperatures.
Table 3.1 - Parameter set used in the methane electrolyser’s model to fit the experimental results.
Fitting Parameter Value
Ea (Jmol-1) 60000 T (K) 298.00 Tref (K) 298.00 Jref (mAcm-2) 0.0162 αa 0.0000 η (V) 0.1600 αc 0.1250 ΔH (kJmol-1) 890.57 ΔS (kJmol-1) 0.2429 n 8.0000 PCH4 (atm) 1.0000 PO2 (atm) 1.0000 PCO2 (atm) 1.2000
Therefore, the challenging part was the activation energy determination, which is difficult to precisely assess, since it strongly depends on the testing conditions and apparatus. In the literature there are multiple reaction-path models where activation energies can go from 48.3 to 286.6 kJmol-1 [18]. As a
(a)
CO
2-to-CH
4synthesis at 25 °C
(b)
CO
2-to-CH
4synthesis schematic
Figure 3.1 – Carbon dioxide to methane EC synthesis: (a) – Experimental
[7]
and simulated curves at 298 K for the methanation process; (b) - Schematic of the process: connected PV and EC systems to produce methane. Voltage values are presented in absolute value.13
consequence of not knowing which model fits best this specific experimental data, we have estimated the Ea to be around 60 kJmol-1 as presented in Table 3.1. Regarding the cell voltage, most works in
literature only account for the half-cell potential (i.e. usually measurements only consider the potential between reference electrode and the cathode/working electrode). This is because the reaction of interest is in the cathode side, and the anodic reaction is always the same as can be seen in Table 2.1. However, to properly compare with the 2-step process, we converted this potential to the total potential and in a first simplification neglecting the overpotential of this reaction. Once the anodic half-cell reaction is always the same, as explained in section 2.1, the voltage drop is always -1.23 V (from cathode potential to cell potential the voltage increases 1.23 V in absolute value).
3.1.2 Syngas electrolyser (2-step process: CO
2→ Syngas)
The Electrochemical part of the 2-step approach comprises the syngas production (CO and H2
production in Figure 1.1 which corresponds to Figure 3.2b). The total current data from the article of Kutz et al. [9] was employed to model the JV curves. The paper concerns CO production, however, it is also possible to produce other fuel combinations like syngas. The way we make it possible is explained under section 3.5. The cathode and anode catalysts are made from Ag and IrO2 nanoparticles,
respectively. Equations (5) to (8) are used to model the data, as shown in Figure 3.2.
The fitting was made using information from Table 2.1, yielding the results in Table 3.2. The starting point is the already known theoretical parameter set: n assumes the value 2 because both cathodic products –carbon monoxide and hydrogen, constituents of syngas – involve two-electron transfer reactions (Table 2.1); the entropy and enthalpy are the values for carbon monoxide production once this curve was originally for carbon monoxide production. These values can be found in literature and
(b)
CO
2-to-syngas synthesis schematic
Figure 3.2 –CO2 to syngas (CO + H2) synthesis: (a) - Experimental [8] and simulated curves at 298 K and
328 K which show the success of the implemented model at different temperatures; (b) - Schematic of the process: connected PV and EC systems to produce syngas. Voltage values are presented in absolute value.
14
are presented in Table 2.1 and Table 3.2 [5]; the pressures in both sides of the cell is the same (1 atm). An ideal flow-through system is assumed in which the gases are always flowing and do not accumulate, keeping their pressures at 1 atm. From the first fitting (fitting at 25 °C in Figure 3.2a) we managed to parameterize the anodic and cathodic transfer coefficients (αa,c), the overpotentials (η) and the exchange current density (Iref) since the test conditions are the reference conditions (298 K), making equation (8) simply J0≡ J0ref (removing the influence of Ea). However, Ea is important for simulations at temperatures that vary from the reference one, and it is parameterized at the inset plot of Figure 3.2a. Having data of the same cell at two different temperatures, one can vary the activation energy and see which value provides the best fitting conditions. The most accurate fitting result was 30000 kJmol-1. All the model parameters are presented in Table 3.2.
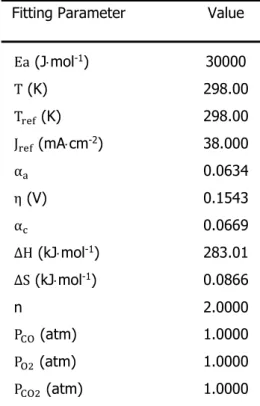
Table 3.2 – Parameter set used in the syngas electrolyser’s model to fit the experimental results.
Fitting Parameter Value
Ea (Jmol-1) 30000 T (K) 298.00 Tref (K) 298.00 Jref (mAcm-2) 38.000 αa 0.0634 η (V) 0.1543 αc 0.0669 ΔH (kJmol-1) 283.01 ΔS (kJmol-1) 0.0866 n 2.0000 PCO (atm) 1.0000 PO2 (atm) 1.0000 PCO2 (atm) 1.0000
Another evidence that can be extracted from the plots above (Figure 3.1a and Figure 3.2a) is that the two simulations have less accurate fittings at low current densities (below 6 mAcm-2 and 100 mAcm-2
for the methane and syngas electrolysers, respectively). This is due to the Butler-Volmer equation that predicts a smoother (more exponential-like) behaviour when the reaction starts, but the experimental exhibit a more abrupt trend. A deeper study of these cells could mitigate this problem, which we leave for future perspectives.
15
3.2 Solar cells
The second aspect in the simulation process is to model the PV cells’ JV curves. The individual cells and module curves and assembly are represented in Figure 3.3, and their fitting parameters in Table 3.3. The mono-Si curve was simulated according to SUNPOWER’s commercially available solar cell, whose datasheet is given in Annex I
. From the datasheet we were able to retrieve the main parameters to our simulation such as the voltage decrease per degree, area, open circuit voltage and short-circuit current at the working conditions of 1000 Wm-2, AM 1.5G illumination and 298 K. The remaining parameters of equations
(12)-(14) were fitted to match with the experimental JV curve (Figure 3.3a).
In order to analyse an emerging PV technology which can be highly suitable for PV-EC, we considered a Perovskite/Silicon tandem (double-junction) cell with light trapping [10]–[13]. Initial parameters, ISC
and VOC, were estimated based on these references. The VOC is in accordance with 2T tandem cell from
Hörantner et al. [11], which reaches 1.9 V. With common PV device architectures, current densities close to those of Silicon (i.e. above 30 mAcm-2) are hardly achievable with such high open circuit
voltages. However, when considering the implementation of advanced light trapping schemes to boost broadband light absorption (e.g. results from M. Alexandre et al. [13]), and adjusting the cell bandgaps for a lower open-circuit voltage (1.45 V), it is possible to have a cell with a favourable VOC = 1.45 V and
(a)
Figure 3.3 – Solar cells considered in the simulations: (a) - Solar cells’ JV curves representation at 1000 Wm-2, AM 1.5G and 298 K. In green we have the JV curves of a single and 2 series-connected (2S)
Perovskite/Silicon tandem cells. The mono-Si arrangements, based on SUNPOWER cells, are represented by the black curves: it shows the JV curves of a single cell and modules of 4 connected (4S) and 5 series-connected (5S) cells. Our model for SUNPOWER cell exhibits a perfect fit with its experimental data (in dashed red). SUNPOWER datasheet provided in Appendix I; (b) – sketches of the modules with the different series-connected PV cells, showing their respective size.
SUNPOWER modules Perovskite/Silicon module
5S
4S
2S
16
ISC = 30 mAcm-2. The Fill-factor (FF) and current density of this novel cell design are according to
literature, which showed FF up to 83% and ISC close to 30 mAcm-2.
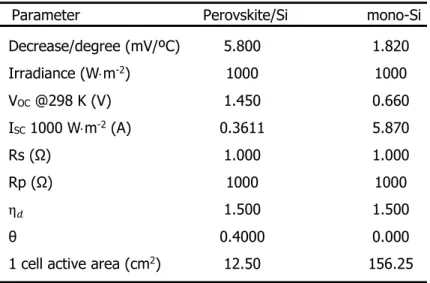
Table 3.3 – Parameters used in the solar cell model for both mono-Si (SUNPOWER) cell and Perovskite/Si double junction cell. Working conditions of 1000 Wm-2, AM 1.5G illumination and 298 K.
Parameter Perovskite/Si mono-Si
Decrease/degree (mV/ºC) 5.800 1.820 Irradiance (Wm-2) 1000 1000 VOC @298 K (V) 1.450 0.660 ISC 1000 Wm-2 (A) 0.3611 5.870 Rs (Ω) 1.000 1.000 Rp (Ω) 1000 1000 η𝑑 1.500 1.500 θ 0.4000 0.000
1 cell active area (cm2) 12.50 156.25
The modules’ response was then extrapolated, considering series-connections between individual cells without electric losses. The correspondent quantities of interest are presented in Table 3.4. We have studied two different modules for the mono-Si cells, because we noticed that methane production benefited from having a 5-series cell module (5S), while syngas (CO and H2 production) benefited from
4-series cells (4S). The FF values are between 72%-79% for the SUNPOWER cell and between 68%-74% for the Perovskite/Si tandem cell. Despite having higher FF values, the mono-Si cells exhibit less than 2/3 in efficiency. Since our tandem cell design is more efficient in converting photons in electricity, we considered a lower active area than that of the SUNPOWER, as we can see by comparing module’s sizes in Figure 3.3b. We will see in the next sections which PV type matches best with the EC cells. The analysis of one solar cell technology with high Isc and low Vop (mono-Si), and another working with opposite characteristics (Perovskite/Si double-junction), will make an interesting comparison to see which technology is more suitable for EC coupling and to power the subsequent gas fuel production.
17
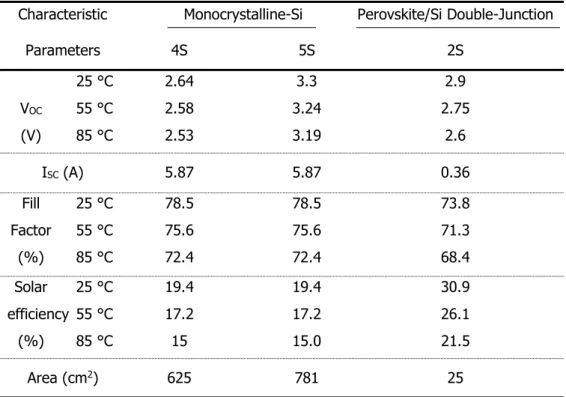
Table 3.4 – Representation of the characteristic parameters of the different PV modules studied. The Perovskite/Si double-Junction 2-series cell (2S) module was used to obtain all the products. For Monocrystalline-Si, the 4-series cell (4S) module is used in syngas while the 5 series cell (5S) module is used in methane production only. Solar efficiency is calculated based on the MPP, to be independent of any load.
Characteristic Monocrystalline-Si Perovskite/Si Double-Junction
Parameters 4S 5S 2S 25 °C 2.64 3.3 2.9 VOC 55 °C 2.58 3.24 2.75 (V) 85 °C 2.53 3.19 2.6 ISC (A) 5.87 5.87 0.36 Fill 25 °C 78.5 78.5 73.8 Factor 55 °C 75.6 75.6 71.3 (%) 85 °C 72.4 72.4 68.4 Solar 25 °C 19.4 19.4 30.9 efficiency 55 °C 17.2 17.2 26.1 (%) 85 °C 15 15.0 21.5 Area (cm2) 625 781 25
3.3 Photovoltaic-Electrochemical (PV-EC) thermal coupling
In order for the EC cell to receive the maximum possible electric power from the PV, the working point must be close to the solar cell maximum power point (MPP), the reason why the mono-Si and Perovskite/Si double-junction modules have, respectively, 4 and 2 cells in series (Ns parameter in simulations - for the special case of methane production with mono-Si PV, we used 5 cells). This proximity can be depicted between the MPP and the operating point (OP), at 298 K in Figure 3.4. Something also evident in Figure 3.4a is that we lose the proximity to the MPP as the temperature rises, which means that the transfer of power between systems decreases. This is justified by the decrease in PV efficiency while no variation is verified in the EC process, resulting in decreasing current and voltage and, therefore, decreasing output power. A way of mitigating this problem is by thermally Coupling (TC) both EC and PV systems, which can be implemented in practise simply by attaching the EC cells to the rear electrodes of the solar cells, as depicted in Fig. 1.2. The improvement can be seen by comparing both plots in Figure 3.4. The thermal coupling allows the EC process to compensate losses (mainly in voltage) in the PV system, because the increasing temperature will positively affect the chemical reactions (evident in the reduction of the EC operating point voltage with constant operating current). While in the uncoupled system (Figure 3.4a) the operating current density reduces from 33 mAcm-2 to 15 mAcm-2 when heating from 25 to 85 °C, the coupled system (Figure 3.4b)
18
the system’s efficiency and consequently gas production. Other ways of approximating even further the operating point to the maximum point will be discussed in the following chapters.
3.4 Process efficiency
After modulating the individual systems, it is time to test how the systems combine with each other and how much influence can thermal coupling have. We can evaluate this based on the process efficiency. To calculate the process efficiency, we need the solar-to-electricity efficiency (EEPV) and the
electrochemical efficiency (EE). From a solar irradiance of 1000 Wm-2, the solar panel area and the
operating point (obtained from the JV plots like the one in Figure 3.4), one can use Equation (15) to compute the EEPV (Figure 3.5b). The results show that if the system is thermally coupled (TC), the
Perovskite/Si double-junction cells are more efficient because the modules’ efficiency varies from 22% to 30% while the mono-Si vary from 12% to 20%. The specific case of the 1-step process without thermal coupling (NoTC) powered by Perovskite/Si double-junction cells (1-step, NoTC + Perovskite/Si – green curve with green squares) show that NoTC can drastically change the PV efficiency and consequently degrade the system’s performance. Despite this specific case, where above 50 ºC the mono-Si modules are better, Perovskite/Si cells show higher potential.
The EE (Figure 3.5a) comes from equation (10) which depends on the operating voltage and faradaic efficiency. The latter is taken to be 80% for CH4 [40] and 96.7% for the syngas electrolyser [9]. In
future considerations we will assume the same value of 96.7% for H2 synthesis, since we know from
literature that hydrogen can be produced with high selectivity, sometimes even considered 100% [32], [33]. Once the two products (CO and H2) have the same selectivity, the EE will be the same for the
different product ratios. The electrochemical energy efficiencies for these electrolysers
(b)
(a)
Figure 3.4 - Simulation of the PV (i.e. Si) and EC (i.e. syngas electrolyser) systems for 3 different temperatures: 298 K, 328 K, 358 K: (a) – is the uncoupled system; (b) – is the thermally coupled system. The solar maximum power points (MPP) and operating points (OP) are represented at each curve. We represented a Si-syngas system, but the others operate accordingly.
19
are placed between 30% and 80% (1.5x to 2x higher for the 2-step electrolyser) which tend to increase with temperature. It is possible to conclude that the syngas electrolyser (in 2-step route) is more efficient than the direct methane electrolyser (1-step route). In general, the Perovskite/Si modules have lower electrochemical efficiencies than the SUNPOWER cells modules, but higher PV efficiencies. The PV efficiency difference is higher, so the Perovskite/Si module provides higher solar-to-fuel efficiencies (EEPV × EE, presented in Figure 3.5c,d). In each figure (Figure 3.5c and d) we confirm that the methane
electrolyser has lower efficiency than the syngas electrolyser. Also, by comparing both figures, we see higher efficiencies for the Perovskite/Si modules. It is also possible to identify great differences between the Coupled (TC) and uncoupled (NoTC – dashed lines) systems. What usually happens is that the EC
(c)Perovskite/Si module
(d) Mono-Si module
Figure 3.5 – Solar-to-fuel efficiencies of the studied electrolysers : Plots (a) and (b) show the EC and PV efficiency, respectively, for the two electrolysers in combination with the two types of PV (mono-Si and Perovskite/Si). Plots (c) and (d) show the overarching solar-to-fuel efficiency - the curves in blue correspond to the CO2-to-syngas
electrolyser, which will be responsible to produce multiple CO:H2 ratios depending on the cathode constitution, and the curves in green correspond to the CO2-to-methane electrolyser. A comparison between Thermally Coupled
(TC) and Thermally Uncoupled (NoTC) systems is made, where the uncoupled systems show decreasing efficiency with increasing temperature. Plots (c) and (d) differ in the type of solar cells used. In (c) we tested a module of 2 Perovskite/Si tandem (double junction) cells connected in series while in (d) we used a module of 4 (for syngas) or 5 (for methane) monocrystalline Silicon cells from SUNPOWER connected in series.
20
compensates the PV when temperatures increases: In normal conditions (NoTC) only the PV needs to be under direct sunlight, which means that it is the only system that will to heat up, hence its efficiency will decrease during solar exposure (Figure 3.5b). On the other hand, when we couple the EC system (TC conditions) we allow thermal equilibrium between both systems which means that both will get warm. The PV will still reduce efficiency, however, a higher temperature EC system allows efficiency improvements (Figure 3.5a) because reaction kinetics are favoured. Consequently, the TC curves will have small to no degradation with increasing temperature since the EC system’s efficiency improvements compensate the efficiency decrease of the PV system. TC will be beneficial to the process (i.e. improves the solar-to-fuel efficiency) until up to 576% and 30% for the Perovskite/Si double-junction and Si solar modules, respectively, in comparison to the system without it. The 576% has to do with the specific combination of the methane electrolyser and the Perovskite/Si double-junction modules. From 15 °C to 85 °C the operating current changes drastically, which lowers abruptly the EEPV
and consequently the solar-to-fuel efficiency. This shows a limitation of cells with high open circuit voltages (which is the case of Perovskite/Si double-junction with Voc = 1.45) when used with uncoupled
systems: it is difficult to adjust the operating point by adding individual series-connected cells, because it would be 1.45 V away from the previous one, which despite being able to increase the operating current, it would place the operating point further away from the MPP, which would lead to a great amount of power lost.
3.5 Fuel production
In this work we are studying two different electrolysers that can output either methane or syngas (carbon monoxide, CO, and hydrogen, H2). For the syngas electrolyser (2-step) a greater challenge is
proposed, because we want to produce two gases at the same time with specific relative concentrations. Usually EC systems concentrate production in one gas, while the remaining are unwanted by-products. Here we could also produce CO and H2 in separate electrolysers, however, it would require a bigger
infrastructure to deal with two separate EC systems. Instead, we consider the system of Masel et al. [19] in which the composition of the cathodic products can be manipulated to tune the CO:H2 ratio. In other words, while keeping the same EC behaviour (JV curve) we can manipulate the cathode composition between a metal with more affinity to CO (e.g. Ag) and a metal with more affinity to H2
(e.g. Ni), to choose the desired proportion of gases at the output. For example, at the same operating point, an Ag:Ni ratio of 1:2 gives an output CO:H2 ratio of around 1:1. At this ratio the proportion is
quite stable independently of small changes in the operating point. For higher ratios the stability of the gas ratio gets closer to the metal’s ratio (i.e. Ag:Ni ratio of 1:4 gives CO:H2 ratio of 1:4), but small
operating point changes can easily alter the output ratio of gases. Anyway, this system has proven that an EC cell, initially designed for carbon monoxide production with >95% efficiency, can also produce other fuels just by changing the cathode composition. We will make use of this property so we can model syngas production with different CO:H2 ratios (1:0, 1:1, 1:3, 0:1). The studied paper reference
![Figure 1 – solar fuels production cycle. Water, CO 2 and solar energy as input are transformed into solar fuels that can be used as energy sources [1].](https://thumb-eu.123doks.com/thumbv2/123dok_br/15796719.1078788/21.892.219.655.756.1086/figure-solar-production-water-energy-transformed-energy-sources.webp)

![Figure 3.2 –CO 2 to syngas (CO + H 2 ) synthesis: (a) - Experimental [8] and simulated curves at 298 K and 328 K which show the success of the implemented model at different temperatures; (b) - Schematic of the process: connected PV and EC systems to p](https://thumb-eu.123doks.com/thumbv2/123dok_br/15796719.1078788/34.892.113.780.594.901/synthesis-experimental-simulated-implemented-different-temperatures-schematic-connected.webp)