Reviewing working memory training gains in healthy older adults: A meta-
T
analytic review of transfer for cognitive outcomes
Ana C. Teixeira-Santos
a,, Célia S. Moreira
b,c, Rosana Magalhães
d,e, Carina
Magalhães
b, Diana R. Pereira
a, Jorge Leite
a,f,g, Sandra Carvalho
a,f, Adriana Sampaio
a aPsychological Neuroscience Laboratory–CIPsi, School of Psychology, University of Minho, Campus de Gualtar, Braga, PortugalbCIPsi, School of Psychology, University of Minho
cDepartment of Mathematics, University of Porto (FCUP, CMUP) dServiço de Psiquiatria/Psicologia do Hospital Cuf Porto
eUniversidade Católica Portuguesa, CEDH – Centro de Investigação para o Desenvolvimento Humano, HNL – Human Neurobehavioral Laboratory, Porto – Portugal fSpaulding Neuromodulation Center, Department of Physical Medicine & Rehabilitation, Spaulding Rehabilitation Hospital and Massachusetts General
Hospital. Harvard Medical School, Boston, USA
gPortucalense Institute for Human Development (INPP), Universidade Portucalense, Porto, Portugal
A R T I C L E I N F O Keywords:
Working memory training Cognitive plasticity Training transfer Healthy older adults Healthy ageing.
A B S T R A C T
The objective of this meta-analytic review was to systematically assess the effects of working memory training on healthy older adults. We identified 552 entries, of which 27 experiments met our inclusion criteria. The final database included 1130 participants. Near- and far-transfer effects were analysed with measures of short-term memory, working memory, and reasoning. Small significant and long-lasting transfer gains were observed in working memory tasks. Effects on reasoning was very small and only marginally significant. The effects of working memory training on both near and far transfer in older adults were moderated by the type of training tasks; the adopted outcome measures; the training duration; and the total number of training hours. In this review, we provide an updated review of the literature in the field by carrying out a robust multi-level meta-analysis focused exclusively on working memory training in healthy older adults. Recommendations for future research are suggested.
1. Introduction
Ageing of the world population is a major public health concern that has captured the attention of the general public. Overall, more than 962 million people were over the age of 60 in 2017. It is estimated that this number will more than double to 2.1 billion people by the year 2050 (United Nations, Department of Economic and Social Affairs, 2017). Specifically, it is estimated that the population of people over the age of 80 will triple by the year 2050, increasing from 137 million to 425 million (United Nations, Department of Economic and Social Affairs,2017). Therefore, much effort has been made to promote optimal ageing to avoid both declines in cognitive functioning and dependence on others, which are factors associated with ageing. Specifically, much has been done to try to reverse age-related cognitive decline and pre-vent or delay pathological cognitive disorders. This movement re-presents a significant attempt to improve the quality of life of older adults and to relieve the burden on medical care systems that has
resulted from a substantial increase in the elderly population. Efforts to address the issue include non-pharmacological interventions, such as the Advanced Cognitive Training for Independent and Vital Elderly (ACTIVE) trial (Ball et al., 2002, 2002; Rebok et al., 2014). The pro-mising findings in the field encouraged researchers to further in-vestigate the benefits of cognitive training in older people.
Different cognitive training approaches are reported in the literature (Jolles and Crone, 2012). They can be classified into two major cate-gories: “strategy-based training” and “process-based approaches”. Strategy-based
training consists of the development of specific adapta-tions and strategies,
such as mnemonics, which can be used to ame-liorate daily struggles (Lustig et al., 2009), whereas process-based ap-proaches focus on the training of specific cognitive abilities (Clare and Woods, 2004). More specifically, core process-based training focuses on training central mechanisms with the purpose of producing more sub-stantial effects in functions that depend upon this central processor and that share a common neural substrate (Morrison and Chein, 2011).
Notably, working memory training (WMT) has emerged as a proxy for improving cognitive functions (Neely and Nyberg, 2015).
Working memory (WM) refers to the components responsible for maintain temporally a limited amount of information in an available state to allow the processing of ongoing information (Cowan, 2017). WM performance declines markedly with ageing, and this has been associated with abnormalities on the frontoparietal networks involved in WM, as well as neuromodulatory (dopamine) and neuroanatomical alterations (Bäckman et al., 2017, 2010; Lubitz et al., 2017; Park andReuter-Lorenz, 2009; Raz, 2005; Rottschy et al., 2012; Salthouse, 1990). This reduction in WM capacity in older adults, along with adecrease in processing speed, seem to underlie age-related cognitive decline (Braver and West, 2008), primarily because WM is associated with higher-order cognitive functions (Unsworth et al., 2005), in-cluding reasoning (Shakeel and Goghari, 2017), reading (Just andCarpenter, 1992), prospective memory (Bisiacchi et al., 2008), pro-cessing speed (Diamond et al., 1999), attention (West, 1999), percep-tual organization (Ko et al., 2014), and general language (Kemper et al., 2004). Therefore, given the decrease in WM performance with ageingand its putative role in higher-order cognitive functions, WMT has been studied extensively to enhance cognition in older adults, and positive effects of WMT on both cognition and neural plasticity have been found (Constantinidis and Klingberg, 2016; Karbach and Verhaeghen, 2014).
Experimental studies of WMT typically include an experimental group, whose members participate in a WMT, and a control group. The control group can be a no-contact control group (passive control group) or an active control group that completes a non-related activity or a low-level WMT. Participants in active control group are exposed to a training setting (i.e., number of sessions, contact with the experimenter, a style of intervention) that is similar to that of the experimental group, but they are not exposed to the experimental WM condition. This design with active control condition allows the researcher to control for effects that may result from social contact during the experiment or a parti-cipant´s expectations. However, participants from both groups (passive and active control groups) undergo the same testing before and after the intervention as the participants of the experimental groups.
There is abundant literature on WMT (see app. table 4). They may include computerized tasks and can be visual, auditory or both visual and auditory. Trained tasks usually consist of complex or simple span tasks or updating tasks. In complex span tasks, participants must recall a sequence of stimuli, which is interleaved with a concurrent activity. In simple span tasks, participants must remember the sequence of stimuli in forward (fwd) or backward (bwd) order. Updating includes tasks in which participants hold specific content in memory, continually up-dating the information to be remembered and dropping information that is no longer needed. Training is usually adaptive, i.e., the task difficulty adjusts based on the individual’s performance (von Bastianand Eschen, 2016).
Several studies have been designed to study the effects of WMT by comparing the pre- and posttest results of experimental and control groups immediately after training (posttest) and at a delayed post-training assessment (follow-up). Additionally, studies have investigated the transfer effects, i.e., whether training gains can be generalized to other tasks involving different cognitive abilities (e.g., Borella et al., 2010)such as fluid intelligence (Beatty et al., 2015). Although there areno clear criteria to define transfer distance, most authors locate the generalization of the effects along a continuum of near to far transfer (Noack et al., 2009). Near transfer consists of an improvement on tasks that are like the trained task and that share the same mechanisms or components, while far transfer represents an improvement on tasks that measure abilities that are not like the abilities trained. Near-transfer effects are commonly observed (Borella et al., 2010; Li et al., 2008), although this is not always the case (Dahlin et al., 2008a). Results re-garding far transfer are controversial
potentialities and controversies of WMT (Constantinidis and Klingberg, 2016; Karbach and Verhaeghen, 2014; Lampit et al., 2014; Melby-Lerväg and Hulme, 2016, 2013; Morrison and Chein, 2011; Schwaighofer et al., 2015; von Bastian and Oberauer, 2013; Weicker et al., 2016), yet the results are inconclusive (see app. Table 1). Therefore, the current meta-analysis aims to contribute to this debate by examining the generalization of training effects to non-trained tasks (near and far transfer) (aim 1) and the maintenance of the effects over time (i.e., at follow-up) (aim 2) by using a meta-analysis approach that is different from the ones used in previous reviews.
Additionally, previous meta-analyses (Karbach and Verhaeghen,2014;
Melby-Lerväg et al., 2016) and experimental studies (e.g., Bürki et al., 2014; Stepankova et al., 2014; Zinke et al., 2014) have suggestedthat variables such as type of control group (Melby-Lerväg et al., 2016), age (Bürki et al., 2014; Richmond et al., 2011; von Bastian et al., 2013; Zając-Lamparska and Trempała, 2016; for works considering only olderadults, see: Borella et al., 2017a; Zinke et al., 2014), education (Borellaet al., 2017a), general cognitive ability (Borella et al., 2017a), baseline performance (Zinke et al., 2014, 2011) and training dosage (Bürki et al., 2014; Lilienthal et al., 2013; Stepankova et al., 2014) might moderate training gains and transfer effects. For instance, in relation to the type of control group, a meta-analisys from Melby-Lerväg et al. (2016) re-ported that the type of control group predicted transfer effects. In particular, studies showed more significant effects when using a passive control group than when using an active control group. However, other meta-analitical studies (Karbach and Verhaeghen, 2014; Weicker et al.,2016)did not find influence of type of control group (active or passive) in transfer effects. Regarding the age, an experimental study performed by Borella et al. (2014) found transfer effects of a visuospatial WMT for measures of STM, WM, inhibition, processing speed, and reasoning only in young-old adults but not in old-old adults. In accordance, together with an age-related difference in the transfer effects, Borella et al.(2017a) alsodocumented the role of age as an important moderator ofthe effects in WMT, although the results varied according to the type of transfer task. In addition, Zinke et al. (2014) evidenced that old-old participants had less gains than young-old participants, except for fluid intelligence in which the reverse pattern was verified.
Borella et al. (2017a, 2017b)have also shown that vocabulary and baseline performance influenced WMT. In this study participants with higher vocabulary scores and poor pretest performance benefited more from training, although this pattern was not the same in all outcomes (e.g., in fwd digit span, lower vocabulary score was related to more benefit in training). Moreover, participants with low levels of baseline performance in WM tasks were likely to benefit more from WMT (Zinke et al., 2014, 2011). Related to session length/duration, Jaeggi et al (2008) documented a significant growth in far transfer throughout the sessions (from 8 to 19 sessions). Other researchers showed that a group which trained for 20-day outperformed a 10-day training group in a visuospatial measure (Stepankova et al., 2014), while a small positive significant moderator effect for small training dose in comparison to large training dose was observed in a meta-analysis (Melby-Lerväget al., 2016).
Taken together, in the current study, we verified if the variables as type of control (active/passive), mean age of participants, total number of training hours, number of training sessions, training length in weeks, training type (single training - complex span, simple span, updating, or mixed training: more than one type of WM task), years of formal edu-cation, general cognitive ability (operationalized by vocabulary score), and baseline performance would moderate the training effect (aim 3). In addition, we also verified if the type of the outcome adopted (e.g., Cattell; Raven Advanced Progressive Matrix - RAPM; complex span) would moderate the transfer effect.
markedly affected by ageing (Salthouse, 2000), and WMT is proposed as an innovative approach to counteract age-related cognitive declines (Constantinidis and Klingberg, 2016; Karbach and Verhaeghen, 2014). While merging different ages and conditions may yield sample het-erogeneity, this practice can pose some problems for the internal and external validity of the findings (Rothwell, 2006). Additionally, to better isolate the effects of WMT, this meta-analysis addresses the specificity of the training delivered to the experimental groups by in-cluding studies whose experimental groups participated in trainings focused exclusively on WM and excluding studies whose experimental groups participated in trainings targeting cognitive functions other than WM. We also excluded papers whose active control groups participated in a non-adaptive WMT that remained always in a lower level of WMT (Brehmer et al., 2011; Chan et al., 2015; Loosli et al., 2016; Shing et al.,2012; Simon et al., 2018;
Wayne et al., 2016), specific examples in-clude: comparing an adaptive WMT with a WMT whose load (e.g., N = 2 or N = 3) is held constant throughout the training (Brehmeret al., 2011; Chan et al., 2015; Wayne et al., 2016); training both ex-perimental and control groups with a recent-probe and an n-back task, with the experimental group receiving trials with higher proactive in-terference when compared to the control group (Loosli et al., 2016); the participants performed a numerical memory updating task, however different groups were exposed to distinct rates of stimuli presentation (750 ms, 1500 ms or 3000 ms) (Shing et al., 2012). Considering that our aim was to contrast WMT with a placebo training not related to WM (e.g., questionnaire, quiz, visual search) or a non-training condition, in the present review, the above-mentioned studies were not included in the analysis. The rationale behind this is the fact that even a low-level of WM performance activates similar brain areas as high-level of WM processing (Braver et al., 1997; Kawagoe et al., 2015; Ragland et al., 2002). Since we do not have enough information to determine a sub-optimal dosage of WMT that would work solely as placebo (Huitfeldtet al., 2001), comparing different loads of WMT could lead to less in-terpretable data as these WM tasks might produce similar effects. As a consequence, we would not be able to isolate gains that are due to WMT (ICH Harmonised Tripartite Guideline, 2000). In fact, as suggested by Brehmer and colleagues (2011), both adaptive WMT and training at low WM load might lead to neural changes. Additionally, although many researchers classify executive function tasks as WM we did not include training of executive functions, such as Stroop interference, verbal fluency or task switching. As claimed by Oberauer et al. (2018) in the Benchmarks for Models of Short Term and Working Memory, executive functions are framed under specific theories and models that are dif-ferent from the WM literature. Furthermore, similar to previous meta-analysis (Karbach and Verhaeghen, 2014), we focused on healthy older adults, which represents the majority of the aging population, grounded on the basis of maintenance or enhancement of cognition as a pre-ventive measure, instead of rehabilitation in non-normative aging as a remedial measure (Tkatch et al., 2016).
Regarding the methods carried out in this meta-analysis, we em-ployed robust analytical methods to address multiple outcomes (Moeyaert et al., 2017) rather than use the average of the outcomes (e.g., Karbach and Verhaeghen, 2014; Melby-Lerväg and Hulme, 2016). Robust approaches to address multiple outcomes and treatments are critical as they give unbiased parameter estimates, while the average method may bias the estimates of the standard errors (Moeyaert et al., 2017; Morris, 2008). Finally, a sensitivity analysis was performed toaddress the lack of data on correlations between pre- and post-training measures. These correlational data are necessary to calculate the var-iance of the effect size of intervention gains, which was not considered in previous meta-analyses (Mansur-Alves and Silva, 2017; Melby-Lerväg and Hulme, 2016, 2013;
Schwaighofer et al., 2015). Finally, adescriptive analysis of the risk of bias was provided following the Co-chrane recommendations (Higgins and Altman, 2008). Overall, con-sidering these methodological issues and the fact that new papers have been published since the publication of the most recent meta-analysis,
the current study offers an integrated and updated overview of WMT gains in healthy older adults in accordance with the Cochrane re-commendations (Higgins and Green, 2008) that highlight the need to update reviews every two years.
2. Methods
We performed a systematic review following the Preferred Reporting Items for Systematic Reviews and Meta-Analyses guidelines (PRISMA) (Moher et al., 2009).
2.1. Data sources and eligibility criteria
Five databases (Scopus, Pubmed, PsychINFO, Science Direct, and Scielo; the last was accessed through Web of Science) were searched on January 16, 2019. There were no time or language restrictions. The search terms used were “training”, “working memory”, and “older adult”. The combinations of descriptors can be found in the supple-mentary material (see table A). Additionally, reference lists from six major reviews and one book chapter in the field were also searched (Karbach and Verhaeghen, 2014; Melby-Lerväg et al., 2016; Melby-Lerväg and Hulme, 2016, 2013; Morrison and Chein, 2011; Noack et al., 2009; Shipstead et al., 2012). App Table 2 includes the inclusion/ex-clusion criteria, and app. Fig. A1 provides a schematic representation of the steps adopted in the literature search. When there were insufficient data to proceed with effect size estimations, an email was sent to the authors requesting the relevant information. In cases in which a reply from the authors was not possible, we limited the inclusion of the study to the data provided.
2.2. Data extraction
Two authors selected articles based on the titles and abstracts, and duplicate records were manually removed. After the exclusion of irre-levant articles, two authors independently performed a full-text ana-lysis to assess the eligibility of the articles for inclusion in the review. There was moderate Fleiss’ Kappa inter-rater reliability agreement be-tween investigators in the full-text screening, including both included and excluded studies (k = 0.5) (Landis and Koch, 1977). Two reviewers independently assessed the risk of bias using the Cochrane Collabora-tion’s risk of bias tool (Higgins and Altman, 2008). Studies were clas-sified as “high risk”, “low risk” or “unclear” in the following domains: randomization, concealment of allocation, blinding of participants, personnel and outcome assessment, attrition, and reporting bias. At any stage, disagreements between reviewers were solved with discussions or in consultation with a third reviewer. Statistical analyses were con-ducted using the R packages “metafor” (Viechtbauer, 2010), “forest-plot” (Gordon and Lumley, 2016), “clubSandwich”, (Pustejovsky, 2017), and "metaLik" (Guolo and Varin, 2012) from R statistical en-vironment (RStudio, version 3.5.2, R Core Team, 2018).
Two reviewers independently recorded the following information from each full-text article: scores, standard deviations of pre-and post-treatment assessments, number of participants per group, types of outcomes, predictor variables, and dropout rates. Completion rates (i.e., the percentage of participants who completed training programmes) were calculated for each group. When a trial had two control groups, an active and a passive, we analysed data from the active group, as it is suggested that this approach allows better control of expectancy effects, such as the Hawthorne effect (Wickstrom and Bendix, 2000). One ex-ception was the study of Weicker et al. (2018), from which the passive control group was selected instead of the active control group, as the latter performed a fixed low-level WM task (see app Table 2 for ex-clusion criteria).
To assess near transfer effects, we divided outcomes in short-term memory (STM) and WM, as the majority of WM definitions recognize both passive storage and active processing as parts of WM (Cowan, 165
2017). Additionally, correlations within verbal or spatial domains are higher compared to correlations between domains (verbal/visuospatial) (Cowan, 2017; Oberauer et al., 2018). Accordingly, we divided WM outcomes in verbal and visuospatial categories. Reasoning was adopted as a far transfer outcome due to its strong relationship with WM and due to the fact that it is a commonly used measure in the field (Conway et al., 2003; Oberauer et al., 2008). Given that neuropsychological test outcomes varied across studies, they were grouped into broader do-mains to allow comparisons across studies. A description of each cog-nitive domain and the corresponding measures is available in app table 6 and app table 7. A minimum of four articles was necessary to compose a category. For verbal WM, the outcomes were grouped into three ca-tegories: bwd simple span; complex span; updating. Visuospatial WM had only the bwd simple span category. For STM, only the category “simple span” was created. Reasoning outcomes were grouped ac-cording to the tests used to assess reasoning abilities (e.g., Cattell, Raven Standard Progressive Matrix – RSPM, RAPM, Leistung-sprüfsystem Subtest - LPS). 2.3. Multilevel-meta-analysis
Effect sizes were calculated to estimate the transfer effect difference between WMT and control condition. The effect sizes of post-inter-vention and follow-up gains were calculated using Hedges’ g (Hedges, 1989). Since the design used in the individual studies of this meta-analysis have a
pre- posttest control design, we followed the discussion presented by Morris (2008, p. 369) to calculate the effect sizes mea-sures. More precisely, we used the standardized mean difference de-scribed in formula 5, which was originally defined by Becker (1988):
g=c(nE 1) Mpost ,E Mpre,E c ( nC 1) Mpost,C Mpre, C
,
SDpre,ESDpre,C
where Mpre,E and Mpost,E are the experimental group pretest and posttest
means, SDpre,E is the standard deviation of the pretest scores, c ( m) is a
bias correction factor, nE is the size of the experimental group, and Mpre,C, Mpost,C, , and nCare analogous values for the control group. Thebias correction factor is presented in formula 22 as described in Morris (2008,p. 372):
( ) 2 [m/2] ,
c m = m [( m 1)/2]
where is the gamma function. The sampling variances were obtained through equation 13 of Becker (1988). All effect sizes and sampling variances were automatically computed using the R package “metafor”.
Unfortunately, accurate estimation of the effect size variance in this formula requires the correlation between pre- and posttest scores, which was not available for most of the studies. Therefore, as re-commended by Borenstein (2009), a range of plausible correlations (r = 0.3, 0.5, 0.7) was considered, and a sensitivity analysis was con-ducted to ensure that the conclusions from the meta-analysis were ro-bust. A table for the sensitivity analysis is provided in the supplemen-tary material (see table C).
In some studies, more than one measure for the same category was adopted within the same experiment (e.g., Cantarella et al., 2016 re-ported on two reasoning measures: Cattell and RSPM). In those cases, a multilevel model was adopted for handle multiple effect sizes from the same sample. Using a robust method for dealing with multiple out-comes, such as in the multilevel model or the RVE, is important to avoid bias in the estimates of the effects, standard errors and variances (Moeyaert et al., 2017; Morris, 2008).
Considering that effect sizes from the same study are dependent on
one another, a multivariate meta-analysis is recommended to model these dependencies (Harbord, 2011). Indeed, classic meta-analytic models assume independence among effect sizes. However, this as-sumption is not realistic with clustered data, such as multiple outcomes from the same study. Multilevel models allow for model dependencies due to clustering and are therefore recommended to account for non-independence in the observed outcomes. Classic meta-analytic models can be considered 2-level models, with participants at level 1 and effect sizes at level 2, whereas multilevel models, also called 3-level models, include clusters at 3-level 3.
In this work, we used multilevel modelling that was complemented with both a sensitivity analysis and the RVE method. Specifically, this procedure consisted of two main steps. First, a full sampling variance-covariance matrix was imputed through the function “im-pute_covariance_matrix” from the “clubSandwich” package by selecting the studies to be the clusters, and the intra-experiments correlation to be 0.5. Second, the corresponding multilevel multivariate random-ef-fects model was assessed through the function “rma.vm” in the “me-tafor” package. Unstructured correlation matrices were used to allow random effects to be correlated and to have different variances for each outcome. To ensure robustness of the meta-analysis results, com-plementary analyses were performed through the RVE method and a sensitivity analysis with different correlations ( = 0.3, 0.5, 0.7). Robust results have been obtained through the function “coef_test” from the “clubSandwich” package, following the cluster robust estimator for multivariate/multilevel meta-analytic models described in
Hedges et al. (2010). Due to consistent findings observed with these complementarymethods, further mixed effects multilevel modelling (using moderators) was only performed for r = 0.5 and = 0.5 (r is the pre-posttest cor-relation and is the intra-experiment correlation).
The significance of the pooled effect size was determined using a Z test. Effect size was also compared to a t-test with the Satterthwaite correction (Pustejovsky, 2017) and to a likelihood ratio test based on Skovgaard’s statistic (Guolo and Varin, 2012) to confirm the validity of the findings. The effect size for each construct is presented in Table 1. Forest plots with the distribution of effect sizes were then generated for all constructs and categories (see app. Fig. A2). Visual inspection of graphs, Cochrane’s Q test, and the I2 Index were used to assess het-erogeneity in random-effects models. The variance components σ21 and σ22 were used to assess between- and within-studies heterogeneity, re-spectively, in the multilevel analysis. To address the small number of studies included in some of the analyses, two small sample corrections were performed: Satterthwaite p-values from the RVE (Pustejovsky,2017),and Skovgaard’s p-values from second-order likelihood in-ference (only for 2-level random effects) (Guolo and Varin, 2012).
2.4. Influential outcomes
Influential outcomes are considered outliers that exert a strong in-fluence on the results. To ensure the robustness of the results, influ-ential outcomes were removed from each group with at least four outcomes. They were identified by the function “influence” from the “metafor” package, and they are summarized in app. table 8. The analysis of influential studies identified 17 influential outcomes, which were eliminated from the original database.
2.5. Moderator analysis
A moderator analysis was conducted with predictors selected from previous literature (Borella et al., 2017a; Bürki et al., 2014; Lilienthalet al., 2013; Stepankova et al., 2014; Verhaeghen et al., 1992; Zinke et al., 2014), considering their influence in visuospatial and verbal WM
16
7
Table 1
Effects of working memory training compared with control group by construct.
Construct No. of No. of studies RE mean
effects (k) (clusters) Estimate 95% CI p-value Reasoning 33 24 0.10 [-0.026,0.233] .12 Verbal WM 40 20 0.23 [0.065,0.392] .006 ** Visuospatial WM 13 10 0.23 [0.029, 0.426] .025 * Verbal STM 12 11 0.16 [-0.045,0.363] .13 Visuospatial STM 6 5 −0.03 [-0.388, 0.324] .86 Reasoning 12 10 0.13 [-0.085, 0.347] .24 Verbal WM 17 9 0.23 [0.006, 0.457] .04 * Visuospatial WM 11 8 0.14 [-0.089, 0.368] .23 Verbal STM 6 6 0.18 [-0.097, 0.452] .205 Visuospatial STM 6 5 −0.04 [-0.334, 0.245] .763 RE mean Q-test I2 (%) τ 2 2 1 22
Skovgaard’s p-value RVE p-value
NA .13 28.53 11.51 NA 0.01 < 0.01 NA .01* 88.79 *** 56.13 NA < 0.01 0.09 NA .06^ 16.03 17.83 NA 0.02 < 0.01 NA .16 12.41 14.07 NA < 0.01 0.01 NA .74 09.06 45.24 NA < 0.01 0.08 NA .27 9.36 6.37 NA 0.01 < .01 NA .08^ 18.59 16.35 NA 0.01 0.01 NA .14 6.04 < 0.01 NA < 0.01 < 0.01 0.983 .19 3.85 < 0.01 < 0.01 NA NA NA .72 3.17 NA NA < 0.01 < 0.01
Note. ^p < .1, *p < .05, **p < .01, ***p < .001. NA – Not applicable (only for groups from the same experiment). I2 – total heterogeneity / total variability; 2 – estimated amount of total heterogeneity; 21 – Variancecomponent
of the 3-level model for the between-studies heterogeneity; 22– Variance component of the 3-level model for the within-studies (effects within studies) heterogeneity. RVE – Robust variance estimation.
Number of studies may be smaller than number of effects because each study may have more outcomes for the same construct. RVE and Skovgaard’s (only for 2-level random effects) were applied as a sensitivity analysis to check the robustness of the model. P-values did not differ substantially across these analyses indicating the validity of the model.
and STM, as well as, reasoning for both immediately after training and at follow-up. The following variables have been tested as moderators: 1) type of control (active or passive); 2) mean age of the participants; 3) training dose (total number of training in hours); 4) training length (in weeks); 5) total number of sessions; 6) training type (single i.e., com-plex/simple span, updating training or mixed training, i.e., combination of more than one type of WM task); 7) years of formal education; 8) category of the outcome (e.g., Cattell; RAPM; RSPM); 9) general cog-nitive ability (measured by the vocabulary test); 10) baseline perfor-mance. In this analysis, we used a 3-level random-effects model to as-sess the overall effect of WMT in post-test and follow-up for each construct, including each moderator separately.
2.6. Publication bias
To assess sensitivity to publication bias in this meta-analysis, dif-ferent complementary methods were utilized, namely, tests for funnel plot asymmetry (Egger et al., 1997), the trim-and-fill method (Duval and Tweedie, 2000a, 2000b),and the Henmi and Copas method (Henmi and Copas, 2010). The sensitivity analysis of the results was in-vestigated with the “leave-one-out method”. Given that publication bias is based on the symmetry of the distribution of the effect sizes in a funnel plot, if we compare very different measures, the distribution is not expected to be symmetric, and it may mislead the analysis. In our sample, studies adopted a large variety of tasks to measure the same construct. Thus, publication bias and the “leave-one-out” method were assessed by the categories of measures. Moreover, asymmetry of funnel plot was verified only in categories having at least 10 experiments, following literature recommendations (Sterne et al., 2011; Zhou et al.,2017). Finally, as these methods aim to identify significant differences between individual experiments, no more than one outcome per ex-periment can be included in a single plot. Therefore, for groups having at least two outcomes from the same trial, all possible combinations of subgroups, including exactly one outcome per trial, were considered to assess publication bias and the “leave-one-out” method. Funnel plots with the effect sizes of the included studies in all comparisons can be found in the supplementary material section (see Fig. A).
3. Results
The results are described in four major sections. First, we describe the different studies that were included in the analysis. Second, we present the small-study effect analyses. The third section targets the main aim of this review which was to verify the WMT effectiveness at posttest and follow-up together with the moderator analysis. Finally, the risk and publication bias results are presented.
3.1. Characteristics of included studies
We identified 300 studies (after removal of duplicates), from which 217 were excluded after reading the abstract and 59 after the full-text analysis. Criteria for paper exclusion: a) review paper; b) sample of non-human animals; c) young participants or elderly but not cognitively healthy participants; d) training does not exclusively target WM; e) the active control group performed a WM task; f) absence of control group;
g) studies whose sample has been previously used in a another study already included in the meta-analysis; h) WMT coupled with tDCS; i) incomplete data. Twenty-four articles (27 experiments) met the inclu-sion criteria (for a list of the included papers, see table B in the sup-plementary material) and were selected for the quantitative analysis, which included data for up to 1130 participants. All trials were pub-lished in the last ten years, with Psychology and Aging as the journal with
the highest number of publications.
The mean age of the participants ranged from 62.9–87.1 years (M = 69.5, SD = 4.9), and years of formal education ranged from 6 to 17 (M = 12,7 years, SD = 2.85). Of these studies, 79% were carried out in Europe (n = 19), with the remainder conducted in North America (n = 3; 13%) and Asia (n = 2; 8%). On average, studies implemented 12 training sessions (SD = 8.59; range = 3–40), corresponding to seven total hours (SD = 4.36; range = 1.5–20), with a mean session duration of 42 min (SD = 13.8; range = 20–60), and an average of three days of sessions per week (SD = 1.36; range = 2–7). Follow-up was reported in eight papers, with a mean of eight months after training (SD = 4.4; range = 3–18). The completion rate for the whole sample ranged from 70 to 100%. Most of the training was performed in laboratory settings (n = 16); however, six trials were conducted at participants’ homes. This information was not detailed in three papers (Richmond et al., 2011; Xin et al., 2014). In eight studies, participation was voluntary, one study included both pay and voluntary participation, ten articles reported financial compensation, and five papers did not mention this information.
Regarding the type of trained task (see app. table 4), studies were grouped into three major categories (Schmiedek et al., 2009; Shipsteadet al., 2012): complex or simple span task; updating; mixed (i.e., par-ticipants were trained on more than one type of WM task). Eight studies included a complex span task, participants were trained on a simple span task in one study (Zinke et al., 2011), and updating training was observed in ten studies. Five studies had mixed training. Regarding the modality of training (verbal vs. visuospatial), 10 studies included training with verbal stimuli, five included training with visuospatial stimuli, and the remaining nine were crossmodal. All studies, except Pergher et al. (2018); Xin et al. (2014); Zając-Lamparska and Trempała (2016), had adaptive training. Fourteen articles had an active control group, while ten had a passive control group (PCG). As seen in app. table 3, characteristics regarding type of training and control, outcomes and follow-up varied across studies.
Heterogeneity indexes among studies in the different analyses were low to moderate (Higgins et al., 2003). However, we opted for the random model considering the clinical and methodological hetero-geneity found among studies (Higgins and Green, 2008). Before pro-ceeding to the meta-analysis, small-studies effects were explored. The comparison between random-effect modelling, fixed-effect modelling and the Henmi and Copas method were conducted to address this issue. The results of this analysis are summarized in app. table 9. The con-clusions of the three models produced very similar results, and in 71% of the cases the difference was ≤ 0.001, not affecting the significance of the results. The most distinct case happened for verbal complex span at posttest, for which the mean effect from the random-effects model was 0.34, 95% CI = [0.09, 0.58], and the common effect from the fixed-effects model was 0.31, 95% CI = [0.14, 0.49]. In both cases, CI did not include zero, confirming its statistical significance. Ad-ditionally, sensitivity analysis confirmed that the meta-analytic findings were robust regarding the tested correlation coefficients. Indeed, by visual inspection of the table C in the supplementary material, it is possible to observe that when the correlation is assumed to be lower, at r = .3, or higher, at r = .7, the estimated summary effect varies by no more than 0.04.
3.2. WMT efficacy and moderator analysis
In this section the results from the effect of WMT on transfer task immediately after training (aim 1) and at follow-up (aim 2), as well as, a moderator analysis (aim 3) will be presented. Results from the clas-sical p-value or those corrected for small samples (Skovgaard’s and
RVE) did not differ considerably, so we reported the multi-level p-value in the text and all the values in Table 1. The comparisons only had a small difference between the multi-level p-value (p = .03) and the RVE (p = .06) for visuospatial WM in posttest and the multi-level p-value (p = .04) and RVE p-value (p = .08) for verbal WM at follow-up. Therefore, the results regarding visuospatial WM in posttest and verbal WM at follow-up should be interpreted with more caution.
We did not find any significant difference between the control types (passive versus active control groups) in the moderation analysis (see app table 10), except for visuospatial WM at posttest. Additionally, we performed a sensitivity analysis, running the analysis separately for passive and active control groups. The comparison with both passive and active control group merged did not yield an effect size greater than when we performed the comparison of experimental group with studies that included only an active control group, except for visuospatial WM at posttest. Many of the included trials had passive control group (n = 10). If we had excluded those trials from the analyses, some of the comparisons would have a very few studies, decreasing the power of the analyses. Accordingly, the results from both control groups were merged into a single control condition. The effect sizes were calculated comparing the experimental condition with the merged control condi-tion.
3.2.1. Aim 1: examining the generalization of training effects to non-trained tasks (near and far transfer)
WMT effects were examined on near transfer constructs (visuospa-tial and verbal WM, and visuospa(visuospa-tial and verbal STM) as well as on a far transfer construct (reasoning) immediately post-training.
Verbal WM: A significant transfer effect was identified for verbal WM (0.23; 95% CI [0.07, 0.39]).
Visuospatial WM: A significant transfer effect was identified for WM in the visuospatial modality (0.23; 95% CI [0.03, 0.43]).
Verbal and visuospatial STM: No significant transfer effects were identified for verbal (0.16; 95% CI [- 0.05, 0.36]) or visuospatial STM (-0.03; 95% CI [- 0.39, 0.32]).
Reasoning: For reasoning, the effects were not significant (p = .08) at posttest (0.10; 95% CI [-0.03, 0.23]).
3.2.2. Aim 2: verifying the maintenance of the effects at follow-up Concerning the long-term effects of WMT, we observed that the
effects were also observed during follow-up to verbal WM (0.23; 95% CI [0.01, 0.46]). However, in visuospatial WM analysis, the effect was not
Table 2
Moderator effects (significant results).
significant (0.14; 95% CI [- 0.09, 0.37]). Regarding reasoning, results were also not significant (0.13; 95% CI [-0.09, 0.35]), as well as for verbal STM (0.18; 95% CI [- 0.10, 0.45]) and visuospatial STM (-0.04; 95% CI [-0.33, 0.25]).
3.2.3. Aim 3: testing moderator variables
Here we examined if the variable age, training dose, number of sessions, training type, training duration, years of formal education, vocabulary score, baseline performance and type of outcome might moderate training effects. The results are presented in Table 2. The moderator analysis was significant (p < .05) for number of sessions, training length (in weeks) and training dose (in hours), i.e., the gains in reasoning and verbal STM immediately after training are small when training duration increases. Additionally, while the effect of WMT on verbal STM was linearly moderated by training hours and training length, the effect of WMT on Reasoning-posttest was also moderated by the former factors together with the number of sessions. Table 2 out-lines these moderator roles. Indeed, the approximation by higher polynomial degrees were also assessed but, in each case, no advantage over the linear approach was observed. Specifically, no asymptotic behaviour was detected, as such characteristic would imply a sig-nificant variation in the rate of change of the WMT effect with respect to the corresponding independent variable.
Regarding the training type, we observed that the studies that in-cluded mixed training (i.e., having more than one type of WM tasks) had smaller effects on reasoning immediately after training than the training of updating or complex span tasks alone. Additionally, studies having the Cattell Test as an outcome displayed a higher gain than studies that used other measures at posttest (RAPM; RSPM; LPS). For verbal WM, the gains were higher in complex span tasks than in simple span and updating tasks at posttest. Type of control group was a sig-nificant moderator for verbal WM at posttest, with the effect size of studies using a passive control group being higher than studies that used an active control group. Finally, baseline performance moderated the effects on visuospatial STM at immediate posttest, with participants with lower performance showing more benefits with the training.
In summary, WMT had a small significant and long-lasting effect on verbal WM (specifically on complex span outcomes). For visuospatial WM, gains were only observed at posttest, but not at follow-up. Far transfer for reasoning was not observed. Training length, number of sessions, training dose (total training duration in hours), type of training and adopted outcomes (Cattell; and complex span), type of
Construct Moderator effect Estimate SE p-value QE QM – Test of moderators 21 22
Reasoning at immediate posttest Measure – Cattell 0.39 0.14 .005** 20.70 7.82 ** < 0.01 < 0.01 Training dose (hours) −0.04 0.01 .001 ** 17.46 11.040 *** < 0.01 < 0.01
Number of sessions −0.02 0.01 .004** 20.17 8.35** < 0.01 < 0.01
Training length (in weeks) −0.11 0.04 .004 ** 20.38 8.15 ** < 0.01 < 0.01 Verbal WM at immediate posttest
Training Type – Mixed −0.41 0.13 .001** 18.36 10.16 ** < 0.01 < 0.01
Measure – Complex span 0.27 0.13 .046 *** 80.67 4.00 * < 0.01 0.08
Visuospatial WM at immediate posttest Control – PC – AC 0.54 0.24 .023* 10.86 5.17 * < 0.01 < 0.01 Verbal STM at immediate posttest Training dose (in hours) −0.04 0.02 .043* 8.33 4.08* < 0.01 < 0.01 Visuospatial STM at immediate posttest
Training length (in weeks) −0.11 0.05 .033* 7.89 4.53* < 0.01 < 0.01
Baseline performance −0.06 0.02 .01* 2.33 6.73** < 0.01 < 0.01
Note. *p < .05, **p < .01, ***p < .001; 21– Variance component of the 3-level model for the between-studies heterogeneity; 22– Variance component of the 3-level model for the within-studies heterogeneity. QE – test for residual heterogeneity when moderators are included. QM – test statistic for the omnibus test of coefficients. Moderator effects with non-significant results were not presented, they were mean age of the participants, years of formal education, vocabulary performance. Analyses of follow-up did not have any significant moderator.
control group and baseline performance appeared as significant mod-erator variables at posttest assessment.
3.3. Publication and risk of bias
Assessment of risk of bias is important when performing a review because it is an index of the quality of included data, and it could also explain heterogeneity when it is highly observed (Viswanathan et al.,2008). Two authors independently assessed the risk of bias. In general, we observed a substantial absence of information for most studies, which limited the ability to classify the risk of bias. Considering the randomization processes (sellection bias), 19% of the studies presented risk of bias, whereas in 74% the risk of bias was not clear. Seven percent of the studies adequately reported random sequence generation. Re-garding allocation concealment, 22% presented a high risk of bias, 7% adequately reported data, and the remaining 70% did not report on allocation concealment. For blinding (performance bias), 30% of the studies had low risk of bias (compared with 30% with high risk), and 40% of the studies did not mention blindness procedures. Seventy percent of the studies did not exclude data from participants who dropped out or with missing data. Fifteen percent had high risk of in-complete outcome data, while this was not clear in 15% of the studies. Generally, the studies had high completion rates (ranging from 86% to 100%), although the completion rate was not clear for all studies. Si-milarly, most articles (93%) reported all outcomes, although they did not state which outcome was the primary. Seven percent presented high risk of selective reporting. Additionally, the lack of adequate correction for multiple comparisons and for baseline group differences were other potential bias observed here. Another possible source of bias was the lack of appropriate screening measures of cognitive decline and of af-fect disorders such as anxiety and depression. A summary graph of the risk of bias is displayed in app. Fig. 3.
Analysis of publication bias assesses if the set of evidence is biased due to the fact that positive findings are more likely to be published. The analysis of several methods of publication bias (trim-and-fill, leave-one-out, asymmetric tests, and Hemni and Copas) suggested a small presence of publication bias, although it did not seem to substantially alter the results. Trim-and-fill is a method that estimates the number of studies missing in the funnel plot (Duval and Tweedie, 2000b). It was only used in analyses with at least 10 studies; otherwise, the test would not have sufficient power to verify asymmetry (Sterne et al., 2008; Zhouet al., 2017). This analysis suggested the presence of publication bias inonly two cases (simple span and complex span at posttest). Ad-ditionally, given that the big issue of publication bias is that the positive results are more representative in the published literature (Mlinarićet al., 2017), it is important to highlight that trim-and-fill method identified only two cases of missing studies (verbal simple span STM and verbal updating WM, both at posttest), however the effect sizes of the corresponding categories were not significant in verbal simple span STM and verbal updating WM at posttest.
The leave-one-out method was performed by a sensitivity analysis where one study at a time was removed from the analysis to verify the influence of a single study in the finding. This method showed sensi-tivity of results to individual studies in three cases (verbal fwd simple span at posttest; Cattell and verbal complex span at follow-up). However, in the first two cases, the elimination of a unique experiment would cause a significant pooled effect size, while only for complex span the elimination of a study (among three) would cause a non-significant result. Asymmetric tests indicated publication bias in only one case (verbal simple span at posttest), the same comparison already
identified with the trim-and-fill method. Finally, in all cases, the Hemni and Copas robust estimation was not significantly different from the random-effects results, showing that publication bias did not change the overall meta-analytic effects in a significant manner. Therefore, the positive effect of publication bias was not a big issue here.
Overall, the presence of bias did not seem to influence the results as supported by the former publication bias methods (see app. table 9), as well as, by the similarity between effect sizes of studies that presented more criteria classified as high risk of bias (see app. Fig. 3) (e.g., Goghari and Lawlor-Savage, 2017; Heinzel et al., 2016; Stepankova et al., 2014; Zinke et al., 2011) and those having a lower risk of bias (e.g., Borella et al., 2017b, 2013; Guye and von Bastian, 2017; Langeand Süß, 2015; Weicker et al., 2018).
4. Discussion
This meta-analytical review aimed to verify the gains of WMT on transfer measures in healthy older adults. In contrast to previous meta-analyses, we used different analytical methods to address multiple outcomes and the lack of correlation reports. Additionally, a description of the studies included in the review is provided along with a com-prehensive overview of different studies in the WMT field.
The high variability between the experiments challenged data ag-gregation and, consequently, data interpretation. The studies presented different experimental and control tasks (see app. table 4 and app table 5), different outcomes (see app table 7), and training protocols. Follow-up also varied broadly across trials, although it was seldom included in the experimental protocol (see app table 3).
Regarding the results of the effectiveness of WMT at posttest (aim 1), participants assigned to a WMT group displayed a small significant near transfer effect size of 0.2 for verbal and visuospatial WM, com-pared to the participants who received a placebo or non-intervention. These results are in line with previous meta-analyses that have shown small to medium near effect sizes immediately after training (Karbach and Verhaeghen, 2014; Melby-Lerväg et al., 2016; Melby-Lerväg and Hulme, 2013). For example, Karbach and Verhaeghen (2014) observed a small near effect size of 0.3 after removal of publication bias (trim-and-fill method). We also observed that WMT had no significant impact on STM, which conflicts with the results of previous research (Schwaighofer et al., 2015). These differences among studies may be due to methodological differences, as Schwaighofer and colleagues (2015) included older adults as well as children and young adults. Moreover, it might be the case that the lack of effect in STM may be due to a preservation of this ability with age (Nittrouer et al., 2016; Olsonet al., 2004). Therefore, there is less room for transfer in this ability after WMT. Nevertheless, this hypothesis needs to be further explored as there was one study showing a strong positive effect of WMT on STM (Heinzel et al., 2013). As we observed in the moderator analysis, variables such as the training dose and length, as well as, baseline performance interfered with the effects, which may cause heterogeneity across studies. For the reasoning, there was no significant transfer ef-fect. In fact, a previous meta-analysis (Karbach and Verhaeghen, 2014) only yielded a “marginally significant” far transfer effect that was not fully corroborated by our study with a greater number of WMT trials included in the analysis.
With respect to the WMT long-term effects (aim 2), only ten studies reported follow-up assessments; therefore, the results should be con-sidered with caution. Near transfer effects seem to be maintained at follow-up only for verbal WM. These results are in agreement with Schwaighofer et al. (2015) and partially consistent with Melby-Lerväg
et al. (2016; 2013), who only observed a significant maintenance effect in WM outcomes.
We performed a moderator analysis with the following variables as moderators of transfer effects on STM, WM and reasoning at posttest and follow-up (aim 3): 1) type of control (active/passive); 2) the mean age of participants; 3) training dose (total number of training in hours); 4) training length (in weeks); 5) number of training sessions; 6) training type (single: complex span or updating; mixed training: more than one type of WM task); 7) years of formal education; and 8) category of the outcome (e.g., Cattell; RAPM; complex span); 9) vocabulary score; 10) baseline performance. The variables that explained heterogeneity of the effect sizes in reasoning at posttest were the category of the outcome (i.e., Cattell), training length/dose, number of training sessions, and training type (i.e., mixed training). For verbal WM at posttest, the ca-tegory of the outcome (i.e., complex span) was the variable that ex-plained heterogeneity of the effect sizes. This means that studies having complex span as outcome found more positive effects than studies using another WM measures. For visuospatial WM at posttest, the type of control group (active versus passive) was a significant moderator, with studies using passive control groups presenting higher effect sizes. For verbal STM at posttest, training length and hours were the significant moderators. For visuospatial STM at posttest, baseline performance moderated the results, with participants with lower performance gaining more with the training.
The fact that some measures (i.e., Cattell Test and Complex Span Task) displayed more significant effect sizes than others in the mod-erator analysis highlights the role of the measures to evaluate the training effects. For reasoning, the effect size on the Cattell Test was significant, showing a positive moderation effect of this test on far transfer. This result is in line with the results of previous reviews which showed a slightly larger effect of the Cattell Test compared to Raven’s Test (Mansur-Alves and Silva, 2017). This finding could be explained by the fact that the Cattell Test consists of different subtests (series, ana-logies, matrices and classification), which may position it as a more complete indicator of reasoning compared to tests that only have figural type items (e.g., Raven), as postulated by Gignac (2015). Furthermore, this result is consistent with the claim of Shipstead et al. (2012) re-garding the importance of having different instruments to assess transfer effects in the experiments, ensuring that all facets of the con-struct are assessed.
Considering the moderation effect of training dose/length, either in reasoning or verbal STM, we found unexpected results. For both vari-ables, the results showed a significant negative effect, i.e., that more training duration (total number of hours and length) produced smaller effect sizes. Other variables probably influenced this analysis, such as the type of training performed: most of the shorter duration studies applied the same training task which may be more effective than the training adopted by the long-duration studies (Borella et al., 2017a). It is also noteworthy that only one study had higher dosages of training (more than 15 h) (Goghari and Lawlor-Savage, 2017), whereas six out of twenty had only three sessions (Borella et al., 2017b, 2014, 2013, 2010; Cantarella et al., 2017b, 2017a). Previously, Karbach and Verhaeghen (2014) and Melby-Lerväg and Hulme (2013) failedto finda significant influence of total training duration in effect size, except for one measure, the Stroop task in Melby-Lerväg and Hulme (2013). In contrast, Schwaighofer et al. (2015) found a positive influence of total training duration on visuospatial STM and of session duration on verbal STM. Weicker et al. (2016) documented a positive correlation between the number of sessions and the effect sizes. In this case, the authors compared two groups (> 20 sessions vs. < 20 sessions) and observed
that more training sessions produced larger effect sizes. Nonetheless, the total number of hours was not related to the effect size (> 10 h vs. < 10 h). Finally, similar to our results, a previous meta-analysis on video-game training have shown that short training produced stronger effects than long training (Toril et al., 2014). These discrepant findings need to be further addressed in new randomized controlled trials.
Other factors such as motivation and performance anxiety should also be considered (Delphin-Combe et al., 2016; Jaeggi et al., 2014). As participants are older adults, some of them may be unfamiliar with the use of computers (most of the trainings are computerized), and long training durations may lead to demotivation (Laguna and Babcock, 1997). Additionally, participants might not be receptive to extensivetraining because the training would compete with their other activities for time. Another finding worth considering is the fact that mixed training negatively moderated the effects on reasoning. In other words, the experience of different tasks in the same programme may be less effective than repeating the same task or similar tasks during the training (for similar results, see von Bastian et al., 2013). Perhaps tar-geting a specific process during training yields sizeable gains, whereas the training of multi-WM processes may lead to a competition for re-sources that underpin the transfer effects.
In short, considering the aim 1 (effectiveness at posttest), our results supported only the presence of near transfer effects. For the aim 2 (effectiveness at follow-up), our results supported the maintenance of near transfer effects only on verbal WM. For the aim 3, our data sug-gested that the type of outcome (Cattell and complex span), total training duration/length/number of sessions, baseline performance, type of control group and type of trained task (mixed task) moderate the transfer effects.
Melby-Lerväg and Hulme (2016) identified two main problems with previous meta-analyses that showed promising effects of WMT (Auet al., 2015; Karbach and Verhaeghen, 2014). The first was related tothe calculation of a mean effect size without considering the baseline performance. It is noteworthy, however, the absence of correlations between baseline and posttest assessment in the original papers chal-lenges the calculation of the Hedge’s g change variance. To address this issue, in this review, the effect size calculation was based on the pre- to posttest score difference (Borenstein et al., 2009; Morris, 2008), and we also ran a sensitivity analysis with different values of correlation coefficients.
The second problem pointed out by the authors was the importance of comparing studies with active versus passive control groups. To address this, we performed a moderator analysis with the type of con-trol as moderator which showed a significant effect only for visuospatial WM at posttest (see App Table 10). We also ran a sensitive analysis with active and passive control group separately (see supplementary mate-rial, table D). The effect sizes did not change considerably from the previous results with the merged control group. The exception was the visual WM atposttest in which the results became insignificant. In this analysis, results from RVE and multi-level p-value also differed from each other showing that this finding needs further evidence. Moreover, it is noteworthy that one influential study with a big positive effect size (Borella et al., 2014 – experiment 1) was excluded. If we had kept this study, the analysis would be significant either case. Probably there is in fact an effect in the visuospatial WM, however given the inconsistency in different analysis, it is not possible to draw a clear conclusion.
In contrast, in the study of Melby-Lerväg and Hulme (2016), some of the meta-analytical results changed when the analysis was performed separately for active and passive control groups. Our findings partially corroborated the results of Weicker et al. (2016), Melby-Lerväg and
Hulme (2013), and Karbach and Verhaeghen (2014) that did not find a significant influence of the type of control condition in the outcomes. It is noteworthy, however, that Melby-Lerväg and Hulme (2016) had a diversified sample, including a broader range of ages and learner status within the same analysis, which may explain the differences found.
Relatively to the assessment of risk of bias, most authors did not report data regarding random sequence generation, allocation con-cealment, and blinding. Among the other risks of bias identified, some trials have performed multiple outcome comparisons without correc-tion or did not use validated screening measures of cognition and affect. Other experiments showed differences between conditions at baseline, most likely due to inappropriate randomization. Some studies were exploratory, not stating primary/secondary analysis, nor including a priori sample size calculations. Nonetheless, in the current review, the risk of bias was not problematic since the same pattern of results was found both in studies that fulfilled most of the criteria and in studies that satisfied only a few. Additionally, more recent studies considered this limitation and implemented a more appropriate experimental de-sign (Guye and von Bastian, 2017; Weicker et al., 2018).
The primary limitation of this review is the fact that we pooled different methodological studies together. However, we have done moderator analyses and combined outcomes in categories to address this variability. Second, although we considered a Ph.D. thesis, we did not perform an extensive grey literature search, which may have in-troduced publication bias in our analysis. It is noteworthy, however, that publication bias analysis did not indicate a strong presence of such bias, especially regarding positive statistical effects. Third, in some comparisons, we had a low number of trials included (n < 10), espe-cially with follow-up analyses. Fourth, some of the included studies had a small sample in each comparison (n < 20). Even though, this lim-itation was addressed in the analysis by applying corrections for small samples to the effect size calculation. Fifth, two studies were not in-cluded due to the lack of replies from the contacted authors (missing data). Finally, our results may not be valid for the whole ageing po-pulation because most studies were conducted with a selective popu-lation. To illustrate, most trials had participants with a high level of schooling (M = 12.67 years), and most of trials had younger older adults as participants (M = 69.55). Therefore, additional studies with older populations and participants with lower levels of schooling are needed (e.g., da Silva and Yassuda, 2009; Golino and Flores-Mendoza,2016).
Finally, some recommendations are suggested for future studies in the WMT field. New trials should address different training formats that
are best suited for the elderly (i.e., optimal session duration, total in-tervention time and intervals between sessions) (e.g., Penner et al.,2012). Another critical point is related to the importance of increasingthe training level of difficulty. In our sample, 95% of the trials were adaptive, meaning that the trained task was adjusted in difficulty ac-cording to the participants’ performance. However, von Bastian and Eschen (2016) found that participants did not perform better withadaptive tasks than with tasks of self-selected difficulty. Furthermore, a next step could be to compare different WMT programmes as illustrated by Basak and O’Connell (2016), who showed a superiority effect of an unpredictable memory updating training over a predictable one. We also encourage comparisons between web-based interventions and more traditional laboratory approaches (Schwaighofer et al., 2015). Subsequently, researchers should verify how to keep participants en-gaged in the training programmes. For example, group cognitive trainings could be more motivating then individualized trainings (Kelly et al., 2014). Other approaches such as combining techniques (e.g., non-invasive electrical brain stimulation or physical exercise) could boost WMT effects (Oswald et al., 2006; Teixeira-Santos et al., 2015).
Protocols should be designed to follow participants over more ex-tended periods of time. The outcomes selection could also be rethought. Namely, we could have different outcomes to assess different facets of the same construct (Weicker et al., 2018), and we could account for more clinical relevance and external validity. For example, some pro-mise has been seen regarding the generalizability of results for real life: Cantarella et al. (2016) used everyday problem solving and timed basic daily activities as outcomes; Lange and Süß (2015) had questionnaires for cognitive failures in everyday life; Takeuchi et al. (2014) assessed the effect of WM training on emotional states; and Borella et al. (2019) assessed transfer for everyday life in old-old participants. Eventually, subjective cognitive functioning could be included. Similarly, surrogate outcomes, such as magnetic resonance imaging and electro-physiological recordings, could be used to support the efficacy of the intervention and to define the best training protocol regarding brain plasticity (Buschkuehl et al., 2012; Dahlin et al., 2008b; Heinzel et al.,2016; Takeuchi et al., 2014, 2013).
Other factors that may moderate gains (e.g., motivation; person-ality; financial compensation) should be further scrutinized (Au et al., 2015; Borella et al., 2013; Zinke et al., 2011). Regarding the popula-tion, studies with different age and formal education subgroups are warranted. To the best of our knowledge, no former study in the field has been conducted with illiterate people, mainly because few studies are carried out in developing countries. However, this group is more
Fig. 1. Schematic representation of the main findings of the current meta-analysis. X = non-significant results; Solid line = significant results; ↓ = negative mod-erating effect;↑ = positive moderating effect.
vulnerable to cognitive decline (Brucki, 2010) and in need of cognitive care opportunities. Finally, regarding risk of bias, future studies should be careful about the proper implementation of the randomization pro-cess, allocation concealment, blinding, incomplete outcome and data reporting.
5. Conclusion
Neuroplasticity, the brain and behavioural capacity of restructura-tion according to environmental demands, is verified even in late stages of development (Landi and Rossini, 2010), and WMT has been studied as a promising tool to promote it. Our analysis suggested the general-ization of WMT to near transfer tasks. Far-transfer effects were not verified, except for the studies whose Cattel Test was used to assess reasoning. Moderator analysis did not show the influence of type of control group (active versus passive), except for one comparison: vi-suospatial WM at posttest. Importantly, the adopted measures, type of training, training length and duration, baseline performance were sig-nificant variables moderating the effects sizes. Overall, the general-ization of WMT seems to be limited to the WM construct (see Fig. 1).
Appendix A
Fig. A1. PRISMA flow diagram.
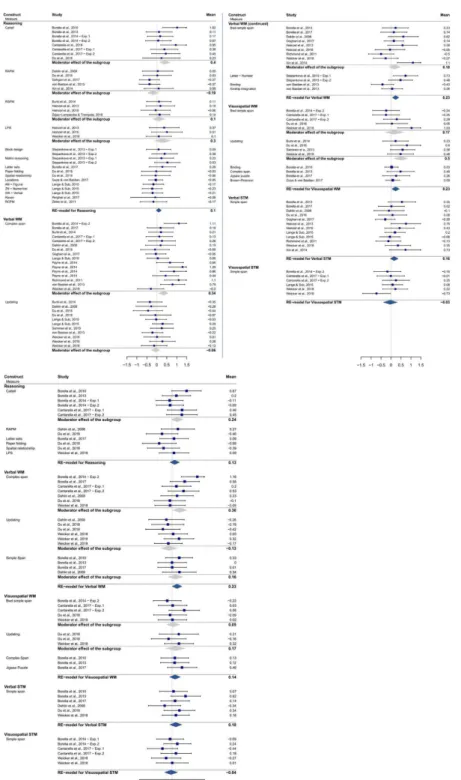
Fig. A2. Posttest Forest plots. Note. Pooled effect size for subcategories (grey diamond) and constructs (blue diamond).
Appendix B. Supplementary data
Supplementary material related to this article can be found, in the online version, at doi:https://doi.org/10.1016/j.neubiorev.2019.05.009.
References
Au, J., Sheehan, E., Tsai, N., Duncan, G.J., Buschkuehl, M., Jaeggi, S.M., 2015. Improving fluid intelligence with training on working memory: a meta-analysis. Psychon. Bull. Rev. 22, 366–377. https://doi.org/10.3758/s13423-014-0699-x. Bäckman, L., Lindenberger, U., Li, S.-C., Nyberg, L., 2010. Linking cognitive aging to
alterations in dopamine neurotransmitter functioning: recent data and future
ave-A., Laine, M., Nyberg, L., 2017. Increased dopamine release after working-memory updating training: neurochemical correlates of transfer. Sci. Rep. 7. https://doi.org/ 10.1038/s41598-017-07577-y.
Ball, K., Berch, D.B., Helmers, K.F., Jobe, J.B., Leveck, M.D., Marsiske, M., Morris, J.N., Rebok, G.W., Smith, D.M., Tennstedt, S.L., Unverzagt, F.W., Willis, S.L., 2002. Effects of cognitive training interventions with older adults: a randomized controlled trial. JAMA 288, 2271–2281. https://doi.org/10.1001/jama.288.18.2271.