Evaluating the Impact of Storage Capacity Constraints on
Vehicular Delay-Tolerant Networks
Vasco N. G. J. Soares
1,2,3, Farid Farahmand
4, and Joel J. P. C. Rodrigues
1,21
Instituto de Telecomunicações, NetGNA Group, Portugal
2
Department of Informatics, University of Beira Interior, Covilhã, Portugal
3
Superior School of Technology, Polytechnic Institute of Castelo Branco, C. Branco, Portugal
4Department of Engineering Science, Sonoma State University, CA, USA
[email protected]; [email protected]; [email protected]
Abstract
Vehicular Delay-Tolerant Network (VDTN) was proposed as a particular application of a mobile Delay-Tolerant Network (DTN), where vehicles act as the communication infrastructure for the network, relaying messages between the network nodes. In this paper, we consider the use of a VDTN to provide low-cost asynchronous communication between sparse populations spread over a remote vast region. We analyze the influence of the VDTN network node’s storage capacity (buffer size), on the efficiency of four DTN routing protocols, in terms of message delivery probability. Our scenarios show that the routing protocols message replication strategies react differently to the increase of buffer size in specific network nodes. Epidemic and MaxProp protocols benefit from the increase of the storage capacity on all network nodes. Spray and Wait protocol only takes advantage on the increase of the vehicle’s buffer capacity. We expect that this paper will provide a deep understanding of the implications of storage constraints over the performance of a VDTN, leading to insights for future routing algorithm and buffer management theoretic studies and protocol design.
1. Introduction
The Delay-Tolerant Networking (DTN) [1] paradigm was proposed to address communication issues in challenged environments with sparse intermittent connectivity, long or variable delays, asymmetric data rates, high loss rates, and even when no end-to-end connectivity exist. The DTN concept has been applied to various areas including interplanetary networks [2], underwater networks [3], wildlife tracking sensor networks [4], and networks to benefit developing communities [5].
Vehicular Delay-Tolerant Network (VDTN) is a particular application of a mobile DTN, where vehicles are opportunistically exploited to offer a message relaying service [6]. In this paper, we consider the use of a VDTN to provide a low cost solution to connect villages located in a vast geographical area with a sparse population density, and where a telecommunications infrastructure is not available. In such a scenario incurred delays are high and unpredictable, intermittent connectivity is common and data paths exist over time.
To cope with disconnection, fixed or mobile network nodes store data on their buffers for long periods of time, while waiting for new opportunities to forward data to intermediate nodes or to the final destination. Therefore, intuitively, the storage capacity of the network nodes may affect the end-to-end-performance of the network. Using a map-based model of a Portuguese rural dispersed region, we analyze by simulation the efficiency of buffer resource utilization on four DTN routing protocols applied to a VDTN, comparing their performances in terms of overall message delivery probability.
The remainder of this paper is organized as follows. Section 2 describes the VDTN architecture and identifies our contribution. Section 3 presents the simulation scenarios and analyzes the obtained results. Section 4 concludes the paper and provides guidelines for future work.
2. Vehicular Delay-Tolerant Network
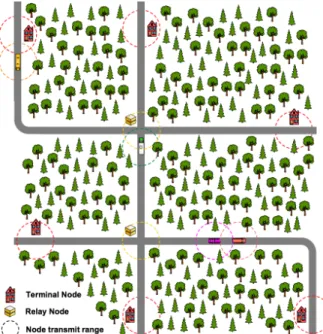
VDTN architecture model is based on the three node types presented on figure 1: terminal nodes,
mobile nodes, and relay nodes. Terminal nodes are
located in isolated villages and provide network connection to end-users. Mobile nodes (e.g., vehicles) act as the communication infrastructure for the network, collecting and disseminating data. They move
on roads and carry data between terminal nodes (figure 2). Relay nodes are store-and-forward stationary devices located at crossroads. They allow mobile nodes that pass by to collect and leave data on them, thus improving the overall message delivery probability [7]. When mobile nodes meet, they can exchange data with one another.
Figure 1. Example of Vehicular Delay-Tolerant Network nodes
Vehicular Delay-Tolerant Networking store-carry-forward paradigm is used to deal with intermittent connectivity. In these networks the same message can be spread to multiple nodes in order to increase message delivery probability and reduce message average delay. However, messages can be dropped in cases of buffer overflow.
Several network parameters have an impact on the end-to-end performance of a VDTN. The number of mobile nodes, their mobility pattern and speed can influence the overall performance of the network. Furthermore, network nodes interactions, cooperation, and their design characteristics, such as, power, storage capacity, transmit range, and physical link rate should also be considered.
Whereas the size of the nodes buffers, it is also important study how nodes use their buffers. Large buffer capacities may not be sufficient to increase the probability of messages to arrive at their destinations, and buffer management schemes may be necessary.
Thus, this paper studies the impact of varying the buffer size of terminal nodes and mobile nodes, on four multiple copy DTN routing protocols applied to a VDTN. The motivation to introduce different values to the terminal node’s buffer size comes from the fact that besides being traffic sources and traffic sinks, if sufficient storage is available, they can also implement the functionality of relay nodes. Therefore, a terminal
node can store data destined for any other terminal node(s), which was leaved there by a mobile node. This
process is illustrated in figure 2. Intuitively, this will improve the overall message delivery ratio.
We consider three different scenarios, where the number of mobile nodes is increased and, therefore, the number of transmission opportunities is augmented (and the overall network load). The objective is to determine if increasing the node’s buffer size has a direct effect on augmenting the overall message delivery ratio.
Figure 2. Mobile nodes carrying data between terminal nodes
3. Performance Assessment
In order to evaluate how the terminal nodes and
mobile nodes buffer sizes affect the VDTN
performance, a simulation study is performed using the Opportunistic Network Environment (ONE) Simulator [8]. We are interested on the performance evaluation of the overall message delivery ratio (measured as the relation between the number of unique delivered messages and the number of sent messages). The following four widely applicable multiple copy DTN routing protocols are considered: Epidemic [9], MaxProp [6], PRoPHET [10], and Spray and Wait [11].
Epidemic is a flooding-based routing protocol where nodes exchange the messages they don’t have. In an environment with infinite buffer space and bandwidth, this protocol performs better than the other ones in terms of message delivery ratio and latency,
providing an optimal solution. MaxProp prioritizes the schedule of messages transmitted to other nodes and also the schedule of messages to be dropped.
PRoPHET is a probabilistic routing protocol that considers a history of encounters and transitivity. It considers that nodes move in a non-random pattern, and applies “probabilistic routing”. Spray and Wait protocol creates a number of copies N to be transmitted (“sprayed”) per message. In its normal mode, a source node A forwards the N copies to the first M different nodes encountered. In the binary mode, any node A that has more than 1 message copies and encounters any other node B that does not have a copy, forwards to B the number of N/2 message copies and keeps the rest of the messages. A node with 1 copy left, only forwards it to the final destination. We evaluate both the normal and binary modes, with 12 message copies.
Next, subsection 3.1 presents the simulation settings. The experimental results of each scenario are discussed on subsections 3.2 to 3.4.
3.1. Simulation Settings
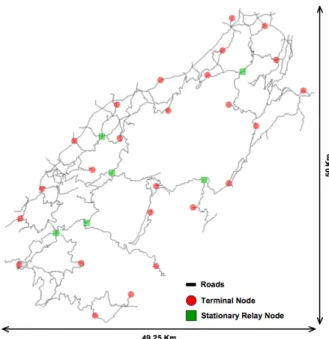
Using Google™ Maps [12] and OpenJUMP Geographic Information System [13], we have modelled a real-world map of the Serra da Estrela
Region, a Portuguese Mountain Region that covers a
dispersed area with approximately 2500 Km2. This map-based model is shown on figure 3.
We analyze three different scenarios with 6, 12, or 18 mobile nodes moving between terminal nodes. For each of those scenarios we change the buffer size of the terminal nodes and the mobile nodes.
The study assumes 25 real-world sparse village locations to place the terminal nodes (Figure 3). Each
terminal node is simultaneously a traffic source and a traffic sink. It also generates messages using an
inter-message creation interval in the range [5, 15] minutes of uniformly distributed random values. Each message has a size in the range [500 KB, 2 MB] of uniformly distributed random values. All the messages have an infinite time to live (TTL). Terminal nodes have a FIFO message buffer whose size changes between 100, 200, 300, 400 and 500 Mbytes across the simulations, for each scenario.
Six relay nodes with 1 Gbyte FIFO message buffer were placed at the crossroads, as shown in Figure 3. The results collected during the simulations guarantee that this amount of storage is large enough, and does not bias the results presented on next subsections.
Figure 3. Serra da Estrela Region simulation area with the locations of the terminal nodes
and the relay nodes
Mobile nodes only move between terminal nodes.
When a mobile node reaches a terminal node, it randomly waits 15 to 30 minutes. Then, selects a random terminal node (different from the previous one) as its next destination. Afterwards, a random speed between 30 and 80 km/h is selected, and the
mobile node moves over there using the shortest path.
Every terminal node has equal probability for being selected.
Mobile nodes have a FIFO message buffer whose
size changes between 200 and 400 Mbytes across the simulations, for each scenario. When mobile nodes are in contact with terminal nodes they try to deliver the messages stored in their buffers. Each of the messages successfully delivered is removed from the buffer, freeing essential storage space.
All the network nodes connect to each other using 802.11b with a data rate of 6 Mbit/s [14], and a transmission range of 350 meters using omni-directional antennas. Terminal nodes and relay
nodes only exchange data with mobile nodes. In
addition, mobile nodes can communicate between themselves.
For each scenario, the network nodes will exchange messages during twelve real time hours (simulated). The traffic matrix is not provided in advance, and the network behavior is non-deterministic. We run series of simulations using different random seeds, and report the mean values.
3.2. Results with 6 Mobile Nodes
In order to evaluate the impact of the nodes storage constraints on the overall message delivery probability, we first consider a scenario where 6 vehicles (mobile
nodes) with a 200 MB buffer, carry data (messages)
between terminal nodes. The results collected during simulation, shown that 100 MB are enough to store all messages created by a terminal node during the twelve (simulated) hours. This is due to the messages creation interval, and their possible sizes. The terminal node’s buffer size changed between 100 MB and 500 MB.
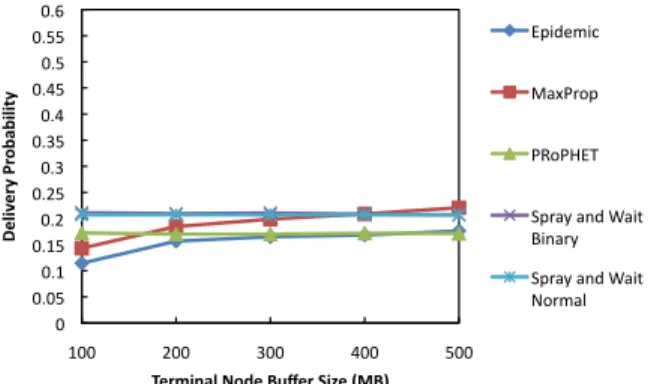
Figure 4 shows the message delivery probability for six mobile nodes with 200 MB buffer. As may be seen, the Epidemic flooding approach benefits from the increase on the terminal node buffer size, augmenting its delivery probability. This effect is more evident when the buffer size increases from 100 MB to 200 MB. Furthermore, increasing the buffer size only slightly augments the delivery ratio. This is caused by the limitation introduced by the number of mobile
nodes and their buffer size that restricts the
dissemination of messages. MaxProp protocol also floods, but after delivering messages explicitly clears them. It performs better than the other protocols when buffers with 400 MB or 500 MB are deployed. PRoPHET registers similar delivery ratios across the simulations. Spray and Wait binary and normal variants limit the number of copies of each message (for twelve, in our case). Both variants register similar values across the simulations. When terminal nodes have buffer size smaller than 300 MB, they perform better than the other protocols.
!" !#!$" !#%" !#%$" !#&" !#&$" !#'" !#'$" !#(" !#($" !#$" !#$$" !#)" %!!" &!!" '!!" (!!" $!!" !"#$% "& '()& *+,+$#$-'( ."&/$0,#(1*2"(345"&(6$7"(893:( *+,-./,0" 123456+" 47648*9" :+52;"2<-"=2,>" ?,<25;" :+52;"2<-"=2,>" @65/2A"
Figure 4. Message delivery probability using 6 mobile nodes with 200 MB buffer Even though, increasing terminal node’s buffer size augments the delivery probabilities for two of the routing protocols, all routing protocols still register low delivery ratios. Since mobile nodes are responsible for physically carry data, their buffer size was increased to
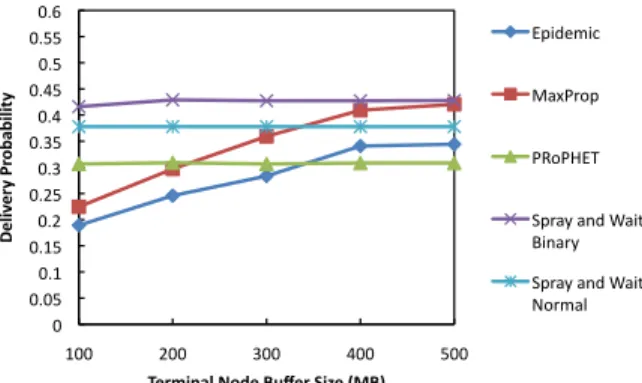
400 MB, allowing them to store and transport a larger number of messages. The effect of this modification is shown on figure 5.
As it can be observed, all routing protocols increase their delivery probabilities. Like previously, PRoPHET and Spray and Wait present a behavior where no significant effect is registered by changing the terminal
node’s buffer size. In this case, the Spray and Wait
binary variant performs better than the other protocols. As expected, increasing the mobile nodes and terminal
nodes buffers sizes reduces the effect of Epidemic poor
utilization of the network storage resources. Its performance approximates to MaxProp and Spray and Wait. !" !#!$" !#%" !#%$" !#&" !#&$" !#'" !#'$" !#(" !#($" !#$" !#$$" !#)" %!!" &!!" '!!" (!!" $!!" !"#$% "& '()& *+,+$#$-'( ."&/$0,#(1*2"(345"&(6$7"(893:( *+,-./,0" 123456+" 47648*9" :+52;"2<-"=2,>" ?,<25;" :+52;"2<-"=2,>" @65/2A"
Figure 5. Message delivery probability using 6 mobile nodes with 400 MB buffer PRoPHET behavior is caused by its “probabilistic routing” approach. When buffers over 400 MB are deployed it performs worse than the other protocols. Therefore, in this scenario, it does not take any advantage of large buffers. Finally, comparing Figures 4 and 5, it is observed that Epidemic and MaxProp register similar values when terminal nodes have 100 MB buffer, independently of the mobile node’s buffer size. This demonstrates the importance of terminal
node’s storage capacity, to increase the overall
message delivery ratio on these protocols.
3.3. Results with 12 Mobile Nodes
In the second scenario, instead of having 6 mobile
nodes we have 12 (with a 200 MB buffer). This
increases the number of transmission opportunities, and improves the message delivery probability, as it can be observed on Figure 6. As observed on the previous scenario, and because of the same reasons, PRoPHET and Spray and Wait variants register similar values across the simulations, which mean that their performance does not depend on the terminal node’s buffer size.
Spray and Wait binary variant performs better than other protocols. However, with the increase of the buffer size, MaxProp performance approximates from Spray and Wait binary. The Epidemic protocol origins poor network resources utilization, caused by its flooding technique, prevents it from increasing the delivery probability when terminal node’s buffer size is greater than 300 MB. !" !#!$" !#%" !#%$" !#&" !#&$" !#'" !#'$" !#(" !#($" !#$" !#$$" !#)" %!!" &!!" '!!" (!!" $!!" !"#$% "& '()& *+,+$#$-'( ."&/$0,#(1*2"(345"&(6$7"(893:( *+,-./,0" 123456+" 47648*9" :+52;"2<-"=2,>" ?,<25;" :+52;"2<-"=2,>" @65/2A"
Figure 6. Message delivery probability using 12 mobile nodes with 200 MB buffer When mobile node’s buffer size is increased to 400 MB (shown in figure 7), the overall message delivery ratio of all routing protocols increases. As it can be observed, comparing results of figure 4 to figure 7, the performance difference between the two variants of Spray and Wait has increased. The binary variant is more efficient, and when twelve mobile nodes with 400 MB buffer are deployed, it achieves better delivery probabilities than the other routing protocols.
Figure 7 also shows that Epidemic and MaxProp take advantage of larger buffers. In this case, the network load produced by Epidemic has less effect on the delivery ratio because of the larger storage capacity available on the mobile nodes.
!" !#!$" !#%" !#%$" !#&" !#&$" !#'" !#'$" !#(" !#($" !#$" !#$$" !#)" %!!" &!!" '!!" (!!" $!!" !"#$% "& '()& *+,+$#$-'( ."&/$0,#(1*2"(345"&(6$7"(893:( *+,-./,0" 123456+" 47648*9" :+52;"2<-"=2,>" ?,<25;" :+52;"2<-"=2,>" @65/2A"
Figure 7. Message delivery probability using 12 mobile nodes with 400 MB buffer
3.4. Results with 18 Mobile Nodes
In the third scenario we increase the number of
mobile nodes to 18 (also with a 200 MB buffer). This
also increases the number of opportunistic contacts, reducing the inter-contact times, and improving the overall connectivity. Hence, this has a positive impact on the overall message delivery probability of all routing protocols, as shown in figure 8.
An analysis of these results reinforces that Epidemic flooding scheme is limited by the available storage at mobile nodes. Eighteen mobile nodes create more transmission opportunities. Therefore more messages will be exchanged, and buffer congestion will occur often. MaxProp protocol explicit message clearing after delivery, allows it to make a better use of the network node’s storage resources.
When terminal node’s buffers are equal or greater than 300 MB, MaxProp registers better delivery probabilities than the other protocols. Because of the fixed/limited number of copies created per message, Spray and Wait protocol does not benefit from the increase in the terminal node’s buffer capacity.
!" !#!$" !#%" !#%$" !#&" !#&$" !#'" !#'$" !#(" !#($" !#$" !#$$" !#)" %!!" &!!" '!!" (!!" $!!" !"#$% "& '()& *+,+$#$-'( ."&/$0,#(1*2"(345"&(6$7"(893:( *+,-./,0" 123456+" 47648*9" :+52;"2<-"=2,>" ?,<25;" :+52;"2<-"=2,>" @65/2A"
Figure 8. Message delivery probability using 18 mobile nodes with 200 MB buffer
!" !#!$" !#%" !#%$" !#&" !#&$" !#'" !#'$" !#(" !#($" !#$" !#$$" !#)" %!!" &!!" '!!" (!!" $!!" !"#$% "& '()& *+,+$#$-'( ."&/$0,#(1*2"(345"&(6$7"(893:( *+,-./,0" 123456+" 47648*9" :+52;"2<-"=2,>" ?,<25;" :+52;"2<-"=2,>" @65/2A"
Figure 9. Message delivery probability using 18 mobile nodes with 400 MB buffer
Figure 9 also reinforces the importance of the storage capacity on mobile nodes. Since vehicles are opportunistically exploited to offer a message relaying service, increasing their buffer size augments the probability of messages to be successfully delivered. Even Spray and Wait routing protocol, takes advantage from the possibility of mobile nodes to store and transport more messages between terminal nodes, increasing its performance in comparison with results presented in figure 8.
4. Conclusions and Future Work
In this paper we considered a VDTN network to provide connectivity on an isolated and dispersed region without network infrastructure. We evaluated how storage constraints of VDTN network nodes affect the overall network performance in terms of message delivery probability.
Several experiments were performed in three different scenarios with different number of mobile
nodes. In addition, on each scenario, we changed the
buffer size of mobile nodes and terminal nodes. It was assumed a fully cooperative opportunistic environment without knowledge of the traffic matrix and contact opportunities.
The DTN routing protocols considered in this study, require different buffer sizes to be distributed on different network nodes, in order to improve their message delivery rate. This is due to their different message replication strategies.
The study and protocol design of specific VDTN routing algorithms and buffer management techniques, are our interests for future work.
Acknowledgments
Part of this work has been supported by the Instituto
de Telecomunicações, Next Generation Networks and
Applications Group, Portugal, in the framework of the Project VDTN@Lab, and by the Euro-NF Network of Excellence of Seven Framework Programme of EU.
References
[1] V. Cerf, S. Burleigh, A. Hooke, L. Torgerson, R. Durst, K. Scott, K. Fall, and H. Weiss, "Delay-Tolerant Networking Architecture," RFC 4838, April 2007,
[Online]. Available:
ftp://ftp.rfc-editor.org/in-notes/rfc4838.txt.
[2] S. Burleigh, A. Hooke, L. Torgerson, K. Fall, V. Cerf, B. Durst, K. Scott, and H. Weiss, "Delay-Tolerant Networking: An Approach to Interplanetary Internet," in IEEE Communications Magazine, vol. 41, 2003, pp. 128-136.
[3] J. Partan, J. Kurose, and B. N. Levine, "A Survey of Practical Issues in Underwater Networks," in 1st ACM International Workshop on Underwater Networks, in conjunction with ACM MobiCom 2006, Los Angeles, California, USA, Sep. 25, 2006, pp. 17 - 24.
[4] P. Juang, H. Oki, Y. Wang, M. Martonosi, L. S. Peh, and D. Rubenstein, "Energy-Efficient Computing for Wildlife Tracking: Design Tradeoffs and Early Experiences with ZebraNet," ACM SIGOPS Operating Systems Review, vol. 36, pp. 96 - 107, 2002.
[5] A. Pentland, R. Fletcher, and A. Hasson, "DakNet: Rethinking Connectivity in Developing Nations," in IEEE Computer, vol. 37, 2004, pp. 78-83.
[6] J. Burgess, B. Gallagher, D. Jensen, and B. Levine, "MaxProp: Routing for Vehicle-Based Disruption-Tolerant Networks," in INFOCOM 2006 - The 25th
IEEE International Conference on Computer
Communications, Barcelona, Catalunya, Spain, April 23-29, 2006, pp. 1-11.
[7] F. Farahmand, A. N. Patel, J. P. Jue, V. G. Soares, and J. J. Rodrigues, "Vehicular Wireless Burst Switching Network: Enhancing Rural Connectivity," in The 3rd IEEE Workshop on Automotive Networking and Applications (Autonet 2008), Co-located with IEEE GLOBECOM 2008, New Orleans, LA, USA, December 4, 2008.
[8] Helsinki University of Technology - Networking Laboratory, "The Opportunistic Network Environment
simulator," [Online]. Available:
http://www.netlab.tkk.fi/tutkimus/dtn/theone/ [Accessed: March, 2009].
[9] A. Vahdat and D. Becker, "Epidemic Routing for Partially-Connected Ad Hoc Networks," Duke University, Technical Report CS-2000-06, April, 2000. [10] A. Lindgren and A. Doria, "Probabilistic Routing
Protocol for Intermittently Connected Networks," draft-irtf-dtnrg-prophet-01, November 17, 2008, [Online].
Available:
http://www.ietf.org/internet-drafts/draft-irtf-dtnrg-prophet-01.txt.
[11] T. Spyropoulos, K. Psounis, and C. S. Raghavendra, "Spray and Wait: An Efficient Routing Scheme for Intermittently Connected Mobile Networks," in ACM SIGCOMM 2005 - Workshop on Delay Tolerant Networking and Related Networks (WDTN-05), Philadelphia, PA, USA, August 22-26, 2005, pp. 252 - 259.
[12] Google, "Google Maps Portugal," [Online]. Available: http://maps.google.pt/ [Accessed: March, 2009]. [13] Open JUMP, "Open JUMP – The free, Java based and
open source Geographic Information System for the
World.," [Online]. Available:
http://openjump.org/wiki/show/HomePage [Accessed: March, 2009].
[14] Cisco Systems, Inc., "Capacity Coverage & Deployment Considerations for IEEE 802.11g," [Online]. Available: http://www.cisco.com/en/US/products/hw/wireless/ps45 70/products_white_paper09186a00801d61a3.shtml [Accessed: March, 2009].