Faculdade de Ciências
Departamento de Química e Bioquímica
Re and
99mTc Tricarbonyl Probes for
Target-Specific Detection of Melanoma and Sentinel
Lymph Node
Maurício da Silva Morais
Doutoramento em Química
Especialidade de Química Inorgânica
Faculdade de Ciências
Departamento de Química e Bioquímica
Re and
99mTc Tricarbonyl Probes for
Target-Specific Detection of Melanoma and Sentinel
Lymph Node
Maurício da Silva Morais
Tese orientada por:
Doutor João Domingos Galamba Correia
Doutora Isabel Rego dos Santos
Doutoramento em Química
Especialidade de Química Inorgânica
The work described in this thesis was performed in the Radiopharmaceutical Sciences Group, Instituto Superior Técnico – Campus Tecnológico e Nuclear, Sacavém, Portugal, under the supervision of Doctor João D. G. Correia and Doctor Isabel Rego dos Santos.
NMR studies of the peptides and their derivatives were performed under the supervision of Prof. Dr. Maria Angeles Jiménez (Departamento de Química Física Biológica, Instituto de Química Física Rocasolano. CSIC. Madrid, Spain.)
Biological evaluation of the radioactive polymeric nanocompounds was performed in the groups of Prof. Dr. Grace Samuel (Radiopharmaceuticals Division, Bhabha Atomic Research Centre, Mumbai, India) and Prof. Dr. Yasushi Arano (Graduate School of Pharmaceutical Sciences, Chiba University, Chiba, Japan) as part of Co-ordinated Research Project on the “Development of 99m
Tc Radiopharmaceutical for Cancer Diagnosis and Sentinel Node Detection”, IAEA. Biological evaluation of a bimodal probe was performed under STSM of COST Action 1104 in the group of Prof. Dr. Tony Lahoutte and Prof. Dr. Vicky Caveliers (In Vivo Cellular and Molecular Imaging Laboratory, Free University of Brussels, Belgium). The work was financially supported by Fundação para a Ciência e a Tecnologia through the PhD grant SFRH/BD/48066/2008. STSM was financially supported by COST Action 1104.
I am deeply indebted to my supervisor Prof. Dr. João Galamba Correia for his fundamental role in my doctoral work. I appreciate all his contributions of time, ideas, great guidance and patience to make my Ph.D. experience productive and stimulating.
I would like to express my deepest gratitude to Prof. Dr. Isabel Rego dos Santos for the opportunity to integrate and grow scientifically at the Radiopharmaceutcial Sciences group in Instituto Superior Técnico – Campus Tecnológico e Nuclear. I also would like to express my admiration for the thoroughness, enthusiasm and dedication with which she leads the research group.
My sincere appreciation is extended to Dr. Paula Raposinho for her valuable support, advice and effort to perform the in vitro and in vivo experiments.
I warmly thank Prof. Dr. Maria Angeles Jiménez for the opportunity to work with her in the conformational analysis of the peptides in solution. My heartfelt gratitude for the guidance, assistance, expertise and proof-reading during the preparation of publications.
I am very thankful to Dr. Célia Fernandes, Dr. Lurdes Gano and Dr Paula Campello for all their help, advice, good humor and encouragement.
I would like to thank Dr. Manuel Martins, Dr. Sérgio Pereira, Suresh Subramanian, Dr. Grace Samuel and Dr. Yasushi Arano for their time, suggestions and fruitful collaboration in the characterization and biological evaluation of polymeric compounds.
I would like to thank Prof. Dr. Tony Lahoutte and Prof. Dr.Vicky Caveliers for the opportunity to work in their group and all their team members for the valuable feedback. I also gratefully acknowledge Dr. Catarina Xavier who made me feel at home. Dr. Joaquim Marçalo is acknowledged for the mass spectrometry analysis and his help in the discussion of the results.
My heartfelt gratitude to all my lab collegues for the great working environment, help and all the good times we spent together.
Aos meus amigos agradeço o estímulo, a paciência e a compreensão pela minha falta de disponibilidade.
À FáFá agradeço o apoio ao longo destes anos.
O melanoma é um tipo de cancro da pele que apesar de corresponder apenas a cerca de 4 a 5% dos casos, é responsável por mais de 75% das mortes associadas a este tipo de patologia. É um dos tumores malignos mais agressivos devido à elevada probabilidade de metastização, em particular para o sistema linfático, e consequente disseminação para diferentes órgãos e tecidos. O tratamento do melanoma em fases iniciais apresenta elevadas taxas de cura mas as terapias existentes para as fases mais avançadas são pouco eficazes.
Neste contexto, o aparecimento de novos radiofármacos específicos poderá contribuir para a detecção precoce e estadiamento desta patologia, bem como do processo de metastização permitindo definir o tipo de terapia a adoptar pelo clínico. Assim, o trabalho apresentado nesta tese tem como objectivo principal a concepção de novas sondas de 99mTc(I) potencialmente úteis para a visualização in vivo de receptores da melanocortina do sub-tipo 1 (MC1R) sobreexpressos no melanoma e metástases, bem como dos receptores de manose (MR) expressos em macrófagos do sistema linfático e geralmente associados ao processo de metastização de tumores primários. O melanoma apresenta uma elevada probabilidade (cerca de 80%) de disseminação linfática sendo o primeiro gânglio linfático envolvido neste processo designado por gânglio sentinela. A sua detecção através do alvejamento dos MR e posterior excisão é importante não só para o seu estadiamento, como também para a definição da terapêutica.
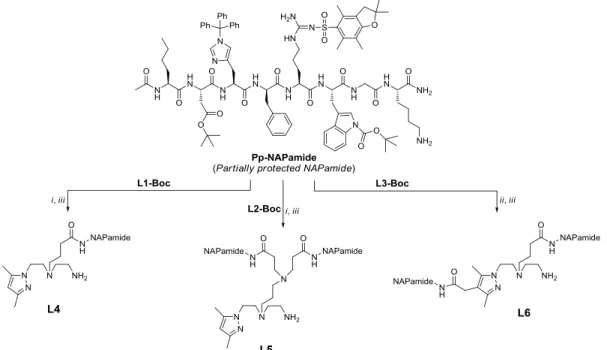
Para alcançar os objectivos definidos, conceberam-se sondas radioactivas específicas contendo a unidade fac-[99mTc(CO)3]+ estabilizada por ligandos bifuncionais
tridentados com a unidade quelante do tipo pirazolo-diamina (L1-L3, L10-L12), sendo a sua fórmula geral apresentada na Figura 1.
Figura 1: Ligandos bifuncionais com a unidade quelante pirazolo-diamina para coordenação ao metal e conjugação a biomoléculas (BM).
Esta unidade é adequada para a estabilização do fragmento organometálico fac-[M(CO)3]+ (M = 99mTc, Re), enquanto a presença de grupos carboxilato pendentes
permite a conjugação de biomoléculas capazes de reconhecer receptores específicos, nomeadamente o MC1R ou o MR.
Na tentativa de se obterem sondas radioactivas específicas para o MC1R com elevada acumulação no tumor e um perfil farmacocinético adequado, conceberam-se três estratégias que envolveram a preparação de análogos lineares e cíclicos da hormona de estimulação do crescimento dos melanócitos (α‐MSH), péptido endógeno cuja principal função está relacionada com a estimulação da melanogénese através de interacção com o MC1R. Como análogo linear da α‐MSH considerou-se o NAPamide (Ac-Nle-Asp-His-DPhe-Arg-Trp-Gly-Lys-NH2) enquanto que SNBA-MSHhex
(c[S-NO2-C6H3-CO-His-DPhe-Arg-Trp-Cys]-Lys-NH2), NNBA-MSHhex (c[NH-NO2-C6H3
-CO-His-DPhe-Arg-Trp-Lys]-Lys-NH2) e o AlaNlecycMSHhex ( Ala-Nle-c[Asp-His-DPhe-Arg-Trp-Lys]-NH2) foram os análogos cíclicos sintetizados. Na primeira estratégia, descrita no capítulo 2 da tese, prepararam-se conjugados homobivalentes (L5 e L6) e os correspondentes complexos organometálicos do tipo fac-[M(CO)3(κ3-L)]+ (M
= Re/99mTc; Re5/Tc5, L = L5; Re6/Tc6, L = L6) contendo duas unidades do péptido NAPamide separadas entre si por uma cadeia de nove (L5, Tc5 e Re5) ou catorze atomos (L6, Tc6 e Re6). A afinidade dos conjugados homobivalentes para o MC1R (L5: IC50 = 0.04 0.02 nM e L6: IC50 = 0.16 0.21 nM) é maior do que a observada
unidade fac-[Re(CO)3]+ não afectou substancialmente a capacidade de reconhecimento
do alvo (Re5: IC50 = 0.15 0.08 nM e Re6: IC50 = 1.14 1.13 nM). Os radiopéptidos
Tc5 e Tc6, preparados por reacção dos conjugados L5 e L6 com o precursor fac-[99mTc(CO)3(H2O)3]+, foram caracterizados por comparação, em cromatografia líquida
de alta eficiência (HPLC), com os congéneres de rénio Re5 e Re6. Os radiopéptidos apresentaram uma rápida internalização mediada pelo MC1R em células de melanoma murino B16F1. Estudos de biodistribuição em ratinhos com melanoma induzido por células B16F1 revelaram baixa acumulação dos radiopéptidos no tumor (≤ 3.02 ± 0.27 % AI/g) com elevada fixação nos rins (≥ 33.2 ± 3.3 % AI/g), demonstrando que a aproximação bivalente para alvejar o MC1R in vivo não é superior à monovalente.
Na segunda estratégia, apresentada no capítulo 3 da tese, prepararam-se análogos da α‐MSH ciclizados via ligação tioeter (SNBA-MSHhex) ou amina
(NNBA-MSHhex) que por conjugação ao ligando bifuncional L1 originaram os conjugados
peptídicos L7 e L8, respectivamente. A conjugação do complexo fac-[Re(CO)3(κ3
-L1)]+ (Re1), obtido por reacção de L1 com fac-[Re(CO)3(H2O)3]+, a SNBA-MSHhex e
NNBA-MSHhex originou os compostos Re7 e Re8, respectivamente. A baixa afinidade
demonstrada por estes compostos para o MC1R (SNBA-MSHhex: IC50 = 1800 500
nM; NNBA-MSHhex:IC50 = 51 12 nM; L7: IC50 = 430 0.1 nM; L8: IC50 = 179 39
nM; Re7: IC50 = 690 2.5 nM; Re8: IC50 = 176 5 nM) reflecte-se também na fraca
acumulação no tumor (≤ 2.63 0.5 % AI/g) observada para os radiopéptidos correspondentes Tc7 e Tc8 em ratinhos com melanoma induzido por células B16F1. Na tentativa de compreender quais as propriedades estruturais dos derivados peptídicos sintetizados que afectam a capacidade de reconhecimento do receptor, efectuou-se um estudo por espectroscopia de ressonância magnética nuclear (e.g. 1H-1H g-COSY, TCOSY, NOESY). Os resultados obtidos sugerem que a baixa afinidade dos compostos parece estar relacionada com o efeito anisotrópico, uma corrente electrónica que desprotege os protões da cadeia lateral da arginina, aminoácido essencial na interação com o receptor, que, provavelmente limita a interacção com o MC1R. Este efeito foi mais evidente para SNBA-MSHhex, L7 e Re7. O estudo revelou ainda que a
conformação estrutural do péptido SNBA-MSHhex em solução permanece intacta após
conjugação ao quelato bifuncional e coordenação do conjugado resultante à unidade
farmacocinético e aumentar a acumulação no melanoma do radiopéptido cíclico baseado no análogo AlaNlecycMSHhex. Numa primeira abordagem o péptido
AlaNlecycMSHhex foi conjugado ao quelato bifuncional L1 que contém grupos metilo
no anel heteroaromático, originando L9. Por reacção de L9 com fac-[99mTc(CO)3(H2O)3]+ obteve-se o radiopéptido do tipo fac-[99mTc(CO)3(κ3-L9)]+ (Tc9)
cuja fixação tumoral e o perfil farmacocinético foram avaliado em ratinhos com melanoma induzido por células B16F1. Tc9 apresentava elevada acumulação no tumor (11.31 1.83 % AI/g) mas também nos orgãos de excreção (rins e fígado), conduzindo a uma relação tumor/orgãos não alvo desfavorável. Na tentativa de melhorar o seu perfil farmacocinético, o péptido AlaNlecycMSHhex foi conjugado ao ligando bifuncional
com a unidade quelante pirazolo-diamina contendo grupos metilo nas posições 3/5 e um grupo carboxilato na posição 4 do anel heteroaromático (L3). O péptido foi ainda conjugado a ligandos do mesmo tipo sem grupos substituintes no anel (L10) ou com um grupo carboxilato na posição 4 do anel (L11). Os conjugados peptídicos resultantes, L13 – L15, apresentaram uma elevada afinidade para o MC1R (L13: IC50 = 0.02 ± 0.01
nM; L14: IC50 = 0.04 ± 0.01 nM; L15: IC50 = 0.16 ± 0.10 nM), comparável à observada
para o péptido não conjugado AlaNlecycMSHhex. Por reacção de L13 – L15 com
fac-[99mTc(CO)3(H2O)3]+ obtiveram-se os radiopéptidos do tipo fac-[99mTc(CO)3(κ3-L)]+
(Tc13, L = L13; Tc14, L = L14; Tc15, L = L15). De salientar que a determinação do coeficiente de partilha num sistema octanol/tampão fosfato (pH 7,4) revelou que os compostos com grupo carboxilato na posição 4 do anel heteroaromático (Tc14 e Tc15) apresentam uma natureza hidrofílica mais acentuada do que Tc9 e Tc13.
Todos os radiopéptidos (Tc13-Tc15) apresentaram uma captação celular significativa em células de melanoma murino B16F1 (≥ 10.8 ± 0.3 % da actividade total), sendo a sua internalização específica e mediada pelo MC1R.
Estudos de biodistribuição em ratinhos com melanoma induzido por células B16F1 evidenciaram uma elevada acumulação no tumor para Tc13 – Tc15 (≥ 9.90 1.10 AI/g, 1h p.i.). Destes radiopéptidos, os que possuem o grupo carboxilato no anel heteroaromático, Tc14 e Tc15, apresentaram um perfil farmacocinético mais favorável pois foram rapidamente excretados, não se acumulando nos orgãos de excreção (rins e fígado). Este comportamento permitiu gerar imagens de grande contraste por tomografia
2).
Tc14 Tc15
Figura 2: Imagens planares cintigráficas de ratinhos com melanoma induzido por células B16F1 injetados com Tc14 e Tc15.
Em conclusão, das três estratégias apresentadas, esta última foi a que apresentou resultados mais promissores, sendo os compostos Tc14 e Tc15 potencialmente úteis para imagiologia do melanoma em humanos.
No capítulo 5 desta tese descreve-se a síntese e a caracterização de conjugados poliméricos de dextrano potencialmente úteis para a detecção de MR expressos em macrófagos no gânglio sentinela. Os conjugados L18 e L19 contêm, respectivamente, 4 e 8 unidades quelantes do tipo pirazolo-diamina/mol dextrano para estabilização do fragmento organometálico fac-[M(CO)3]+ (M = Re, 99mTc), bem como 13 unidades
manose/mol dextrano para detecção específica in vivo dos MR por SPECT. Preparou-se ainda o conjugado polimérico L20 por conjugação de 3 ± 1 unidades de um fluoróforo a L19. O conjugado resultante foi utilizado para preparar uma sonda bimodal para detecção dos MR in vivo por SPECT e imagiologia óptica na região do infravermelho próximo.
Da reacção dos conjugados macromoleculares com os respectivos precursores organometálicos obtiveram-se compostos do tipo fac-[M(CO)3(κ3-L)]+ (M = Re/99mTc;
isoestrutural destes compostos foi confirmada por comparação do perfil cromatográfico (HPLC) dos polímeros radioactivos com os respectivos congéneres de rénio. A caracterização física de L18 – L20 e Re18 – Re20 através da técnica de dispersão de luz dinâmica (DLS) revelou que o diâmetro hidrodinâmico dos compostos aumenta de acordo com a funcionalização do polímero, apresentando os conjugados L18 – L20 dimensões que variam entre 7,0 e 17,7 nm e os seus análogos metálicos Re18 – Re20 entre 8,4 e 22,5 nm.
As sondas radioactivas Tc18 e Tc19 apresentaram uma captação significativa no primeiro gânglio linfático (≥ 3.87 ± 0.63 % AI/orgão) com uma acumulação mínima nos tecidos não alvo (≤ 1.81 ± 0.46 % AI/orgão) em ratos Wistar. Estes compostos apresentaram igualmente uma retenção específica e prolongada no primeiro gânglio linfático, mediada pelo MR.
A sonda bimodal Tc20 apresentou valores elevados para a extracção do primeiro gânglio linfático e semelhantes a Tc19 em ratos Wistar, permitindo a visualização do gânglio sentinela por SPECT e imagiologia óptica (Figura 3).
A B
Figura 3: Imagens obtidas após injecção de Tc20 em rato Wistar; A) Fusão de imagem de SPECT com tomografia computorizada; B) imagem de fluorescência na região do infravermelho próximo. IS, local de injeção; 1st LN, gânglio linfático poplíteo; 2nd LN, gânglio linfático inguinal.
Em conclusão, o desenvolvimento de nanopartículas radioactivas contendo unidades manose apresentam resultados promissores para a detecção do gânglio sentinela por SPECT e/ ou imagiologia óptica, sendo os compostos Tc19 e Tc20 promissores para futura avaliação biológica em humanos.
The work described in this thesis aimed at the development of M(I) (M = 99mTc, Re) specific probes for the detection of malignant melanoma and sentinel lymph node (SLN) through the in vivo targeting of membrane receptors. In the former case we have designed M(CO)3-complexes stabilized by tridentate chelators containing a
pyrazolyl-diamine chelating unit (N,N,N donor atom set) and pendant α-melanocyte-stimulating hormone (α-MSH) derivatives for targeting the melanocortin receptor 1 (MC1R), which is overexpressed in melanotic and amelanotic human melanoma cells. Among the various strategies described herein to improve both the MC1R targeting properties and the biological profile of 99mTc-labeled α-MSH analogs, the chapter 2 of this thesis focus on the design of homobivalent constructs containing two copies of a linear α-MSH analog (NAPamide) separated by linkers of different nature (L5, symmetric alkyl chain; L6, asymmetric semirigid spacer) and length (L5, 9 atoms; L6, 14 atoms). The MC1R-binding affinity of both peptide conjugates is significantly higher than that of the monovalent conjugate L4. Metallation of L4 - L6 yielded complexes of the type fac-[M(CO)3(κ3-L)]+ (M = 99mTc/Re; Tc4/Re4, L = L4; Tc5/Re5, L = L5; Tc6/Re6, L =
L6), with the rhenium compounds presenting IC50 values in the sub- and nanomolar
range, which are still better than or comparable to the IC50 values of the non-conjugated
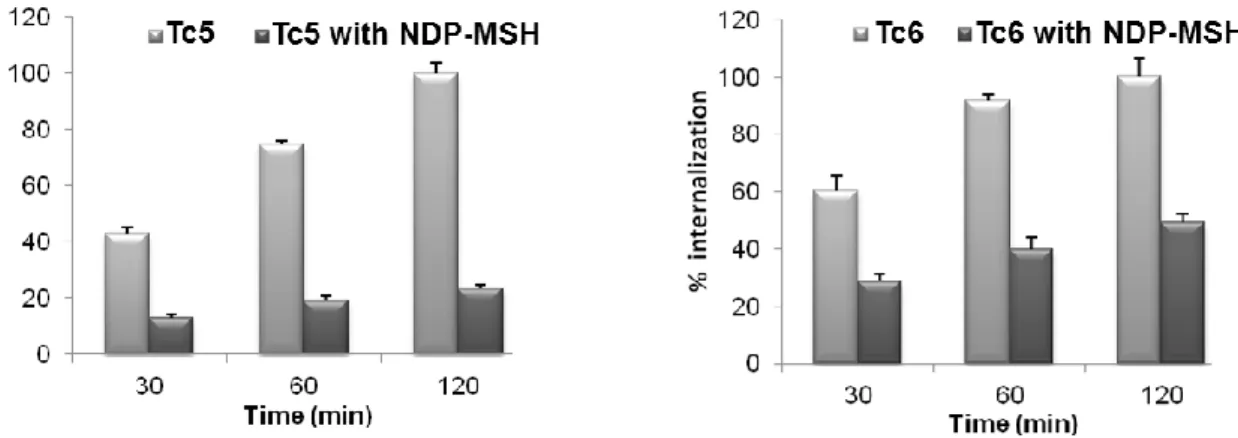
NAPamide. The MC1R-mediated internalization of Tc5 and Tc6 in B16F1 melanoma cells is higher than that of Tc4. However, biodistribution studies in melanoma-bearing mice have shown low tumor uptake and significant accumulation of radioactivity in kidneys. Moreover, no correlation between tumor uptake and valency was found.
Chapter 3 describes novel peptide conjugates (L7 and L8), which contain a thioether (SNBA-MSHhex) or amine (NNBA-MSHhex) bridge-cyclized α-MSH analog,
respectively, and a pyrazolyl-diamine chelating unit. Metallation of L7 and L8 gave complexes of the type fac-[M(CO)3(κ3-L)]+ (M = 99mTc/Re; Tc7/Re7, L = L7; Tc8/Re8,
L = L8). Competitive binding affinity assays demonstrated that the compounds containing the alkylamine bridge-cyclized peptide moiety present lower IC50 values than
the one cyclized via the alkylthioaryl bridge. NMR structural analysis suggested that such difference could be ascribed to an anisotropic effect arising from the interaction between the Arg side chain and the surrounding aromatic residues in the pharmacophore sequence (His-DPhe-Arg-Trp) of SNBA-MSHhex, hampering a favorable interaction of the peptide with the MC1R. NMR studies have also shown that the three-dimensional
chelator and, most importantly, after metallation.
The chapter 4 of this thesis reports the impact of pyrazolyl-diamine chelators with different azolyl-ring substitution patterns (carboxylate at the 4-position and methyl
groups at the 3,5 positions, L3; no substituent groups, L10; carboxylate at the 4-position, L11) on the MC1R-targeting properties and pharmacokinetic profile of a
99m
Tc(CO)3-labeled lactam bridge-cyclized α-MSH analog (βAlaNleCycMSHhex).
Conjugation of those bifunctional chelators to βAlaNleCycMSHhex yielded the peptide
conjugates L13 – L15, which upon reaction with fac-[99mTc(CO)3(H2O)3]+ gave the
(radio)metallated compounds Tc13 – Tc15. Biodistribution studies in murine melanoma-bearing mice have shown that all radiopeptides (Tc13 – Tc15) presented a good melanoma uptake (≥ 9.90 1.10 % IA/g). The introduction of a carboxylate group in the azolyl-ring lead to a remarkable reduction of kidney (> 89 %) and liver (> 91 %) uptake for Tc14 andTc15, respectively, when compared to the lead radiopeptideTc9, which has methyl groups at the 3,5 positions of the azolyl-ring. The remarkable tumor uptake and favorable tumor/non-target organs ratios of Tc14 andTc15 highlights the potential of both compounds as melanoma imaging agents.
Chapter 5 reports the design, characterization and biological evaluation of mannosylated dextran derivatives with pyrazolyl-diamine chelating units for sentinel lymph node detection (SLND) through mannose receptor (MR) targeting. The mannosylated dextran derivatives L18 and L19 contain, respectively, 4 and 8 chelating units per mol of dextran to stabilize the fac-[M(CO)3]+ moiety (M = Re, 99mTc), as well
as 13 mannose units per mol of dextran for MR targeting. A bimodal probe for SLND by SPECT and optical imaging in the near infrared (NIR) field is also reported in chapter 5. L20 was prepared by conjugation of 3 to 4 fluorophore units to L19. Metallation of L18 – L20 gave polymeric complexes of the type fac-[M(CO)3(κ3-L)]+
(M = 99mTc/Re; Tc18/Re18, L = L18; Tc19/Re19, L = L19; Tc20/Re20, L = L20). Physical characterization of the mannosylated dextran derivatives has shown that the hydrodynamic diameter and the zeta potencial of the nanoparticles were affected by chemical modification. Indeed, the hydrodynamic diameter of L18 – L20 are within the range of 7.0 to 17.7 nm while the diameter of the respective metallated compounds (Re18 – Re20) is slightly higher, within the range 8.4 to 22.5 nm.
Biological evaluation of the polymeric radiotracers in Wistar rats has shown a good accumulation in the popliteal (sentinel) node at 1 h p.i. (6.71 ± 2.35 % IA/organ,
mediated by MR. The high popliteal extraction value of Tc19 (94.47 ± 2.45 % at 1 h p.i.) highlights its potential as a very promising radiotracer to be further explored as SLN imaging agent in humans. The biological evalution of Tc20 has shown that the incorporation of a fluorophore into the nanoparticle did not not alter the pharmacokinetic properties of the bimodal probe as compared to the radiotracer Tc19. In fact, Tc20 and Tc19 presented high popliteal extraction value (89.66 ± 0.03 % and 87.81 ± 3.75 %, respectively) at 3 h p.i. Furthermore, the biological evaluation of Tc20 demonstrated a perfect coregistration of the two signals, allowing nuclear and optical imaging techniques to complement each other in the detection and excision of the popliteal lymph node.
Re/99mTc-tricarbonilo
Receptor da Melanocortina do Sub-tipo 1 (MC1R) Detecção Gânglio Sentinela
Tomografia por Emissão de Fotão Único (SPECT) Imagiologia Óptica
Keywords
Re/99mTc-tricarbonyl
Melanocortin-1 Receptor (MC1R)
Sentinel Lymph Node Detection (SLND)
Single Photon Emission Computed Tomography (SPECT) Optical Imaging
Acknowledgements ... iii
Resumo ... v
Abstract ... xi
Palavras-Chave ... xv
Keywords ... xv
Table of Contents ... xvii
Figures ... xxiii
Tables ... xxix
Schemes... xxxi
Abbreviations ... xxxiii
Scope and Aim ... 1
1. Introduction ... 5
1.1. Imaging in Oncology ... 5
1.2. Nuclear Medicine and Radiopharmaceuticals ... 7
1.2.1. Diagnosis versus Therapy ... 8
1.3. Coordination Chemistry of Technetium and Rhenium ... 11
1.3.1. The Radiochemistry of Technetium ... 12
1.3.2. 99mTc Radiopharmaceuticals ... 14
1.3.3. The fac-[M(CO)3]+ Core (M = Tc, Re) ... 18
1.4. Detection of Melanoma and Sentinel Lymph Node ... 22
1.4.1. Melanoma ... 22
1.4.2. Sentinel Lymph Node ... 34
2. 99mTc(CO)3-labeled Homobivalent α-MSH Analogs for MC1R-Targeting ... 43
2.1. Introduction ... 43
2.2. Homobivalent NAPamide Conjugates ... 45
2.2.1. Synthesis and Characterization of the Pyrazolyl-diamine Chelators ... 45
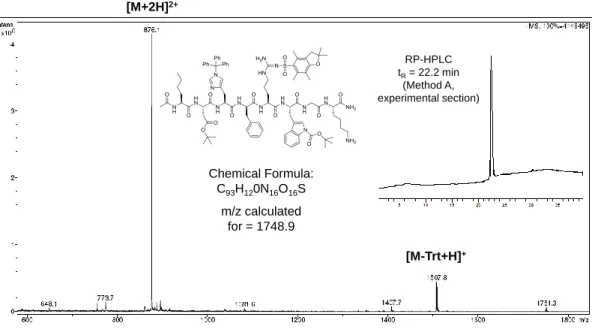
2.2.2. Synthesis and Characterization of NAPamide ... 47
2.2.3. Synthesis and Characterization of NAPamide Conjugates ... 53
2.2.4. Metallated Homobivalent Peptides of the Type fac-[Re(CO)3(κ3-L)]+ ... 56
2.3. MC1R-Binding Affinity ... 60
2.4. Radiolabeling with fac-[99mTc(CO)3]+ Moiety ... 61
2.7. Biodistribution and in vivo Stability of Tc4 – Tc6 ... 66 2.8. Conclusions ... 68 3. M(CO)3-labeled Cyclic α-MSH Analogs (M = 99mTc, Re) ... 71
3.1. Introduction ... 71 3.2. Synthesis and Characterization of novel Cyclic α-MSH analogs ... 72 3.3. Peptide Conjugates and Metallopeptides... 78 3.4. MC1R-Binding Affinity ... 82 3.5. Radiolabeling with the fac-[99mTc(CO)3]+ Moiety ... 83
3.6. In vitro Stability Studies ... 85
3.7. Cell Uptake Studies ... 85 3.8. Biodistribution and In Vivo Stability ... 87 3.9. Conclusions ... 88 4. Modulation of the Pharmacokinetic Properties of 99mTc(CO)3-labeled
βAlaNleCycMSHhex ... 93 4.1. Introduction ... 93 4.2. M(CO)3-Complexes (M = Re, 99mTc) Anchored by
Pyrazolyl-Diamine-Based Chelators ... 94 4.2.1. Synthesis and Characterization of the Bifunctional Chelators ... 94 4.2.2. Synthesis and Characterization of the Re(CO)3-Complexes ... 96
4.2.3. Synthesis and Characterization of the 99mTc(CO)3-Complexes ... 99
4.2.4. Biodistribution and In Vivo Stability Studies ... 100 4.3. Lactam Bridge-Cyclized α-MSH Peptide Conjugates ... 101 4.3.1. Synthesis and Characterization of βAlaNleCycMSHhex... 101
4.3.2. Synthesis and Characterization of the βAlaNleCycMSHhex Conjugates . 102
4.3.3. MC1R-Binding Affinity ... 104 4.4. Radiolabeling with fac-[99mTc(CO)3]+ Moiety ... 105
4.5. Cell Uptake Studies ... 107 4.6. Biodistribution and In Vivo Stability ... 110 4.7. Conclusions ... 114 5. Mannosylated Dextran Derivatives for SLND by SPECT/CT and SPECT/NIR
Imaging ... 117 5.1. Introduction ... 117
Pyzazolyl-Diamine Chelator ... 117 5.3. M(CO)3-Mannosylated Dextran (M = Re, 99mTc) ... 118
5.3.1. Synthesis and Characterization of Re(CO)3-Mannosylated Dextran ... 118
5.3.2. Synthesis and Characterization of 99mTc(CO)3-Mannosylated Dextran .. 124
5.4. Biodistribution Studies ... 126 5.5. Bimodal Probe for SPECT/CT and NIR Optical Imaging... 131
5.5.1. Synthesis and Characterization of Mannosylated Dextran Bearing a
Pyrazolyl-Diamine Chelator and a NIR Fluorophore ... 131 5.5.2. In Vivo Fluorescence Properties ... 136
5.6. M(CO)3-Mannosylated Dextran (M = Re, 99mTc) Bearing NIR
Fluorophore ... 137 5.6.1. Synthesis and Characterization of Re(CO)3-Mannosylated Dextran Bearing
NIR Fluorophore ... 137 5.6.2. Synthesis and characterization of 99mTc(CO)3-Mannosylated Dextran
Bearing NIR Fluorophore ... 138 5.7. Biodistribution Studies ... 140 5.8. Conclusions ... 144 6. Concluding Remarks and Outlook ... 147 7. Experimental Part ... 157 7.1. Materials ... 157 7.2. Characterization and Purification Techniques ... 157 7.3. Synthesis and Characterization of the Compounds ... 168
7.3.1. 4-((2-(tert-butoxycarbonylamino)ethyl)(2-(3,5-dimethyl-1H-pyrazol-1-yl)ethyl)amino)butanoic acid (L1-Boc) ... 168 7.3.2. 4-((2-aminoethyl)(2-(3,5-dimethyl-1H-pyrazol-1-yl)ethyl)amino)butanoic
acid (L1) ... 168 7.3.3. tert-butyl 2-((3-aminopropyl)(2-(3,5-dimethyl-1H-pyrazol-1-yl)ethyl)
amino) ethylcarbamate (I) ... 169 7.3.4. Methyl
8-(2-(3,5-dimethyl-1H-pyrazol-1-yl)ethyl)-12-(3-methoxy-3-oxopropyl)-2,2-dimethyl-4-oxo-3-oxa-5,8,12-triazapentadecan-15-oate (L2-Boc-Me2) ... 169
7.3.5.
propylazanediyl) dipropanoate (L2-Me2) ... 170
7.3.7. ethyl 4-((2-(4-(2-(benzyloxy)-2-oxoethyl)-3,5-dimethyl-1H-pyrazol-1-yl)ethyl)(2-(tert-butoxycarbonylamino)ethyl)amino)butanoate (II) ... 171 7.3.8.
4-((2-(tert-butoxycarbonylamino)ethyl)(2-(4-(carboxymethyl)-3,5-dimethyl-1H-pyrazol-1-yl)ethyl)amino)butanoic acid (L3-Boc) ... 171 7.3.9.
4-((2-aminoethyl)(2-(4-(carboxymethyl)-3,5-dimethyl-1H-pyrazol-1-yl)ethyl) amino)butanoic acid (L3) ... 172 7.3.10. Pp-NAPamide (Partially Protected NAPamide) ... 173 7.3.11. NAPamide ... 174 7.3.12. L4 ... 176 7.3.13. L5 ... 178 7.3.14. L6 ... 179 7.3.15. fac-[Re(CO)3(κ3-L1)]+ (Re1) ... 180 7.3.16. fac-[Re(CO)3(κ3-L2)]+ (Re2) ... 180 7.3.17. fac-[Re(CO)3(κ3-L3)]+ (Re3) ... 181 7.3.18. Re4 ... 182 7.3.19. Re5 ... 185 7.3.20. Re6 ... 185 7.3.21. General method for the preparation of Tc4 – Tc6 ... 186 7.3.22. SNBA-MSHhex ... 186 7.3.23. NNBA-MSHhex ... 190 7.3.24. L7 ... 192 7.3.25. L8 ... 195 7.3.26. Re7 ... 195 7.3.27. Re8 ... 198 7.3.28. General method for the preparation of Tc7 and Tc8... 198 7.3.29. tert-butyl 2-(2-(1H-pyrazol-1-yl)ethylamino)ethylcarbamate (III) ... 199 7.3.30. Ethyl 1(2(2(tertbutoxycarbonylamino)ethylamino)ethyl)1Hpyrazole -4-carboxylate (IV) ... 199 7.3.31. tert-butyl 2-(1-(2-(2-(tert-butoxycarbonylamino)ethylamino)ethyl)-3,5-dimethyl-1H-pyrazol-4-yl)acetate (V) ... 199 7.3.32. ethyl 4-((2-(1H-pyrazol-1-yl)ethyl)(2-(tert-butoxycarbonylamino)ethyl) amino)butanoate (VI) ... 200
amino)ethyl)-1H-pyrazole-4-carboxylate (VII) ... 200 7.3.34. ethyl 4-((2-(4-(2-tert-butoxy-2-oxoethyl)-3,5-dimethyl-1H-pyrazol-1-yl)
ethyl)(2-(tert-butoxycarbonylamino)ethyl)amino)butanoate (VIII) ... 201 7.3.35. 4-((2-(1H-pyrazol-1-yl)ethyl)(2-(tert-butoxycarbonylamino)ethyl)amino)
butanoic acid (L10-Boc) ... 202 7.3.36. 1-(2-((2-(tert-butoxycarbonylamino)ethyl)(3-carboxypropyl)amino)
ethyl)-1H-pyrazole-4-carboxylic acid (L11-Boc) ... 202 7.3.37. 4-((2-(4-(2-tert-butoxy-2-oxoethyl)-3,5-dimethyl-1H-pyrazol-1-yl)ethyl)
(2-(tert-butoxycarbonylamino)ethyl)amino)butanoic acid (L12-Boc) .... 203 7.3.38. 4-((2-(1H-pyrazol-1-yl)ethyl)(2-aminoethyl)amino)butanoic acid (L10)204 7.3.39.
1-(2-((2-aminoethyl)(3-carboxypropyl)amino)ethyl)-1H-pyrazole-4-carboxylic acid (L11) ... 204 7.3.40. fac-[Re(CO)3(κ3-L10)]+ (Re10) ... 205
7.3.41. fac-[Re(CO)3(κ3-L11)]+ (Re11) ... 206
7.3.42. General method for the preparation of Tc3 – Tc11 ... 206 7.3.43. βAlaNleCycMSHhex ... 207
7.3.44. L13 ... 208 7.3.45. L14 ... 208 7.3.46. L15 ... 210 7.3.47. General method for the preparation of Tc13 – Tc15 ... 211 7.3.48. L16 and L17 ... 211 7.3.49. L18-Boc and L19-Boc ... 212 7.3.50. L18 and L19 ... 213 7.3.51. General method for the preparation of Re18 and Re19 ... 214 7.3.52. 2-((E)-2-((E)-2-(4-carboxyphenylthio)-3-((Z)-2-(1,3,3-trimethylindolin-2-ylidene)ethylidene)cyclohex-1-enyl)vinyl)-1,3,3-trimethyl-3H-indolium (IX) ... 215 7.3.53. 2-((E)-2-((E)-2-(4-((2,5-dioxopyrrolidin-1-yloxy)carbonyl)phenylthio)-3-((Z)-2-(1,3,3-trimethylindolin-2-ylidene)ethylidene)cyclohex-1-enyl) vinyl)-1,3,3-trimethyl-3H-indolium (X) ... 216 7.3.54. L20-Boc ... 217 7.3.55. L20 ... 218 7.3.56. Re20 ... 219
7.3.58. Quantification of the NIR emission for L20 and Tc20 ... 221 7.4. Partition coefficient ... 221 7.5. In vitro stability studies ... 221
7.6. Cell Culture ... 222 7.6.1. Competitive binding assay ... 222 7.6.2. Internalization and cellular retention studies... 223 7.7. Biodistribution studies ... 224 7.7.1. In vivo Stability ... 226
7.8. Imaging Studies ... 226 7.9. Histology ... 228 References... 231
Figura 1: Ligandos bifuncionais com a unidade quelante pirazolo-diamina para coordenação ao metal e conjugação a biomoléculas (BM). ... vi Figura 2: Imagens planares cintigráficas de ratinhos com melanoma induzido por células B16F1 injetados com Tc14 e Tc15. ... ix Figura 3: Imagens obtidas após injecção de Tc20 em rato Wistar; A) Fusão de imagem de SPECT com tomografia computorizada; B) imagem de fluorescência na região do infravermelho próximo. IS, local de injeção; 1st LN, gânglio linfático poplíteo; 2nd LN, gânglio linfático inguinal. ... x Figure 1.1: Current role of cancer imaging in cancer management.3 ... 5 Figure 1.2: Examples of images obtained with SPECT, PET, MRI, CT and US techniques, adapted from Weissleder et al.2 ... 6 Figure 1.3: Schematic representation of a perfusion (A) and targeted (B) specific metal-based radiopharmaceutical.10 ... 8 Figure 1.4: Example of 99mTc-colloids SPECT/CT images for sentinel lymph node detection.14 ... 9 Figure 1.5: A - 99Mo/99mTc generator. B - Conceptual view of the generator. ... 13 Figure 1.6: 99mTc-based radiopharmaceuticals for diagnosis in clinical use.8b (MDP = methylenediphosphonate, MAG3 = mercaptoacetyl-triglycine). ... 15
Figure 1.7: Examples of 99mTc-based target-specific radiopharmaceuticals. ... 16 Figure 1.8: Technetium cores useful for labeling biomolecules... 17 Figure 1.9: Qualitative size comparison of the organometallic precursor fac-[Tc(CO)3(H2O)3]+ (left) and Tc-MAG3 (right) based on X-ray analyses. Purple =
technetium, red = oxygen, grey = carbon, blue = nitrogen, yellow = sulphur. Hydrogen atoms are omitted.39 ... 19 Figure 1.10: Examples of M(CO)3-complexes stabilized by various types of chelating
agents (BM = biomolecule; M = Re/99mTc). 1 - Functionalized cysteine;42 2 - Funcionalized 2,3-diamino propionic acid derivatives;43 3 Functionalized histidine derivatives;44 4 - Cyclopentadienyl;45 5, 6 and 7 - Functionalized picolinic acid derivatives;46 8 Triazacyclononane;47 9 and 10 Functionalized pyrazolyl-diamine containing ligands;48 11 - Functionalized bis(mercaptoimidazolyl)borates.49 ... 21 Figure 1.11: Molecular targets (melanoma specific versus nonspecific) and probes for PET/SPECT imaging of malignant melanoma. Melanocortin 1 receptor (MC1R); high
(BZA); amino acid transporter (AAT); glucose transporter (GLUT); F-fluorodeoxyglucose (18F-FDG); 3'-18F-fluoro-3'-deoxy-L-thymidine (18F-FLT); arginine-glycine-aspartic acid (RGD).52c ... 23 Figure 1.12: Schematic representation of the human melanocortin-1 receptor.76a The positions for transmembrane (TM) helix, extracellular (EL) loops and intracellular (IL) loops are drawn according to the two-dimensional model of Ringholm et al.76b The amino acid sequence corresponds to the wild type consensus (GenBank accession number AF326275). Positions for MC1R binding are shown in red... 27 Figure 1.13: Structure of Ac-ReCCMSH, 99mTc-CCMSH(Arg11) and 111 In-DOTA-CCMSH(Arg11) ... 31 Figure 1.14: Lactam bridge-cyclized α-MSH derivatives: structures of Pz-βAlaNleCycMSHhex, DOTA-NleCycMSHhex, DOTA-GlyGlyNleCycMSHhex and
NOTA-GlyGlyNleCycMSHhex. ... 33
Figure 1.15: Mannose receptor structure bound to 4-sulfated-N-acetylgalactosamine (4-SO4-GalNAc). Ribon diagram of MR structure with lobes I, II and III indicated with
diferent colors. Dissulphide bounds are yellow and 4-SO4-GalNAc is shown in
ball-and-stick representation. Trp117 is highlight in orange.109 ... 37 Figure 1.16: Schematic representation of 99mTc-labeled nanotracers proposed for SLND: A) mannosylated 99mTc-labeled dextran derivatives and B) mannosylated 99m Tc-labeled gold nanoparticle (AuNP). ... 39 Figure 2.1: Receptor binding mechanisms unique to multivalent ligands.127... 43 Figure 2.2: Pyrazolyl-diamine based bifunctional chelators L1-Boc – L3-Boc. ... 45 Figure 2.3: 1H-NMR spectrum of L2-Boc in D2O (S = residual water). ... 47
Figure 2.4: The solid phase peptide synthesis (SPPS) principle. ... 48 Figure 2.5: Schematic representation of Pp-NAPamide. ... 49 Figure 2.6: ESI-MS spectrum and RP-HPLC chromatogram of Pp-NAPamide. ... 50 Figure 2.7: Histograms showing the chemical shift deviation of 1Hα (top) and 13Cα
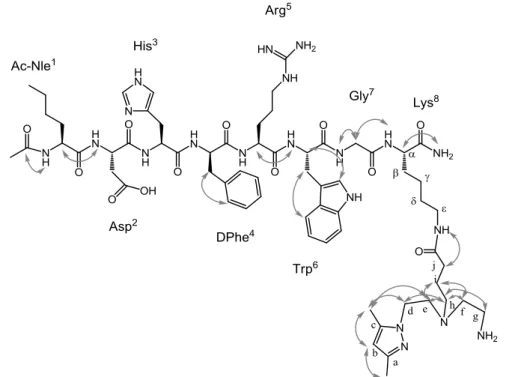
(bottom) values for amino acid residues of NAPamide in aqueous solution at pH 2.5 and 5 ºC... 52 Figure 2.8: Summary of the NOE intensities derived from ROESY data observed for NAPamide at pH 2.5 and 5 ºC. The height of the bar indicates the strength of the NOE. The NOE volumes were categorized as strong (1.8-3.0 Å), medium (1.8-3.5 Å), or weak (1.8-5.0 Å). “f” stands for DPhe. ... 53
correlations at pH 2.5 and 5 ºC. ... 55 Figure 2.10: 1H-(top) and 13C-NMR (bottom) spectra of Re2 in D2O (S = residual
water). ... 57 Figure 2.11: Histograms showing the chemical shift deviation of 1Hα (top) and 13Cα
(bottom) values for amino acid residues of NAPamide (black bars), L4 (white bars) and Re4 (grey bars) in aqueous solution at pH 2.5 and 5 ºC... 59 Figure 2.12: RP-HPLC chromatograms of Tc5 and Tc6 (γ - detection)/Re5 and Re6 (U.V. detection). ... 62 Figure 2.13: RP-HPLC chromatograms of Tc6 after incubation in fresh human serum at different time points... 64 Figure 2.14: Internalization (A) and retention (B) of Tc4 (squares), Tc5 (circles) and Tc6 (triangles) in B16F1 cells at 37 °C. Internalized activity expressed as a percentage of total (applied) activity. ... 64 Figure 2.15: Receptor-blocking study: inhibition of cellular internalization of Tc5 (left) and Tc6 (right) in B16F1 cells by co-incubation with NDP-MSH (3.5g/well). ... 65 Figure 2.16: RP-HPLC γ traces of Tc6 (initial preparation), blood serum and urine samples collected 1 h after p.i. ... 68 Figure 3.1: Schematic representation of the cyclic analog MT-II, SHU9119 and c[S-NO2-C6H3-CO-His-DPhe-Arg-Trp-Cys]-NH2 (PG10N) and their MC1R binding
affinity values.143-144 ... 71 Figure 3.2: Schematic representation of amine-bridged cyclic peptide NNBA-MSHhex.
... 74 Figure 3.3: Histograms showing the chemical deviations (Hα, Cα and Cβ, ppm;
being = observed - RC) for amino acid residues of SNBA-MSHhex (black bars) and
NNBA-MSHhex (white bars), in aqueous solution at pH 2.5 and 5 ºC. Dashed lines
indicate the random coil (RC) ranges. Random coil values were taken from Wishart et al.137a ... 75 Figure 3.4: NOE correlations found for SNBA-MSHhex and NNBA-MSHhex backbone
(top) at 25 ºC and key NOE cross-peaks present in the ROESY spectra of both peptides (bottom). The height of the bar indicates the strength of the sequential NOE. The NOE volumes were categorized as strong (1.8-3.0 Å), medium (1.8-3.5 Å), or weak (1.8-5.0 Å). ... 77
for SNBA-MSHhex (black contours), L7 (red contours) and Re7 (blue contours) in
aqueous solution (H2O/D2O 9:1 v/v) at pH 2.5 and 5 ºC. The cross-peaks between the
Hεε’ protons and the amino group of Lys side chain in SNBA-MSHhex and the
corresponding HζN amide to which the chelator is bound in L7 and Re7 are also shown.
... 80 Figure 3.6: Histogram showing the Hα (Hα = Hαobserved - HαRC, ppm) values for
amino acid residues of SNBA-MSHhex (black bars), L7 (white bars), and the two Re7
isomers (Re7a and Re7b; grey bars) in aqueous solution at pH 2.5 and 5 ºC. Dashed lines indicate the random coil (RC) range. Random coil values were taken from Wishart et al.137a ... 81 Figure 3.7: Histograms showing the Cα (Cα = Cαobserved - CαRC, ppm), and Cβ
(Cβ = Cβobserved - CβRC, ppm) for amino acid residues of SNBA-MSHhex (black bars),
L7 (white bars), and Re7 (grey bars) in aqueous solution at pH 2.5 and 5 ºC. Dashed lines indicate the RC ranges. 13C-chemical shift values for Cα and Cβ carbons are
identical for the two Re7 species (Tables 7.10 and 7.12 in experimental section). RC values were taken from Wishart et al.137a ... 81 Figure 3.8: Synthesis of the radiopeptides Tc7 and Tc8. i) 75 ºC, 30 min, pH = 7. ... 83 Figure 3.9: RP-HPLC chromatographic profiles for Tc7 (γ - detection) and respective “cold” surrogate Re7 (U.V. detection, 220 nm). ... 84 Figure 3.10: RP-HPLC profiles of Tc7 and Tc8 in fresh human serum at different time points at 37 ºC. ... 85 Figure 3.11: Internalization of Tc7 and Tc8 in B16F1 cells at different time points at 37 ºC. Internalized and surface-bound activities expressed as a percentage of applied activity. ... 85 Figure 3.12: Cellular retention of internalized Tc7 and Tc8 radiopeptides in B16F1 cells at different time points at 37 ºC... 86 Figure 3.13: RP-HPLC γ traces of Tc8 (initial preparation), blood serum and urine samples collected 1 h after p.i. ... 88 Figure 4.1: Schematic representation of Tc9. ... 93 Figure 4.2: Boc-protected Bifunctional chelators L1-Boc and L10-Boc – L12-Boc.... 94 Figure 4.3: 1H-NMR spectrum of compound L11-Boc in D2O (S = residual water). ... 95
Figure 4.6: ESI-MS spectra and RP-HPLC chromatogram of βAlaNleCycMSHhex. . 102
Figure 4.7: Selected ROESY spectral region (left) of L14 in aqueous solution (H2O/
D2O 9/1 v/v) at pH 2.5 and 25 °C and key correlations (right) observed between L11
and the NH of βAla (arrow). ... 104 Figure 4.8: Superimposition of the RP-HPLC chromatograms of L15 (U.V. detection) and Tc15 (gamma detector), using Method J (experimental section 7.2). ... 106 Figure 4.9: RP-HPLC chromatograms of Tc14 after incubation in human serum at different time points (37 ºC). ... 107 Figure 4.10: (A) Internalization of the radioconjugates Tc13 – Tc15 in B16F1 murine melanoma cells at different time points at 37 ºC. (B) Effect of MC1R-saturation with NDP-MSH (3.5 µg/well) on the internalized and the surface bound radioconjugates. Internalized and surface bound activity expressed as a percentage of total activity. ... 108 Figure 4.11: Cellular retention of internalized radioconjugates Tc13 – Tc15 in B16F1 melanoma cells over time at 37 ºC. ... 110 Figure 4.12: Planar scintigraphic images of B16F1 murine melanoma-bearing C57BL/6 mice injected with Tc14 and Tc15 at 1 h p.i. ... 113 Figure 4.13: RP-HPLC γ traces of homogenate samples from tumor (left column), kidney (center column) and liver (right column) collected from melanoma-bearing C57BL/6 injected with Tc14 at 1 h and 4 h p.i. ... 114 Figure 5.1: Progression of the reaction of fac-[Re(CO)3(H2O)3]Br with L18: RP-HPLC
chromatograms (λ = 220 nm) and 1H-NMR data of the mixture at 1 h and 16 h after reagents addition. ... 120 Figure 5.2: IR spectra of [Re(CO)3(H2O)3]Br, Re18 and L18. ... 121
Figure 5.3: Hydrodynamic diameter of Re18 (8.4 ± 0.5 nm) and Re19 (8.7 ± 0.3 nm), determined by DLS (detection angle of 173º). ... 122 Figure 5.4: Height-scaled AFM images and corresponding line profiles of dextran (A), Re18 (B) and Re19 (C). ... 123 Figure 5.5: Scan of sephadex G-25 gel filtration column, after elution of Tc19 with saline solution. ... 125 Figure 5.6: Radiochromatograms of Tc18: I – RP-HPLC (tR = 12.2 min); II – ITLC
(Tc18, Rf = 0). ... 125
Figure 5.7: RP-HPLC chromatograms of Tc18 (γ detection) and Re18 (U.V. detection). ... 126
site; 1 LN, popliteal lymph node. ... 129 Figure 5.9: SEC- (left) and RP-HPLC (right) chromatograms of L20, using Methods L and M, respectively. ... 132 Figure 5.10: 1H-NMR spectrum of L20 in D2O (identification system for NMR
assignments is displayed). ... 133 Figure 5.11: Absorption spectra of 1 nM solutions of L20 in water (dashed line) showing the aggregate form at 723 nm and the monomeric form at 797 nm. Only the monomeric form is found at 802 nm in 20% DMSO aqueous solution (solid line). .... 134 Figure 5.12: Hydrodynamic diameter of L20 in 0.01 M PBS, pH 7.4. ... 136 Figure 5.13: Bright field image (left) and NIR image (right) of Wistar rat injected with L20 (exposure time 350 ms), at 1h p.i.; IS, injection site; 1st LN, popliteal (sentinel) lymph node. ... 136 Figure 5.14: SEC-(left) and RP-HPLC (right) chromatogram of Re20 at 220 nm, using method L and M (see experimental section 7.2), respectively. ... 138 Figure 5.15: RP-HPLC (Method M) chromatographic profiles of Tc20 (γ - detection) and respective cold surrogate Re20 (U.V. detection, 220 nm)... 139 Figure 5.16: Fluorescence intensity of L20 (left) and Tc20 (right); background (center) in a Odyssey IR imaging system with 700- and 800-nm channels. ... 140 Figure 5.17: SPECT/CT image of a Wistar rat injected subcutaneously with Tc20 at 1 h p.i.; IS, injection site; 1st LN, popliteal (sentinel) lymph node; 2nd LN, inguinal (secondary) lymph node. ... 141 Figure 5.18: Bright field (left) and NIR optical imaging (right) image of Wistar rat leg injected with 1 nmol of Tc20 (exposure time 750 ms), at 3 h p.i. The white arrow indicates the localization of the dual tracer in the popliteal lymph node. IS, injection site. ... 142 Figure 5.19: A) Ex-vivo NIR imaging of Tc20 in the popliteal (1st LN) and inguinal lymph node (2nd LN)... 143 Figure 5.20: Histological verification of lymph node excision in the NIR field; cell nuclei were stained (blue color) with 4',6-diamidino-2-phenylindole (DAPI). ... 143
Table 1.1: Relevant characteristics of the imaging modalities used in the clinical set.5a 6 Table 1.2: Melanocortin receptors and their tissue localizations. ... 26 Table 1.3: Sequence of amino acids for -MSH and some -MSH analogs. ... 29 Table 2.1: Analytical data of the monovalent and bivalent α-MSH derivatives. ... 54 Table 2.2: Analytical data for Re4 – Re6. ... 58 Table 2.3: MC1R binding affinity of -MSH derivatives. ... 60 Table 2.4: Log Po/w values for complexes Tc4 – Tc6. ... 63
Table 2.5: Biodistribution studies of Tc4 – Tc6 in B16F1 murine melanoma-bearing C57BL/6 mice at 1 h and 4 h p.i. (n = 3-5)... 66 Table 3.1: Analytical data for SNBA-MSHhex and NNBA-MSHhex. ... 74
Table 3.2: 1H chemical shifts (ppm) for the Arg side chain of SNBA-MSHhex and
NNBA-MSHhex in aqueous solution at pH 2.5, 25 ºC. Random coil values were taken
from Wishart et al.139a ... 76 Table 3.3: Analytical data for L7, L8, Re7 and Re8. ... 79 Table 3.4: MC1R binding affinities of cyclic -MSH analogs. ... 82 Table 3.5: Retention time (RP-HPLC) and log Po/w values for Tc7 and Tc8. ... 84
Table 3.6: Biodistribution of Tc7 and Tc8 in B16F1 melanoma-bearing C57BL/6 mice at 1h and 4h p.i. The results are presented as % IA/g (mean S.D., n=3-4). ... 87 Table 4.1: Biodistribution (% IA/g) and total excretion (% IA) of the complexes Tc3, Tc10 and Tc11 in CD/1 mice, 1 h and 4 h p.i. ... 100 Table 4.2: Analytical data for the α-MSH peptide conjugates. ... 103 Table 4.3: Binding affinity for the α-MSH analog and peptide conjugates. ... 105 Table 4.4: Analytical data for the radiopeptides. ... 106 Table 4.5: Biodistribution studies of Tc9 and Tc13 – Tc15 in B16F1 murine melanoma-bearing C57BL/6 mice at 1 and 4h p.i. (n = 3-5)... 111 Table 5.1: Group density, hydrodynamic diameter, zeta potential and calculated molecular weight of dextran, L18, L19, Re18 and Re19. ... 122 Table 5.2: Biodistribution data for Tc18 and Tc19 in Wistar rat model at different time points (n = 3-5). ... 128 Table 5.3: Biodistribution data for Tc17 and Tc19 in a Wistar rat model (3 h p.i.).... 130 Table 5.4: Biodistribution data for Tc20 in Wistar Rat model at 3h p.i. (n = 3). ... 141
9:1 v/v at pH 2.5 and 5 ºC... 175 Table 7.2: 1H, 13C and 15N chemical shifts (ppm, from DSS) of NAPamide in H2O/D2O
9:1 v/v at pH 2.5 and 25 ºC. “nd” stands for not determined. ... 176 Table 7.3: 1H, 13C and 15N chemical shifts (ppm, from DSS) of L4 in H2O/D2O 9:1 v/v
at pH 2.5 and 5 ºC. “nd” stands for not determined. ... 177 Table 7.4: 1H, 13C and 15N chemical shifts (ppm, from DSS) of L4 in H2O/D2O 9:1 v/v
at pH 2.5 and 25 ºC). “nd” stands for not determined. ... 178 Table 7.5: 1H, 13C and 15N chemical shifts (ppm, from DSS) for Re4 in H2O/D2O 9:1
v/v at pH 2.5 and 5 ºC. “nd” stands for not determined. ... 183 Table 7.6: 1H, 13C and 15N chemical shifts (ppm, from DSS) for Re4 in H2O/D2O 9:1
v/v at pH 2.5 and 25 ºC. “nd” stands for not determined. ... 184 Table 7.7: 1H, 13C and 15N chemical shifts (ppm, from DSS) for SNBA-MSHhex in
H2O/D2O 9:1 v/v at pH 2.5 and 5 ºC. ... 188
Table 7.8: 1H, 13C and 15N chemical shifts (ppm, from DSS) for SNBA-MSHhex in
H2O/D2O 9:1 v/v at pH 2.5 and 25 ºC. “nd” stands for not determined. ... 189
Table 7.9: 1H, 13C and 15N chemical shifts (ppm, from DSS) for NNBA-MSHhex in
H2O/D2O 9:1 v/v at pH 2.5 and 25 ºC. ... 191
Table 7.10: 1H, 13C and 15N chemical shifts (ppm, from DSS) for L7 in H2O/D2O 9:1
v/v at pH 2.5 and 5 ºC. “nd” stands for not determined. ... 193 Table 7.11: 1H, 13C and 15N chemical shifts (ppm, from DSS) for L7 in H2O/D2O 9:1
v/v at pH 2.5 and 25 ºC. “nd” stands for not determined. ... 194 Table 7.12: 1H, 13C and 15N chemical shifts (ppm, from DSS) for Re7 in H2O/D2O 9:1
v/v at pH 2.5 and 5 ºC. Chemical shifts for one of the two observed species are in italics. “nd” stands for not determined. ... 196 Table 7.13: 1H, 13C and 15N chemical shifts (ppm, from DSS) for Re7 in H2O/D2O 9:1
v/v at pH 2.5 and 25 ºC. Chemical shifts for one of the two observed species are in italics. “nd” stands for not determined. ... 197 Table 7.14: 1H, 13C and chemical shifts (ppm, from DSS) of L11 in H2O/D2O 9:1 v/v at
pH 2.5 and 25 ºC. “nd” stands for not determined. ... 205 Table 7.15: 1H, 13C and 15N chemical shifts (ppm, from DSS) of L14 in H2O/D2O 9:1
Scheme 1.1: Schematic representation of the radionuclides decay in a 99Mo/99mTc generator.26 ... 13 Scheme 1.2: Synthesis of fac-[99mTc(CO)3(H2O)3]+ with IsoLink® Kit. ... 19
Scheme 2.1: Synthesis of L2-Boc and L3-Boc. (i) CH2CHCO2CH3, dry MeOH; (ii)
NaOH, tetrahydrofuran (THF)/H2O. ... 46
Scheme 2.2: Synthesis of mono- and bivalent NAPamide conjugates L4, L5 and L6. (i) HATU, DIPEA, DMF; (ii) HATU, DIPEA, Microwave 75W, 50 oC, 10 min, DMF; (iii) 95% TFA, 2.5% TIS, 2.5% H2O... 54
Scheme 2.3: Synthesis of the metallated peptides Re4 – Re6. i) Pp-NAPamide, DMF/DIPEA/HATU; ii) TFA/TIS/H2O. ... 56
Scheme 2.4: Synthesis of Tc4 – Tc6. i) 90 ºC, 30 min, pH = 7. ... 62 Scheme 3.1: Synthesis of a thioether cyclic peptide (SNBA-MSHhex) containing. i)
pNO2-BenzAcid, DIPEA, DCM, 3h, r.t.; ii) 2% TFA/DCM; iii) 5eq. K2CO3, DMF; iv)
TFA, TIS, H2O (95; 2.5 %; 2.5 %). ... 73
Scheme 3.2: Synthesis of L7, L8, Re7 and Re8. i) DMF/DIPEA/HATU; ii) TFA/TIS/H2O. ... 79
Scheme 4.1: Synthesis of the bifunctional chelators L10-Boc, L11-Boc and L12-Boc.
i) Br(CH2)3CO2Et, K2CO3, KI, CH3CN; ii) NaOH, THF/H2O, r.t., overnight;
(identification system for NMR assignments is displayed). ... 95 Scheme 4.2: Synthesis of complexes Re3/Tc3, Re10/Tc10 and Re11/Tc11. i) H2O,
reflux, overnight (M = Re) or H2O, 100 °C, 30 min (M =99mTc). ... 96
Scheme 4.3: Synthesis of the peptide conjugates L981b and L13 – L15. i) HATU, DIPEA, DMF; ii) 95 % TFA, 2.5 % TIS, 2.5 % H2O. ... 103
Scheme 4.4: Synthesis of the radiopeptides Tc981b and Tc13 – Tc15. i) 90 ºC, 20 min, pH = 7. ... 105 Scheme 5.1: Synthesis of mannosylated dextran derivatives bearing pyrazolyl-diamine and mannose units.154 i) BrC3H5, NaOH (2.5 M), H2O; ii) NH2(CH2)2SH, (NH4)2S2O8,
DMSO; iii) L1-Boc, 1-ethyl-3-(3-dimethylaminopropyl) carbodiimide (EDC), N-hydroxysuccinimide (NHS), borate buffer 0.1 M, pH 9; iv) 2-imino-2-methoxethyl-1-thio-β-D-mannoside (IME-thiomannose) 0.1 M borate buffer, pH 9; v) TFA/H2O. .... 118
Scheme 5.2: Synthesis of fac-[M(CO)3(κ3-L)] (M = 99mTc/Re: Tc18/Re18, L = 18;
iii) DMSO/ borate buffer, 0.1 M, pH 9 (1:1), iv) TFA. ... 131
Scheme 5.4: Synthesis of Re20; i) DMSO/ borate buffer, 0.1 M, pH 9 (1:1), 8 h, r.t. 137 Scheme 5.5: Synthesis of Tc20. i) fac-[99mTc(CO)3(H2O)3]+, 90 ºC, 10 min, pH = 7 . 139
A
AAT = Amino acid transporter Ac = Acetyl
Ac2O = Acetic anhydride
ACTH = Adrenocorticotropic hormone AFM = Atomic Force Microscopy Arg or R = Arginine
Asp or D = Aspartic acid AuNP = Gold nanoparticle
ATC = Anatomical Therapeutic Chemical classification system ALND = Axillary-lymph-node dissection
B BFC = Bifunctional chelator Boc = Tert-butoxycarbonyl BP = Bisphosphonate Bq = Becquerel br = Broad BM = Biomolecule
BBB = Blood brain barrier C
ca. = circa
cAMP = Cyclic Adenosine Monophosphate
CBTE2A = 4,11-bis(carboxymethyl)-1,4,8,11-tetraazabicyclo[6.6.2]hexadecane CCD = Charge-Coupled-Device
CXCR4 = Chemokine (C-X-C motif) receptor 4 Ci = Curie (1 Ci = 3.7 x 10¹⁰ Bq)
Cys or C = Cysteine
COSY = Correlation Spectroscopy CT = Computed Tomography
CTN = Campus Tecnológico e Nuclear Cpm = Counts per minutes
d = Doublet dd = Doublet of doublets DPhe or f = D-Phenylalanine D3R = Dopamine D3 receptor DCM = Dichloromethane DIPEA = N,N-Diisopropylethylamine DLS = Dynamic Light Scattering DMF = N,N-Dimethylformamide
Dmab = 4-(N-[1-(4,4-dimethyl-2,6-dioxocyclohexylidene)-3-methylbutyl]amino)benzyl DMSA = Dimercaptosuccinic acid
DMSO = Dimethylsulfoxide DOPA = Dihydroxyphenylalanine
DOTA = 1,4,7,10-tetraazacyclo-dodecane-1,4,7,10-tetraacetic acid DTPA = Diethylenetriaminepentaacetic acid
DMEM = Dulbecco’s Modified Eagle’s Medium DSS = Sodium 2,2-dimethyl-2-silapentane-5-sulfonate E
e.g. = exempli gratia EL = extracellular loop
EMA = European Medicines Agency ESI = Electrospray ionization
EtOH = Ethanol
ECD = Ethylenecysteine diester F
FBZA = Fluorobenzamide f = D-Phenylalanine
FDA = Food and Drug Administration FDG = Fluorodeoxyglucose FLT = Fluorodeoxy-L-thymidine FMISO = Fluoromisonidazole fac = Facial G GalNAc = Acetylgalactosamine
GLUT = Glucose transporter Gly or G = Glycine
GPCR = G protein-coupled receptor H
h = Hour
HATU = 2-(7-Aza-1H-benzotriazole-1-yl)-1,1,3,3-tetramethyluronium hexafluorophosphate
His or H = Histidine
HBTU = O-Benzotriazole-N,N,N′,N′-tetramethyl uroniumhexafluoro phosphate HPLC = High-performance liquid chromatography
HMPAO = Hexamethyl-propylene-amine oxime
HMW-MAA or HMP = high molecular weight melanoma associated antigen HYNIC = 6-Hydrazinopyridine-3-carboxylic acid
HSA = Human Serum Albumin
HSQC = Heteronuclear Single Quantum Coherence Spectra I
IME-thiomannose = 2-imino-2-methoxethyl-1-thio-β-D-mannoside ivDde = 1-(4,4-Dimethyl-2,6-dioxocyclohex-1-ylidene)-3-methylbutyl IA = Injected Activity
IL = Intracellular loop ICG = Indocyanine green IR = Infrared
IST = Instituto Superior Técnico
ITLC = Instant Thin‐Layer Chromatography K
keV = kilo-electronvolt kg = kilogram
L
Lys or K = Lysine
LET = Linear energy transfer
Po/w = Partition coefficient Octanol/water
LDV = Laser Doppler Velocimetry M
MAG2 = 2-Mercaptoacetylglycylglycyl MAG3 = Mercaptoacetyl-triglycine MCR = Melanocortin receptor MC1-5R = Melanocortin 1-5 receptor MDP = Methylenediphosphonate Me = Methyl MeV = Mega-electronvolt MR = Mannose receptor min = Minute MS = Mass spectrometry
MSA = Mannosylated human serum albumin MRI = Magnetic Resonance Imaging
Mtt = 4-methyltrityl
99
Mo = Molibdenium-99 M.W. = Molecular Weight N
n.c.a. = non carrier added nd = not determined nm = nanometer NIR = Near-infrared
NOE = Nuclear Overhauser effect
NOESY = Nuclear Overhauser Effect Spectroscopy NOTA = Triazacyclononane-1,4,7-triacetic acid NMR = Nuclear Magnetic Resonance
NMP = N-methylpyrrolidone
NMDAR = N-methyl-D-aspartate receptor P
pNO2-BenzAcid = 2-fluoro-5-nitrobenzoic acid
Pbf = pentamethyl-2,3-dihydrobenzofuran-5-sulfonyl PBS = Phosphate buffered saline
PET = Positron Emission Tomography Phe or F = L-Phenylalanine
ppm = Part per million
Pz = Pyrazolyl-diamine chelating unit Q q = Quartet R RC = Random Coil RGD = Arginine-Glycine-Aspartic acid RP = Reversed phase
rpm = rotation per minute
ROE = Rotating Frame Overhause Effect
ROESY = Rotating-frame Nuclear Overhauser Effect Correlation Spectroscopy r.t. = room temperature
S
s (IR spectroscopy) = strong s (NMR spectroscopy) = singlet SC = sulfur colloid
SLN = Sentinel lymph node
SLNB = Sentinel lymph node biopsy SLND = Sentinel lymph node detection
SPECT = Single Photon Emission Computed Tomography SPPS = Solid Phase Peptide Synthesis
S.D. = Standard deviation T
t = Triplet t1/2 = Half-life
t-Bu = tert-butyl
TCOSY = Total Correlated Spectroscopy TFA = Trifluoroacetic acid
THF = Tetrahydrofuran TIS = Triisopropylsilane tR = Retention time
Trt = trityl
Trp or W = Tryptophan TLC = Thin‐Layer chromatography U US - Ultrasound U.V. - Ultraviolet V vs = Very strong W w = Weak Y y = Year Å = angstrom α-MSH = α-Melanocyte-Stimulating Hormone α = Alpha β = Beta β+ = Positron γ = Gamma κ = Denticity δ = Chemical shift ν = Frequency
Henri Becquerel discovered the natural radioactivity in potassium uranyl sulphate in 1896. Almost fourty years later, Irene Curie and Frederic Joliot were the first to report artificial radioactivity, identifying positron-emitting elements from the bombardement of aluminum, boron, and magnesium targets with alpha particles from polonium.
In the advent of these discoveries, George de Hevesy developed the fundamental principles for the use of radioactive tracers to study physiological and chemical processes.1 However, only after major scientific and technological advances in radioisotope production, imaging instrumentation and biology, those principles were extended to the visualization of biological functions associated with a wide range of pathologies, namely neurological disorders, cardiovascular diseases and cancer.
Positron Emission Tomography (PET) and Single Photon Emission Computed Tomography (SPECT) are nowdays the embodiment of this concept, allowing quantitative tracing of biochemical processes in vivo. This is only possible because radioactive probes can be synthesized at high specific activity, enabling the use of tracer concentrations to detect small‐capacity molecular systems in vivo (e.g. cell surface receptors, transporters, etc.) without interfering with the processes under study.2
Despite remarkable advances, the design of specific probes for targeted imaging or therapy remains still a great challenge and a demanding task within the field of radiopharmaceutical sciences. This is a multidisciplinary research area, which profits from the input of chemists, radiochemists, radiopharmacists and clinicians. One of the major challenges facing nuclear molecular imaging is the early detection and quantification of biochemical and metabolic changes at the molecular and cellular level that precede morphological changes, allowing early diagnosis of diseases. To achieve this goal, the design of new radioactive probes with high specificity and molecular affinity for recognition of particular targets associated to certain disease states is mandatory.
Within this framework, the goal of this thesis is to contribute for the design of
99m
Tc(CO)3-based probes for imaging of membrane receptors, namely the
overexpressed melanocortin receptor 1 (MC1R) in malignant melanoma, and the mannose receptor (MR) expressed by macrophages in the lymph nodes. Whereas in the former case, new tracers would allow early detection of a particularly aggressive type of
skin cancer and associated metastasis, in the latter case it would allow the detection of sentinel lymph node (SLN), which is a relevant procedure in medicine.
The thesis is organized in seven chapters. A general introduction to imaging in oncology and radiopharmaceuticals, as well as on melanoma-targeting probes and sentinel lymph node detection (SLND) is presented in the first chapter. Chapters 2 – 4 are dedicated to the design and biological evaluation of 99mTc(CO)3-labeled
α-melanocyte-stimulating hormone (α-MSH) analogs for MC1R targeting. In an attempt to improve melanona imaging, homobivalent contructs containing two copies of a linear α-MSH analog (NAPamide) are described in chapter 2. The third chapter reports on the synthesis of novel cyclic α-MSH analogs. Moreover, a study by nuclear magnetic resonance (NMR) spectroscopy is performed to establish a preliminary correlation between the receptor-targeting properties of the peptide derivatives and their structural features in solution. Chapter 4 describes the improvement of the overall biological profile of a 99mTc(CO)3-labeled lactam bridge-cyclized α-MSH analog
(βAlaNleCycMSHhex) as a function of the structural modifications in the ring
substitution pattern of the pyrazolyl-diamine chelating unit. Chapter 5 is dedicated to the design, macroscopic characterization and biological evaluation of 99mTc(CO)3
-labeled mannosylated dextran-based nanoparticles for MR-targeting in SLND. Furthermore, a bimodal probe was also synthesized for SLND by SPECT and optical imaging in the near infrared (NIR) field. Concluding remarks and future work are presented in chapter 6. Finally, in chapter7 it is described the experimental details of the work presented in chapters 2 – 5.
1
INTRODUCTION
1. Introduction
1.1. Imaging in Oncology
Imaging, one of the main pillars of comprehensive cancer, allows screening and provides significant information during all phases of disease management.3 Indeed, the use of imaging techniques enables cancer screening programs with improved outcome in cancer detection among population. Moreover, cancer patients undergo a number of different imaging studies throught the course of their disease. The role of imaging in cancer management is shown in Figure 1.1.
Figure 1.1: Current role of cancer imaging in cancer management.3
Clinical decision-making is based on the information of multiple non-invasive imaging modalities such as the nuclear techniques Single Photon Emission Computed Tomography (SPECT) and Positron Emission Tomography (PET), X-ray, Magnetic Resonance Imaging (MRI), Computed Tomography (CT) and Ultrasound (US).4
These imaging modalities can be included into two large categories: structural and functional imaging. Structural imaging techniques such as X-ray, CT and MRI provide anatomical details on tumor location, size, morphology, and structural changes to adjacent tissues.4a Functional imaging, rather than anatomical, aims at the visualization and characterization of biochemical pathways, molecular interactions, drug pharmacokinetic and pharmacodynamics. SPECT and PET are currently accepted as the most important functional imaging techniques. Examples of images obtained with all the imaging techniques referred above are shown in Figure 1.2.2, 4
Figure 1.2: Examples of images obtained with SPECT, PET, MRI, CT and US techniques, adapted from Weissleder et al.2
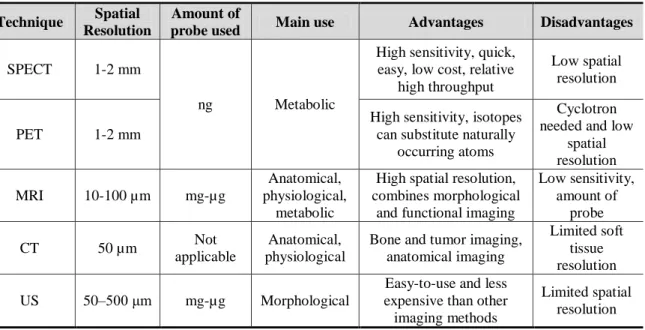
Despite unlimited depth penetration and exquisite sensitivity due to the ability to image tissues with micro- to picomolar concentrations of a radioactive tracer, nuclear imaging techniques present low spatial resolution and inability to provide anatomical detail.4a, 5 These issues were addressed by the introduction of dual modality imaging techniques, mainly nuclear-computed tomography fusion systems (PET/CT and SPECT/CT), that maximized their separate strengths and provide anatomical localization of biochemical processes with detailed visualization of the tumor structure. Table 1.1 summarizes the most relevant characteristics of the imaging modalities mentioned above, including the major strenghts and weaknesses.
Table 1.1: Relevant characteristics of the imaging modalities used in the clinical set.5a Technique Spatial
Resolution
Amount of
probe used Main use Advantages Disadvantages SPECT 1-2 mm
ng Metabolic
High sensitivity, quick, easy, low cost, relative
high throughput
Low spatial resolution
PET 1-2 mm
High sensitivity, isotopes can substitute naturally
occurring atoms
Cyclotron needed and low
spatial resolution MRI 10-100 µm mg-µg Anatomical, physiological, metabolic
High spatial resolution, combines morphological
and functional imaging
Low sensitivity, amount of probe CT 50 µm Not applicable Anatomical, physiological
Bone and tumor imaging, anatomical imaging
Limited soft tissue resolution US 50–500 μm mg-µg Morphological
Easy-to-use and less expensive than other imaging methods
Limited spatial resolution
The advances in imaging instrumentation changed the paradigm of oncological imaging from lesion measurement to lesion characterization and target quantification. Another contribution to this revolution is based on the decoding of the human genome and