F
ACULDADE DEE
NGENHARIA DAU
NIVERSIDADE DOP
ORTOComparing Link-based and Area-based
Pricing Mechanisms in Traffic
Assignment
Duarte Alexandre Pinto Brandão
W
ORKING VERSIONMestrado Integrado em Engenharia Informática e Computação
Supervisor: Rosaldo J. F. Rossetti, PhD
Co-supervisor: Zafeiris Kokkinogenis
Comparing Link-based and Area-based Pricing
Mechanisms in Traffic Assignment
Duarte Alexandre Pinto Brandão
Mestrado Integrado em Engenharia Informática e Computação
Abstract
In this work a distributed dynamic road pricing solution is presented to solve the route choice problem. In this problem agents try to discover which route minimizes their travel costs. This leads to agents picking the most attractive routes and therefore congestion is very likely to emerge when demand it high. This self-interested behavior leads to a degradation of the network perfor-mance and the establishment of a user-equilibrium (UE).
To solve this we present a distributed toll-based mechanism. Tolling agents learn the best price for the links they manage using Q-learning. The drivers themselves are Q-learning agents that try to minimize their travel costs (time and credits) and they will alter their routes according to the toll price signals.
Two scenarios were developed using different levels of decentralization of the tolling agents, one where road managers control only a single link and another where managers control a larger num-ber of links. Five different homogeneous populations were tested in these scenarios, from time-sensible drivers only to cost-time-sensible ones. These scenarios obtained best results in the populations that were equally sensible to both time and cost (50%-50%), with lower average travel times and reduced emissions. The less decentralized scenario was less effective in generating revenue.
Keywords: Road traffic assignment; road pricing; network optimum; reinforcement learning; Q-learning; greenhouse gases emissions; traffic simulation; dynamic road pricing.
Resumo
Neste trabalho foi desenvolvido um sistema distribuído de portagens dinâmicas para solucionar o problema de escolha de rotas. Neste problema, condutores tentam descobrir a rota que minimiza os seus custos de viagem. Isto leva a que os condutores escolham as rotas mais atractivas e ao aparecimento de congestionamento. Este comportamento egoísta leva a uma degradação da per-formance da rede e ao aparecimento de um user-equilibrium (UE).
Para resolver o problema de congestionamento é apresentado um mecanismo distribuído de porta-gens. Os agentes portageiros aprendem a colocar o preço mais eficaz nas estradas que eles gerem usando Q-learning. Por sua vez os condutores também aprendem a minimizar os seus custos de tempo e créditos.
Foram desenvolvidos 2 cenários de teste com diferentes níveis de descentralização dos agentes portageiros. Num dos cenários os agentes portageiros apenas controlam uma única estrada en-quanto que no outro cenário controlam um conjunto de estradas adjacentes, comparável a um quarteirão. Foram realizadas experiências com 5 diferentes populações com preferências de tempo e dinheiro homogéneas dentro da mesma população. Os melhores resultados foram obtidos nas populações que eram igualmente sensíveis ao custo e tempo e levaram a uma redução de tempo de viagem e emissões poluentes. O cenário mais centralizados foi menos eficaz a gerar receitas de créditos.
Acknowledgements
To Daniela, for sharing this journey with me. To my parents and family, for all the support and encouragement over my years of study.
To Zafeiris for all the guidance, knowledge and good spirit over the duration of this work. To Professor Rossetti and CEiiA for the confidence and opportunity to develop this work.
Duarte Brandão
“Do not let these questions restrain or trouble you Just point yourself in the direction of your dreams Find your strength in the sound And make your transition”
Cornelius Harris
Contents
1 Introduction 1
1.1 Context & Motivation . . . 1
1.2 Problem & Goals . . . 1
1.3 Dissertation Structure . . . 2
2 Body of Knowledge 3 2.1 Traffic Assignment Problem . . . 3
2.2 Road Pricing . . . 3
2.2.1 Road pricing acceptability . . . 4
2.2.2 Tradable driving credits schemes . . . 5
2.3 Reinforcement Learning . . . 5
2.3.1 Q-learning Algorithm . . . 7
2.3.2 Reinforcement learning in congestion tolling . . . 8
2.4 Traffic Simulation . . . 8
2.5 Conclusion . . . 9
3 Methodological Approach 11 3.1 Problem description . . . 11
3.2 Distributed Road Pricing . . . 11
3.2.1 Road Manager Agent . . . 12
3.2.2 Driver Agent . . . 13
3.2.3 Interaction Protocol . . . 15
4 Experiments and Results 17 4.1 Setup & Metrics . . . 17
4.1.1 Network Description . . . 17
4.1.2 Evaluation Metrics . . . 18
4.2 Results . . . 19
4.2.1 Link Manager Scenario . . . 19
4.2.2 Area Manager Scenario . . . 20
4.3 Discussion . . . 21
5 Conclusions 27 5.1 Future Work . . . 28
References 29
CONTENTS
A Appendix A 35
A.1 Link Manager Scenario emissions . . . 35
A.2 Area Manager Scenario emissions . . . 35
List of Figures
2.1 Environment-agent interaction in RL [AMF+18]. . . 7
3.1 Evolution of ε over learning episodes . . . 12
4.1 Sioux Falls Network . . . 18
4.2 Evolution of the travel time in the Link Manager scenario . . . 20
4.3 Total revenue of Link agents over time . . . 21
4.4 Normalized CO2emission in the Link Scenario . . . 22
4.5 Evolution of the travel time in the Area Manager scenario . . . 23
4.6 Credit collection results of the area managers . . . 24
4.7 Normalized CO2emission in the Area Scenario . . . 25
4.8 Comparison of average travel time in the last iteration . . . 26
4.9 Total amount of credits collected in the last iteration . . . 26
A.1 Total NO emissions in the link scenario . . . 35
A.2 Total PM emissions in the link scenario . . . 36
A.3 Total NO emissions in the area scenario . . . 36
A.4 Total PM emissions in the area scenario . . . 37
LIST OF FIGURES
List of Tables
2.1 Summary of the behavioral effects observed in tradable credits participants . . . 6
4.1 Driver settings and labels for the experiments . . . 18
4.2 List of evaluation metrics and their units . . . 19
LIST OF TABLES
Abbreviations
GPS Global Positioning System MDP Markov Decision Process
MARL Multi Agent Reinforcement Learning OD Origin-Destination
PM Particulate Matter RL Reinforcement Learning SO System optimum
SUMO Simulation of Urban MObility UE User-Equilibrium
Chapter 1
Introduction
Shifting the focus of the transportation paradigm from the polluting private vehicle onto a more sustainable and efficient mobility system is a necessary step to make our cities greener and more humanized [DMA18]. The excess of cars leads to congestion and a huge negative externality and therefore into degradation of city’s quality of life because of polluting gases they emit [AL11].
1.1
Context & Motivation
This work was developed in a partnership with CEiiA, an R&D center in Matosinhos, Portugal. Its research is focused on the automotive, aerospace and mobility industries. This thesis was developed in the context of the mobility and smart cities department, where CEiiA is developing an ecosystem that tries to influence people’s mobility behaviours towards more environmentally responsible choices. This ecosystem, coined AYR, rewards users with tradable credits according to the CO2emissions they avoid while using low-carbon transport equipment. These credits can then
be exchanged with more mobility services such as micro-mobility providers, electric car charging stations and collective transports. To support this project, a simulation environment is needed to test with the influence of both toll pricing and incentive attribution on road networks, and to assess the population acceptability of these schemes.
1.2
Problem & Goals
As previously stated, this work is intended as a stepping stone in a larger project that seeks to en-courage people to make choices towards more sustainable living styles and cities. This requires a "playground" to test the outcome of the several pricing and reward mechanisms as well as the pos-sibility of testing these mechanisms in different networks and populations. The underlying prob-lem in this work therefore sits on how to impprob-lement an appropriate cognitive mechanism in agents forming up a population of travellers so as to reason about the effects of their decision-making
Introduction
process onto the more global perspective of the performance of the system. Such a capability in social simulation platforms is crucial and paramount so as to allow for a proper analysis of the attributes of incentive that can effectively play a positive role towards making a certain population becoming rather socially sustainable and aware.
As such the main contributions expected from this work and constituting the specific goals herein presented are as follows:
• Explore the state of the art regarding pricing and incentive mechanisms in traffic networks; • Explore the state of the art in the area of road traffic simulators;
• Explore the state of the art in the area of synthetic population design;
• Creation of a module that enables us to simulate the effect of different road pricing strategies in a road traffic simulator;
• Expand the previous module to measure the impact of road pricing on different populations; • Assessment of the developed modules in different scenarios.
1.3
Dissertation Structure
In addition to this Introduction, this document has four more chapters, as follows. Chapter 2
encompasses the related work that has been done in this field and helped shape our approach. Chapter3presents the problem and the implemented solution, which is described in terms of its architecture and used technologies.
The scenarios used to demonstrate our solution are described in chapter4, as well as are discussed the obtained results.
Finally, chapter5draws conclusions and discusses the main contributions from this work, as well as future developments to be considered in further research.
More data from the experiments are presented in the appendixA.
Chapter 2
Body of Knowledge
In this chapter a review of the current state of the knowledge and related works used for developing this thesis are presented. The main focus of this research is on traffic assignment and pricing but also in Artificial Intelligence, namely reinforcement learning and its use in congestion pricing.
2.1
Traffic Assignment Problem
Road networks have a finite amount of vehicles that they can handle efficiently. As road space demand increases and hits the limit of road throughput, traffic begins to build up which leads to a penalty to all parties involved. So an efficient assignment of the users trips becomes paramount to obtain the best possible performance from the network. The tools for this planning have evolved over time as technology and mobility needs change [Pat94].
A problem that affects this assignment is the selfishness of drivers, as they pick the path that benefits them the most (e.g. faster or cheaper) for the trip from their origin to their intended destination [PPK02], which leads to an inefficient use of road resources and the under-performance of the system as a whole. This is known as an user-equilibrium (UE), in which no user can improve upon its selected route by picking another. As such there needs to be a mechanism that adjusts drivers’ preferences to be closer to the system’s optimal assignment (SO). This means that the average travel time of all drivers is the lowest compared to UE, even thought some drivers may have longer travel times. One way to do this is by pricing road use.
2.2
Road Pricing
Charging for the use of road infrastructure has long been proposed as a way to reduce congestion in roads [Piq20, Kni24] , forcing the road users to pay for the negative externally they create to society but also to improve air quality and raise funding for other transport systems [AL11]. Congestion and environmental pollution produced by traffic has led several cities, such as London,
Body of Knowledge
Singapore and Stockholm, to successfully introduce congestion pricing schemes to tackle these problems and change travellers’ habits regarding their commuting [GHN18,Met18].
These schemes entail a payment for traversing the city cordon, with the value being determined by time of day, day of the week and vehicle class. The price brackets are determined by the authority that manages the pricing scheme and are valid usually for a year.
Other pricing schemes have been proposed, such as dynamic pricing schemes that change the prices according to road free space or expected road usage [MSS+07].
δ -tolling is an example of a dynamic pricing scheme, which only requires observation of travel times to price road use [SHR+17]. The price for each link is proportional to the difference between the actual travel time and the free-flow travel time(travel time at maximum possible speed in the link). The authors demonstrate that under their assumptions, the proposed solution is equivalent to marginal-cost tolling, which is known to lead to an optimum performance.
2.2.1 Road pricing acceptability
Even thought road pricing has been shown to improve traffic congestion and an improvement in the quality of life of the cities, it still faces lack of acceptance and resistance to implementation from citizens. This happens due to a feeling of limitation of personal liberties, social injustice since lower income households are more affected by it and that pricing road use is "just another tax"[BR17,JFG00]. All of these stem from the fact that drivers fail to recognise the externali-ties of their commuting habits on others and the system. This low acceptability of charges is a challenge to the implementation of road pricing, since political decision makers are afraid of the consequences of public opinion. In a survey regarding the acceptability of road pricing done in the UK, found that support for road pricing was only 30% if there was no information about the use of the gained revenue but it increased to 57% if it is mandatory the reinvestment of the gains in the transportation area [JWM05].
The main behavioral factors that affect the public perception and acceptance of tolling are[DBXE18]: • Perception of the problems and impact of road congestion
• Infraction personal liberties • Expected outcome and efficiency • Expected personal gain
• Fairness
Due to the low support for road pricing, a possible solution to increase public support is by rewarding drivers for changing their behaviour, such as not driving during the rush-hour[BEE11]. Literature in the psychology of voluntary behaviours has found the effectiveness of the use of rewards and incentives to reinforce the adoption of desired behaviours [KT79]. Applying these ideas in the road pricing area, commuters receive a reward for their avoidance of car use during
Body of Knowledge
rush hour or by shifting to other means of transportation. Regarding the value and type of re-ward, several works have observed that the increase in the value of the reward does not lead to an proportional increase in the rewarded behaviour [TBEEvD13,BvA10]. These works verified the a greater acceptability and participation was achieved during the duration of the experiments, although participants habits after the end of the incentive program was not studied to validate if the rewarded behavior continued afterwards.
2.2.2 Tradable driving credits schemes
In this type of schemes, drivers have a monthly free allowance of credits that they spend as they use their private vehicle. To save their credits, driver can change to other means of transportation or reduce the number of trips. Tradable credits schemes have been successfully used in other areas such as the carbon dioxide emissions trading system[Com13] or in the fishing industries[Sov11,
BAC07], but never implemented in road traffic due to political and societies’ resistance in paying for car use. [KK05] explores the idea of using credits in the road pricing domain to alleviate traffic during rush-hour. These schemes are revenue-neutral and do not imply a payment by the average driver. Credits are attributed monthly and if a user does not spend all of his allowance he can sell them to other drivers that have exceeded their quota. These schemes also lead to an accumulated reduction in the traveled miles if the number of issued credits is gradually reduced over time. This way tradable credits schemes can be a solution to the road pricing problem and an incentive to reduce automobile dependency, since they are understood as a fairer approach, with the possibility for users to make money and that places the additional costs on the higher consuming drivers [DBXE18].
2.2.2.1 Behavioral effects of tradable credits scheme users
[DED17] provides a literature review of several credit schemes and the main behaviors observed in participants, compiled in table2.1. [AUR15] studied and identified population characteristics and how they affect behaviour changes in a tradable carbon credit scheme.
2.3
Reinforcement Learning
Reinforcement Learning (RL) is a machine learning technique in which an agent learns the best way to solve a task through repetition and experimentation, where feedback of the effectiveness of the action is given by a reward signal. This results in a policy that maps actions to states that maximize the earned rewards [Mon99]. To learn this policy, agents use a Markov decision process (MDP) for which they do not need to know the exact mathematical model, making it a model-free learning process. A MDP is defined as:
• a set of states S, • a set of actions A,
Body of Knowledge
Table 2.1: Summary of the behavioral effects observed in tradable credits participants
Behavioral effect Key refer-ences
Explanation Effect in credits schemes
Loss aversion [KT79] Losses weigh more than equivalent gains
Higher propensity to reduce credit usage in a situation of credit shortage than of sur-plus
Endowment effect
[BDOE09, Tha80]
People attribute higher value to objects or resources when they are in their possessions
Higher reluctance to trade credits
Framing [TK81, LSG98]
Presenting an equivalent sit-uation or outcome in a differ-ent format leads to a differdiffer-ent outcome
Credit-spending patterns de-pend on the policy framing by participants and regula-tors
Mental Account-ing
[HS02, Tha99]
Money and resources are psychologically categorised based on different labels
Credits are not equal to the money they represent; the suggested budget limit may encourage credit conserva-tion Endowment effect under uncertainty [KT79, VDVK96]
Endowment effects tend to be stronger in trades with in-volving uncertainties
Uncertainty over the future credit value might encourage credit conservation
Complexity aver-sion
[TK74] People tend to act less ratio-nally and rely more in de-cision heuristics in complex decision contexts
The harder is is to estimate credit value, the more people will make decision that sat-isfy rather than optimise Regret aversion [Bel82,
LS82]
People anticipate the regret felt if an alternative option would result in a better out-come and avoid choice op-tions with larger anticipated regret
In tradable credits decision making contexts with in-creasing levels of uncer-tainty, regret aversion might play a decisive role
Immediacy effect [KR95, GM04]
Immediate rewards have greater value than equivalent future rewards
User might overspend their credits at the start of the credits period
Learning effect [EB05] People learn from their past experiences with feedback
Credit spending may change over time based on how peo-ple are satisfied with previ-ous results
Body of Knowledge
Figure 2.1: Environment-agent interaction in RL [AMF+18].
• a transition function T(s, a, s’), that maps state-action pairs to the probabilistic distribution of successor states
• a reward function R(s, a, s’), which contains the average reward obtained when the agent in state s transitions to s’ using action a
This learning approach, pictured in Figure2.1, is similar to the process humans use to learn how to solve problems, which makes it a great tool to simulate their behavior and enables us to mimic the interactions between complex groups of people and how they learn how to interact with each other.
2.3.1 Q-learning Algorithm
Q-learning is an example of a model-free reinforcement learning algorithm. It allows agents to learn and interact with an environment without the need for previous knowledge [GK09]. The agent tries to learn the optimal policy by selecting the best action a ∈ A in the current state s ∈ S so that the future reward is maximised. The Q-value of action a, Q(a), represents the estimated value of selecting that action. The update function of this algorithm, called the Bellman equation is presented in equation2.1.
Qt+1(st, at) = Qt(st, at) + α(rt+1+ γ max
a Qt(st+1, a) − Qt(st, at)) (2.1)
α is the learning rate and this parameter controls how much the previously gathered knowledge is valued. γ represents the discount value that determines the importance of future rewards and rt+ 1 the reward for the action a.
The strategy to select an action a includes both exploration (discovery of new knowledge) and exploitation (application of gained knowledge). One available strategy is ε-greedy in which a random action is chosen with probability ε (exploration) or the best action with probability 1 − ε (exploitation) is selected. This solution converges towards the optimal policy, under certain conditions.
Body of Knowledge
2.3.2 Reinforcement learning in congestion tolling
As reinforcement learning works as a proxy for human learning behaviour, it can be used to study how humans react to changes in their daily commute, be it new road rules, changes in the road infrastructure or even the interaction between commuters. All the following works in this section use Multi-Agent Reinforcement Learning (MARL), in which a variety of autonomous agents share the same environment and learn about it in a decentralized way. These agents have no direct communication with each other but each agent is affected by the others’ actions through the road network [RVN17].
[MSB+18a] uses RL agents in a micro-tolling scheme that learn how to optimize link toll prices with ∆-tolling to reduce system travel time. ∆-tolling can manage a reduction in system travel time of up to 30% compared to a no-toll scenario.
[TP13, TWA08] presents an approach on how to model reward functions on Multi Agent Systems (MAS) so as to guide these agents to a better system utility. Using a reward function that instead of maximizing their personal utility maximizes a function that has into account the system utility. This approach not only reaches near optimal performance (93-96% of optimum) but also makes the overall network system more stable. [Baz19] combines RL and metaheuristics such as to optimize non-cooperative systems, such as traffic assignment. A central system manager agent is used, who tries to optimize route choices, since it has an overview of the whole system. The driver agent themselves share their preferred route with the manager agent and receive a proposal for a route that is computed as a optimization of the drivers’ preferences. Afterwards the drivers can follow their own preferred route or the one proposed by the manager. As both parts interact with each other and experiment with the proposed routes, the system approaches the SO and a greater social welfare.
[RSRB18] proposes a distributed δ -tolling system, where each driver calculates its own marginal cost, which is charged afterwards. The results in the proposed networks were 99% of the SO, sim-ilar to the results obtained with the regular ∆-tolling, but with a fairer tolling scheme since drivers pay their exact marginal cost and not an approximation.
[MMJ+19] proposes a framework for non-cooperative multi-agent systems that designs incen-tives to modify the reward function of agents and reduce their selfishness to reach the SO.
2.4
Traffic Simulation
Traffic systems are complex dynamics that encompass the interaction between the road infrastruc-ture, public transports, road legislation, urban planning and drivers and their vehicles. As such, any minute change in any of these actors can have a huge impact in the system as a whole. Traf-fic simulators are a great tool to plan and study how a trafTraf-fic system reacts to changes, be it the increase in vehicles, new bus lines, a change in the number of lanes of a street or a new tolling mechanism for a city. Traffic simulators can be classified according to their granularity [CA08]:
Body of Knowledge
Macroscopic models — These type of simulators model traffic as a liquid flow in roads. While highly effective for large volumes of data, their high level of abstraction makes them a difficult tool to study the interactions between vehicles or the evolution of traffic over time.
Mesoscopic models — These models represent an intermediate level in traffic simulation, combining the high computational efficient of macroscopic simulators with some of the more detailed information that is possible to obtain from microscopic models,i.e. link flow, vehicle density and speed [dSVA19].
Microscopic models — These are the most detailed simulators and include information about the exact state of each individual vehicle (speed, position, lane, direction, gas emissions) and system component (traffic lights, bus stops). The detail of the simulated world makes them less computationally efficient. This is the type of simulator used in this work, namely SUMO (Simu-lation of Urban MObility) [LBBW+18].
2.5
Conclusion
In this chapter the current state of the art and the main definitions for the traffic assignment prob-lem and road pricing were presented, along with the main approaches to solve these probprob-lems. The use of tolls is an easy to implement solution to fix road congestion, but its outcome and impact in individual roads in large complex systems as metropolitan cities is difficult to assess. Through the use of traffic simulators and multi-agent reinforcement learning techniques, city planners can bet-ter understand the outcome of these policies in a simulated environment in which the participants behave similarly to humans.
Body of Knowledge
Chapter 3
Methodological Approach
In this chapter, the road congestion problem, our approach to solve it and the design choices of the developed solution are presented. We describe the main actors as well as the interactions between them. Our two approaches to solve this problem are detailed and discussed.
3.1
Problem description
Road networks have a finite amount of vehicles that they can handle efficiently. As travel demand increases and hits the limit of road capacity and network throughput, traffic begins to build up which leads to a penalty to all parties involved. So an efficient assignment of the vehicles to routes becomes paramount to obtain the best possible performance from the network. Drivers are self-interested and pick the route that they evaluate to have the most advantageous outcome for them, without any regard to the congestion they cause upon roads and other users. Due to this selfish behaviour, road space is not used in the most efficient manner. As shown in chapter2, pricing road use can be used as a signal for drivers to alter the perception of what they think is the best path, guiding the system to a better performance. But setting the correct price to divert drivers interest’s and optimize the road network is a complex problem that depends not only on the specificities of the network but also of the drivers population. We plan to develop a framework to test the effect of decentralized congestion tolling, its performance according to the level of toll decentralization and the susceptibility of the driver population to spend money as a way to improve drivers’ own perception of utility.
3.2
Distributed Road Pricing
Our proposed methodology models a road network as a multi-agent system, where there are two types of agents, namely the drivers and the road managers. Drivers are agents that represent the demand of the traffic system, whereas road managers are agents that represent the road and
Methodological Approach
tolling infrastructure. Drivers try to commute from their origin to destination with the lowest cost possible, which requires balancing credits spent and travel time. The road managers are responsible for setting the amount of credits a driver has to pay to traverse a link, with the purpose of maximizing the flow. It is assumed that every driver has an electronic device in its car that communicates with the road infrastructure for purposes of toll collection/payment, such as the one presented in [AR07] and which is common on most motorways.
3.2.1 Road Manager Agent
Road managers, M, are the agents responsible for analysing the use of the links they manage (LM) and price them accordingly. Their goal is to maximize the flow of vehicles in the links they manage and information is not shared between the different managers. There is also a max price, Pmax, to
which the manager can set the price to. Road managers use RL to update the price of their links after a learning episode. This episode corresponds to a fixed short time of the day, for instance the afternoon rush hour. The flow during this period is observed, the reward computed and the price for the next episode picked. Road managers use a MDP model, where the action space (A) is a set of fractions of the Pmaxthat the manager can set.
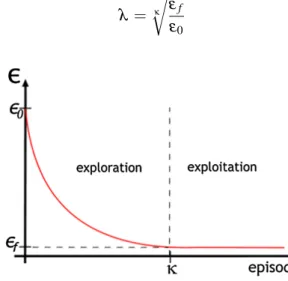
Decaying ε-greedy is used as the exploration method for road managers. With this method, the agent selects either the best action with probability 1 − ε or a random action with probability ε . Initially ε has a high value which leads to a higher exploration by the agent. As episodes go by, ε is decreased by a factor λ , according to equation 3.1, where κ is the number of episodes for the exploration phase, and ε0and εf are the starting and final values for ε. This exponential
decrease leads to less exploration and more exploitation of the learned knowledge as time goes by, as presented in Figure3.1. λ = κ r εf ε0 (3.1)
Figure 3.1: Evolution of ε over learning episodes
The manager reward function, Rm, is linked to the number of vehicles that travel through the
links it manages, so a higher count leads to a higher reward. So the manager will learn the best 12
Methodological Approach
price to maximize the vehicles that travel through its links. But if this price is too attractive to drivers, the use may increase and congestion is likely occur if the link capacity is exceeded, which in turn prevents more drivers from using it and the reward is lower. Road managers use a stateless MDP model and their update behavior is described in algorithm1.
Algorithm 1 Road Manager algorithm % Inputs % 1: ε0← 1 2: εf ← 0.01 3: λ ← κ q εf ε0 . Eq3.1 4: A← {0, 0.1, 0.2, 0.3, ..., 1} . Action space
5: procedure UPDATEPRICES(i)
6: for all m ∈ M do
7: for all l ∈ LMmdo
8: Rm← Rm+ vl . Count the number of vehicles in the links managed by the agent 9: end for
10: Qm(p) ← (1 − α) Qm(p) + α ∗ Rm 11: if random() < ε then
12: pa← selectRandom(A) 13: else
14: pa← arg maxa∈AQm(a) 15: end if 16: end for 17: if i < κ then 18: ε ← ε ∗ λ 19: end if 20: end procedure 3.2.2 Driver Agent
Let D be the set of drivers in the simulation. Each driver is modeled as a Q-learning agent whose objective is to leave its origin link, lo
d, and travel to its destination, l d
d, on the network, while
minimizing its cost. The cost is the sum of all the costs (time and toll) incurred for traversing each link l (Equation3.2) in its route, Rd. The cost the driver agent perceives for crossing a link
is represented in Equation3.3, where td,lrepresents the travel time for link l and pd,lthe price the
driver has to pay for the toll. The coefficient σd∈ [0, 1] represents the driver’s sensibility to travel
time, so a driver with a higher σ value will prefer a faster route and a driver with a lower σ will 13
Methodological Approach
instead prefer a cheaper one (even if it has to take a slower route to reach his destination). cd=
∑
l∈Rd
cd,l (3.2)
cd,l= σ td,l+ (1 − σ ) pd,l (3.3)
Every agent knows the road network, represented by a graph G = (N, L), where N is the set of nodes or intersections of the road network and L is the set of links that connect these nodes representing the roads. As such, drivers have the knowledge of every road in the network. This assumption is easily replicated in the real world due to the ease of access to navigational devices, such as GPS. Even thought drivers know the network layout they only have knowledge about the link prices and traffic conditions of links they have traveled trough, meaning that they must explore to obtain this knowledge. Since initially drivers do not have this knowledge, they estimate costs using the free flow of the links they wish to travel through. As drivers explore and travel through links they update their knowledge of the cost, overwriting previous knowledge if they had it. Drivers are also RL agents implementing Q-learning, like the road managers. The action space is the set of routes they can use to reach their destination and the Q-value represents the cost that the driver perceives for that route. To reduce the available possibilities for actions, the routes are pre-computed with the KSP algorithm, proposed by [Yen71], for each OD-pair to remove looped paths and very long routes. This assumption can be justified as an approximation to the way that humans plan their journeys, picking a route from a small set of possibilities instead of all the possible choices that a complex urban network provides. The algorithm for initialization and Q-table update is described in Algorithm2.
Methodological Approach
Algorithm 2 Driver algorithm
1: procedure INITIALIZEDRIVERS 2: for all d ∈ D do
3: Rd← kShortestPaths(k, ldo, l d
d) . Compute k shortest paths 4: for all r ∈ Rddo
5: Qd(r) ← calculateRouteInitialCost(r) 6: end for
7: end for
8: end procedure
9: procedure PICKNEXTROUTE(i) 10: for all d ∈ D do 11: Qd(r) ← (1 − α) Qd(r) + α ∗ cd 12: if random() < ε then 13: r← selectRandom(Rd) 14: else 15: r← arg minr∈Rd Qd(r) 16: end if 17: end for 18: if i < κ then 19: ε ← ε ∗ λ 20: end if 21: return r 22: end procedure 3.2.3 Interaction Protocol
Agents presented in the previous section interact in a simulated world provided by SUMO, a microscopic traffic simulator. The code developed controls and interacts with SUMO through TraCI [WPR+08], which provides a real-time interface for communicating with the TraCI server implemented by SUMO. Through this interface, the cognitive engine of agents can reflect their decisions upon the environment in which drivers embodied in vehicles leave and interact.
The trips the drivers perform represent a commute, so each trip happens once a day, which is also our iteration step for the simulation. This way drivers travel everyday from their origin to their destination, sometimes taking new routes, and learn more about the environment and traffic status. Within each iteration, drivers are able to perceive the cost experimented after traversing each link, and therefore the travel time and respective travel cost after performing the entire itinerary. Decisions made on each day therefore represents the within-day dynamics of microscopic traffic simulation.
Methodological Approach
After each iteration, the results of the simulation are collected and both the drivers and road managers update their knowledge as described before. Managers update the prices for the links they manage and a new route for each driver is selected accordingly. This iteration strategies implements the so-called day-to-day dynamics of microscopic traffic simulation.
The work developed proposes 2 levels of decentralization for the Road manager agents. These agents can either control a single link and price the cost of traversing it with the purpose of maxi-mizing traffic flow, or control a group of links and setting the price according the aggregate traffic flow of all the subordinate links. It is reasoned that with this mid-level decentralized approach, focusing on urban groupings larger than roads such as city zones or a group of adjacent zones, we are able to obtain comparable network optimization results without the inherent complexity and cost of a fully distributed solution.
Chapter 4
Experiments and Results
In this chapter, the setup and results of the experiments conducted in the context of this work are presented. The tested scenarios are comprised of a scenario where each road manager only man-ages a single link (Link Manager Scenario) and a scenario where each road manager is responsible for a set of links (Area Manager Scenario). The goal of our experiments is to compare the per-formance of the Link Manager scenario against the Area Manager scenario with populations with different time sensibilities.
4.1
Setup & Metrics
These results were obtained in the system described in chapter3. The experiments were divided in two big groups according to the scenario: Link Manager Scenario and Area Manager Scenario. The Link Manager Scenario represents a very largely distributed road manager system where each manager is only responsible for observing the traffic and setting the price on a single road. The second scenario, Area Manager Scenario, represents one where the road managers have a bigger area of influence. This area would be akin to a city block or a group of them. These two scenarios are combined with a driver population with homogeneous time preference, σ (see section.3.2.2). Both experiments use the same OD matrix for the drivers and the same amount of commuters (| D | = 6000) that are inserted in the network over a period of one hour. The car type used by all the drivers is the same and corresponds to a gasoline driven light duty vehicle with an Euro 4 emissions standard characteristics. Each scenario is combined with a different population and the results are collected and analysed. All the available combinations of the experiment variables and the labels used for this work are shown in table4.1.
4.1.1 Network Description
The same network is used in both scenarios, the Sioux Falls network (SF) presented in figure4.1. This network is widely used in the literature as a benchmark[MSB+18b,Baz19, RSRB18] and
Experiments and Results
Link Manager Area Manager Drivers’ preference (σ ) 1 L1 A1 0.75 L2 A2 0.50 L3 A3 0.25 L4 A4 0 L5 A5
Table 4.1: Driver settings and labels for the experiments
was chosen for this reason. It is constituted by 24 vertices (intersections) and 76 links (roads) and is defined here1. Intersections connected by an edge are represented by 2 one-way links, one for each direction of traffic.
Figure 4.1: Sioux Falls Network
4.1.2 Evaluation Metrics
To compare the performance of all the scenarios, a group of metrics are observed and collected every iteration. They are shown in table4.2. Average Travel Time refers to the average time that drivers take to reach their destination in that iteration and is measured in seconds. Total Toll Revenue refers to the absolute value of credits paid by the drivers and collected by all the road managers in a iteration. Average Toll revenue is the average amount of credits collected by the road manager
1https://github.com/bstabler/TransportationNetworks/tree/master/SiouxFalls
Experiments and Results
per link. Average CO2 refers to the CO2 emitted across the whole network, normalized by time
and road length. Minimum CO2refers to the minimum value of CO2emitted in a edge, normalized
by time and edge length. Maximum CO2refers to the maximum value of CO2, normalized by time
and length. Average PM refers to the PM emitted across the whole network, normalized by time and road length. Minimum PM refers to the minimum value of PM emitted in a edge, normalized by time and edge length. MaximumPM refers to the maximum value of PM, normalized by time and length. Average NOxrefers to the NOxemitted across the whole network, normalized by time
and road length. MinimumNOxrefers to the minimum value of NOxemitted in a edge, normalized
by time and edge length. Maximum NOxrefers to the maximum value of NOx, normalized by time
and length.
Variable Unit Average Travel Time seconds
Total Toll Revenue credits Average Toll Revenue credits Average CO2 g/km/h Minimum CO2 g/km/h Maximum CO2 g/km/h Average PM g/km/h Minimum PM g/km/h Maximum PM g/km/h Average NOx g/km/h Minimum NOx g/km/h Maximum NOx g/km/h
Table 4.2: List of evaluation metrics and their units
4.2
Results
In this section, the results of all the described experiments are shown. These experiments were run for 400 iterations (κ = 400), with ε0= 1, εf = 0.01, Pmax= 100 and the action space for the driver
agents consists of the 6 fastest routes.
4.2.1 Link Manager Scenario
In this Scenario every road manager has only a single link in the list of managed roads. As such, this scenario contains 76 road manager agents.
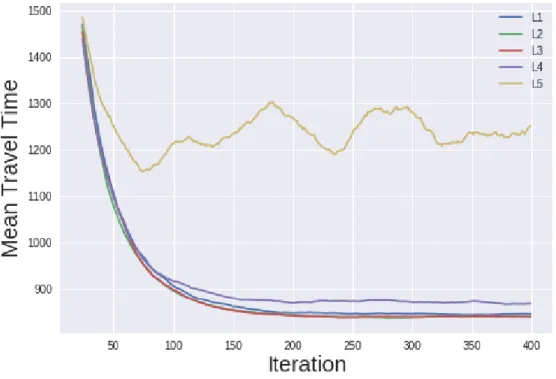
As we can observe in figure4.2, the overall travel time in the network decreases as the learning episodes go by. Experiment L5, where the drivers are only sensible to credits spent has the worse travel time performance. In this experiment drivers take the slower routes with less traffic and as a result cheaper. Regarding travel time in the other experiments, the performance is similar between them.
Experiments and Results
For the amount of credits collected, L3 is the experiment where the drivers have to spend less for satisfactory results, improving their average trip time. Driver populations that only take into account the credits spent into their trip planning end up paying much more than other more balanced populations.
Regarding the car exhaust emissions, all the 3 observed gases are, as expected, heavily cor-related and as such the reasoning’s obtained from CO2 emissions can be extended to the other
gases. The results for PM and NOxcan be consulted in AppendixA. Regarding the emissions on
a single link, we can gather from figure4.4band 4.4cthat because of the greater congestion and driver clustering in the same roads the road infrastructure is used very inefficiently. This leads to high emissions in the most congested roads and very low emissions in the under-used ones, even though the global network emissions are comparable among the scenarios.
Figure 4.2: Evolution of the travel time in the Link Manager scenario
4.2.2 Area Manager Scenario
In the Area manager Scenario, managers control a larger number of links. In this scenario there are 6 road manager agents, where each controls a different number of adjacent links. The number of links controlled by a single agent ranges from 6 to 18 links.
As with Link manager scenario, this scenario saw an improvement in the average travel speed. Regarding the revenue collected in this scenario, the users with the highest sensibility to time (A1) spent many more credits for a comparable mean travel time. In the experiments where the drivers
Experiments and Results
Figure 4.3: Total revenue of Link agents over time
combined both price and travel time to pick the route (A2,A3,A4) both the trip time and the cost become lower over time. Regarding CO2emissions, as congestion is reduced and drivers are able
to move faster and with less traffic the global emissions diminish.
4.3
Discussion
As stated before, all these results were obtained in the SF network with 6000 cars traveling in the network over 1 hour. All the experiments except A5 and L5 led to similar mean travel times, which highly suggests that the system was able to reach an equilibrium. Both scenarios’ evolution of travel time suggest that the population sensibility to time and cost has a low impact on the learning and optimization evolution of the road managers. Both road manager and driver agents learning process converge quickly, at around 100 iterations. The experiments A5 and L1 can be used as baseline, since the preferences of these populations prevent them from efficiently interacting with the road managers and receive their feedback signals (toll price). In the Link manager scenario, the mean travel time performance was slightly better that the equivalent Area Manager scenario (see figure4.8).
The Area manager scenario was able to perform comparably to the Link manager scenario in all the evaluation indicators of the different experiments while collecting a lower amount of credits from the drivers (fig4.9). This can either be a positive or negative outcome depending on
Experiments and Results
(a) Total CO2emissions of the network (g/km/h)
(b) Maximum CO2emission on a link
(c) Minimum CO2emission on a link
Experiments and Results
Figure 4.5: Evolution of the travel time in the Area Manager scenario
the purpose of the city officials when implementing this solution. An area based solution would cost less to the drivers while having a positive impact in the city compared to a link based, where higher credits collection would mean a bigger profit for the tolling entity.
Regarding the driver population, although with a very small efficiency gain compared to others, the congestion tolling is more effective in the population that values time and credits equally (σ = 0.5). This population achieves the best results in the combined metrics of travel time, credits spent on tolling and low emissions.
Experiments and Results
(a) Total revenue of Area agents over time
(b) Average revenue per link over time
Figure 4.6: Credit collection results of the area managers
Experiments and Results
(a) Total CO2emissions of the network (g/km/h)
(b) Maximum CO2emission on a link in the Area scenario
(c) Minimum CO2emission on a link in the area scenario
Figure 4.7: Normalized CO2emission in the Area Scenario
Experiments and Results
Figure 4.8: Comparison of average travel time in the last iteration
Figure 4.9: Total amount of credits collected in the last iteration
Chapter 5
Conclusions
In this work we proposed a distributed congestion tolling mechanism to solve the traffic assignment problem, enabling us to improve the mean travel time and reduce the polluting emissions from a city. The proposed work was tested using 2 different levels of decentralization in the Sioux Falls network with several homogeneous driver populations. Drivers are also Q-learning agents whose goal function is to minimize travel time and credits spent with different preference levels. This preference reflects the drivers sensibility to trip time and credits spent.
The 1st scenario reflects a network where each link is independently tolled by a Q-learning agent, whose goal is to maximize the flow of vehicles. The second scenario represents a network which manages and tolls a group of links equiparable to a city zone. Each scenario was simulated with SUMO, using 5 different populations which have time sensitivity ranging from 0 to 100%. Elements of the same population share the same preferences. The evaluation metrics are the mean travel time across the network, the overall amount of credits collected by road managers and the polluting emissions.
Both scenarios were effective in reducing the mean travel time and overall emissions in the populations that were sensitive to time (σ < 1). The experiment resulting in the best performance was the link managers scenario combined with the driver population with time preference σ = 0.5. This combination achieved the lowest mean travel time while collecting less credits (cost to the population was lower) and maintaining low CO2emissions.
With these experiments we were able to obtain comparable results with the current research and demonstrate the possibility of using agents that manage several links to perform congestion pricing. These managers were capable of reducing congestion and travel time, although at the loss of revenue as compared to link managers.
Due to the proliferation of smartphones and connected vehicles, this system can be adapted for use in our cities. Road managers would be able to receive the expected number of vehicles and notify the drivers with the toll price for their planned trips.
Conclusions
5.1
Future Work
Although we were able to obtain promising results we feel that this approach needs further study, specially with more complex and congested networks. Our model also needs to consider het-erogeneous driver populations to better reflect real-world conditions. We hypothesise that this would give us more diverse and interesting results and a better comprehension of the advantages of each approach. We would also like to compare the performance of credit-based incentives vs. toll payments.
References
[AL11] Alex Anas and Robin Lindsey. Reducing urban road transportation externalities: Road pricing in theory and in practice. Review of Environmental Economics and Policy, 5(1):66–88, 2011.
[AMF+18] Roohollah Amiri, Hani Mehrpouyan, Lex Fridman, Ranjan K. Mallik, Arumugam Nallanathan, and David Matolak. A Machine Learning Approach for Power Allo-cation in HetNets Considering QoS. IEEE International Conference on Communi-cations, 2018-May(March), 2018.
[AR07] Ganesh K Andurkar and Vidya R Ramteke. Smart Highway Electronic Toll Col-lection System. International Journal of Innovative Research in Computer and Communication Engineering (An ISO, 3297(5):4087–4094, 2007.
[AUR15] H. M.Abdul Aziz, Satish V. Ukkusuri, and Julian Romero. Understanding short-term travel behavior under personal mobility credit allowance scheme using exper-imental economics. Transportation Research Part D: Transport and Environment, 36:121–137, 2015.
[BAC07] J. R. Beddington, D. J. Agnew, and C. W. Clark. Current problems in the manage-ment of marine fisheries, 6 2007.
[Baz19] Ana L.C. Bazzan. Aligning individual and collective welfare in complex socio-technical systems by combining metaheuristics and reinforcement learning. Engi-neering Applications of Artificial Intelligence, 79(December 2018):23–33, 2019. [BDOE09] M Bleimer, M Dicke-Ogenia, and Dick Ettema. Rewarding for avoiding the peak
period: A synthesis of three studies in the Netherlands. European Transport, (2005):1–15, 2009.
[BEE11] Eran Ben-Elia and Dick Ettema. Changing commuters’ behavior using rewards: A study of rush-hour avoidance. Transportation Research Part F: Traffic Psychology and Behaviour, 14(5):354–368, 2011.
[Bel82] David E. Bell. Regret in Decision Making under Uncertainty. Operations Research, 30(5):961–981, 10 1982.
[BR17] Sebastian Bamberg and Daniel Rölle. Determinants of People’s Acceptability of Pricing Measures: Replication and Extension of a Causal Model. Acceptability of Transport Pricing Strategies, (June 2018):235–248, 2017.
[BvA10] Michiel C J Bliemer and Dirk H. van Amelsfort. Rewarding instead of charging road users: A model case study investigating effects on traffic conditions. European Transport - Trasporti Europei, 44(44):23–40, 2010.
REFERENCES
[CA08] David Charypar and Kay W Axhausen. A High-Performance Traffic Flow Mi-crosimulation for Large Problems A High-Performance Traffic Flow Microsimula-tion for Large Problems. Event (London), 2008.
[Com13] European Commission. The EU Emissions Trading System (EU ETS). Technical Report July, 2013.
[DBXE18] Nico Dogterom, Yue Bao, Meng Xu, and Dick Ettema. Acceptability of a tradable driving credit scheme in the Netherlands and Beijing. Case Studies on Transport Policy, 6(4):499–509, 2018.
[DED17] Nico Dogterom, Dick Ettema, and Martin Dijst. Tradable credits for managing car travel: a review of empirical research and relevant behavioural approaches. Trans-port Reviews, 37(3):322–343, 2017.
[DMA18] Iain Docherty, Greg Marsden, and Jillian Anable. The governance of smart mobil-ity. Transportation Research Part A: Policy and Practice, 115(October 2017):114– 125, 2018.
[dSVA19] Felipe de Souza, Omer Verbas, and Joshua Auld. Mesoscopic traffic flow model for agent-based simulation. Procedia Computer Science, 151(2018):858–863, 2019. [EB05] Ido Erev and Greg Barron. On adaptation, maximization, and reinforcement
learn-ing among cognitive strategies. Psychological Review, 112(4):912–931, 2005. [GHN18] Colin P Green, John S Heywood, and Maria Navarro. Did the London Congestion
Charge Reduce Pollution? Economics Working Paper Series, 7:1–35, 2018. [GK09] Eduardo Rodrigues Gomes and Ryszard Kowalczyk. Dynamic analysis of
multia-gent Q-learning with ε-greedy exploration. Proceedings of the 26th International Conference On Machine Learning, ICML 2009, pages 369–376, 2009.
[GM04] Leonard Green and Joel Myerson. A discounting framework for choice with de-layed and probabilistic rewards. Psychological bulletin, 130(5):769–92, 2004. [HS02] Chip Heath and Jack B. Soll. Mental Budgeting and Consumer Decisions. Journal
of Consumer Research, 23(1):40, 2002.
[JFG00] C. Jakobsson, S. Fujii, and T. Gärling. Determinants of private car users’ acceptance of road pricing. Transport Policy, 7(2):153–158, 2000.
[JWM05] S. Jaensirisak, M. Wardman, and A. D. May. Explaining Variations in Public Ac-ceptability of Road Pricing Schemes. Journal of Transport Economics and Policy, 39(2):127–154, 2005.
[KK05] Kara M. Kockelman and Sukumar Kalmanje. Credit-based congestion pricing: A policy proposal and the public’s response. Transportation Research Part A: Policy and Practice, 39(7-9):671–690, 2005.
[Kni24] F. H. Knight. Some Fallacies in the Interpretation of Social Cost. The Quarterly Journal of Economics, 38(4):582, 8 1924.
[KR95] Gideon Keren and Peter Roelofsma. Immediacy and certainty in intertemporal choice. Organizational Behavior and Human Decision Processes, 63(3):287–297, 9 1995.
REFERENCES
[KT79] Daniel Kahneman and Amos Tversky. Prospect Theory: An Analysis of Decision under Risk. Econometrica, 47(2):263, 1979.
[LBBW+18] Pablo Alvarez Lopez, Michael Behrisch, Laura Bieker-Walz, Jakob Erdmann, Yun Pang Flotterod, Robert Hilbrich, Leonhard Lucken, Johannes Rummel, Pe-ter Wagner, and Evamarie Wiebner. Microscopic Traffic Simulation using SUMO. In IEEE Conference on Intelligent Transportation Systems, Proceedings, ITSC, vol-ume 2018-Novem, pages 2575–2582. Institute of Electrical and Electronics Engi-neers Inc., 12 2018.
[LS82] Graham Loomes and Robert Sugden. Regret Theory: An Alternative Theory of Rational Choice Under Uncertainty. The Economic Journal, 92(368):805, 12 1982. [LSG98] Irwin P. Levin, Sandra L. Schneider, and Gary J. Gaeth. All Frames Are Not Cre-ated Equal: A Typology and Critical Analysis of Framing Effects. Organizational Behavior and Human Decision Processes, 76(2):149–188, 1998.
[Met18] David Metz. Tackling urban traffic congestion: The experience of London, Stock-holm and Singapore, 12 2018.
[MMJ+19] David Mguni, Sergio Valcarcel Macua, Joel Jennings, Sofia Ceppi, Emilio Sison, and Enrique Munoz De Cote. Coordinating the crowd: Inducing desirable equilibria in non-cooperative systems. In Proceedings of the International Joint Conference on Autonomous Agents and Multiagent Systems, AAMAS, volume 1, pages 386– 394, 1 2019.
[Mon99] P.Read Montague. Reinforcement Learning: An Introduction, by Sutton, R.S. and Barto, A.G. Trends in Cognitive Sciences, 3(9):360, 1999.
[MSB+18a] Hamid Mirzaei, Guni Sharon, Stephen Boyles, Tony Givargis, and Peter Stone. Enhanced Delta-tolling: Traffic Optimization via Policy Gradient Reinforcement Learning. IEEE Conference on Intelligent Transportation Systems, Proceedings, ITSC, 2018-Novem:47–52, 2018.
[MSB+18b] Hamid Mirzaei, Guni Sharon, Stephen Boyles, Tony Givargis, Peter Stone, and Sioux Falls. Link-based Parameterized Micro-tolling Scheme for Optimal Traffic Management Extended Abstract. Proc. of the 17th International Conference on Au-tonomous Agents and Multiagent Systems (AAMAS 2018), pages 2013–2015, 2018. [MSS+07] M. (Infras) Maibach, C. (Infras) Schreyer, D. (Infras) Sutter, H.P. (Ce Delft) van Essen, B.H. (Ce Delft) Boon, R. (Ce Delft) Smokers, a. (Ce Delft) Schroten, C. (Fraunhofer Gesellschaft Isi) Doll, B. (University of Gdansk) Pawlowska, and M. (University of Gdansk) Bak. Handbook on estimation of external costs in the transport sector. Internalisation Measures and Policies for All external Cost of Transport (IMPACT), page 336, 2007.
[Pat94] Michael. Patriksson. The Traffic Assignment Problem: Models and Methods. An-nals of Physics, 54(2):xii, 223 p., 1994.
[Piq20] Arthur Cecil Piqou. The economics of welfare. The Economics of Welfare, pages 1–876, 1920.
REFERENCES
[PPK02] Praveen Paruchuri, Alok Reddy Pullalarevu, and Kamalakar Karlapalem. Multi agent simulation of unorganized traffic. In Proceedings of the International Con-ference on Autonomous Agents, number 2, pages 176–183, New York, New York, USA, 2002. ACM Press.
[RSRB18] Gabriel de O. Ramos, Bruno C. Silva, Roxana R˘adulescu, and Ana L. C. Bazzan. Learning System-Efficient Equilibria in Route Choice Using Tolls. Proceedings of the Adaptive Learning Agents Workshop 2018 (ALA-18), 2018.
[RVN17] Roxana Radulescu, Peter Vrancx, and Ann Nowé. Analysing Congestion Problems in Multi-Agent Reinforcement Learning. In Proceedings of the 16th Conference on Autonomous Agents and MultiAgent Systems, AAMAS ’17, page 1705–1707, Rich-land, SC, 2017. International Foundation for Autonomous Agents and Multiagent Systems.
[SHR+17] Guni Sharon, Josiah P Hanna, Tarun Rambha, Michael W Levin, Michael Albert, Stephen D Boyles, and Peter Stone. Real-time Adaptive Tolling Scheme for Opti-mized Social Welfare in Traffic Networks. Proc. of the 16th International Confer-ence on Autonomous Agents and Multiagent Systems (AAMAS 2017), pages 828– 836, 2017.
[Sov11] Benjamin K. Sovacool. The policy challenges of tradable credits: A critical review of eight markets. Energy Policy, 39(2):575–585, 2 2011.
[TBEEvD13] Taede Tillema, Eran Ben-Elia, Dick Ettema, and Janet van Delden. Charging ver-sus rewarding: A comparison of road-pricing and rewarding peak avoidance in the Netherlands. Transport Policy, 26(2013):4–14, 2013.
[Tha80] Richard Thaler. Toward a positive theory of consumer choice. Journal of Economic Behavior and Organization, 1(1):39–60, 1980.
[Tha99] Richard H. Thaler. Mental Accounting Matters. Journal of Behavioral Decision Making, 206(September 1998), 1999.
[TK74] Amos Tversky and Daniel Kahneman. Judgment under Uncertainty: Heuristics and Biases. Science, 185(4157):1124 LP – 1131, 9 1974.
[TK81] A Tversky and D Kahneman. The framing of decisions and the psychology of choice. Science, 211(4481):453 LP – 458, 1 1981.
[TP13] Kagan Tumer and Scott Proper. Coordinating actions in congestion games: Impact of top-down and bottom-up utilities. Autonomous Agents and Multi-Agent Systems, 27(3):419–443, 2013.
[TWA08] Kagan Tumer, Z.T. Zachary T Welch, and Adrian Agogino. Aligning social welfare and agent preferences to alleviate traffic congestion. Proceedings of the 7th inter-national joint conference on Autonomous agents and multiagent systems-Volume 2, 2(Aamas):655–662, 2008.
[VDVK96] Eric Van Dijk and Daan Van Knippenberg. Buying and selling exchange goods: Loss aversion and the endowment effect. Journal of Economic Psychology, 17(4):517–524, 8 1996.
REFERENCES
[WPR+08] Axel Wegener, Michat Piórkowski, Maxim Raya, Horst Hellbrück, Stefan Fischer, and Jean Pierre Hubaux. TraCI: An interface for coupling road traffic and network simulators. Proceedings of the 11th Communications and Networking Simulation Symposium, CNS’08, pages 155–163, 2008.
[Yen71] Jin Y. Yen. Finding the K Shortest Loopless Paths in a Network . Management Science, 17(11):712–716, 1971.
REFERENCES
Appendix A
Appendix A
A.1
Link Manager Scenario emissions
Figure A.1: Total NO emissions in the link scenario
A.2
Area Manager Scenario emissions
Appendix A
Figure A.2: Total PM emissions in the link scenario
Figure A.3: Total NO emissions in the area scenario
Appendix A
Figure A.4: Total PM emissions in the area scenario
![Figure 2.1: Environment-agent interaction in RL [AMF + 18].](https://thumb-eu.123doks.com/thumbv2/123dok_br/15212235.1019518/27.892.258.679.142.355/figure-environment-agent-interaction-rl-amf.webp)