Mobile Augmented Reality Techniques for Emergency Response
Alexandre Campos
NOVA LINCS,
Faculdade de Ciências e Tecnologia, Universidade NOVA de Lisboa [email protected]
Nuno Correia
NOVA LINCS,
Faculdade de Ciências e Tecnologia, Universidade NOVA de Lisboa
Teresa Romão
NOVA LINCS,
Faculdade de Ciências e Tecnologia, Universidade NOVA de Lisboa
Isabel Nunes
UNIDEMI,
Faculdade de Ciências e Tecnologia, Universidade NOVA de Lisboa
Mário Simões-Marques
CINAV- Portuguese Navy [email protected]
ABSTRACT
In an emergency situation, each response agent must act quickly and accurately. The support of a mobile device that can provide an appropriate insight of the surroundings and that allows users to exchange information with the other members of the emergency teams, can prevent harm and even save many lives. This paper presents a mobile application that integrates a georeferenced system with augmented reality techniques, in order to serve the needs of the operatives in emergency situations. The work intends to introduce solutions which optimize the performance with which the user takes advantage of the mobile application, such as the organization of the data flow that is displayed and the augmentation of the surrounding area. User studies were conducted with members of the National Navy. The results were positive although there are still some aspects that should be improved.
CCS CONCEPTS
• Human-centered computing → Mixed / augmented reality.
KEYWORDS
emergency response, mobile augmented reality, location based sys-tem
ACM Reference Format:
Alexandre Campos, Nuno Correia, Teresa Romão, Isabel Nunes, and Mário Simões-Marques. 2019. Mobile Augmented Reality Techniques for Emer-gency Response. In 16th EAI International Conference on Mobile and Ubiqui-tous Systems: Computing, Networking and Services (MobiQuiUbiqui-tous), Novem-ber 12–14, 2019, Houston, TX, USA.ACM, New York, NY, USA, 9 pages. https://doi.org/10.1145/3360774.3360825
Permission to make digital or hard copies of all or part of this work for personal or classroom use is granted without fee provided that copies are not made or distributed for profit or commercial advantage and that copies bear this notice and the full citation on the first page. Copyrights for components of this work owned by others than ACM must be honored. Abstracting with credit is permitted. To copy otherwise, or republish, to post on servers or to redistribute to lists, requires prior specific permission and/or a fee. Request permissions from [email protected].
MobiQuitous, November 12–14, 2019, Houston, TX, USA © 2019 Association for Computing Machinery. ACM ISBN 978-1-4503-7283-1/19/11...$15.00 https://doi.org/10.1145/3360774.3360825
1
INTRODUCTION
In emergency situations, such as natural disasters, it is crucial for first responders to have a clear and adequate access to information about the surrounding environment, in order to allow a fast and efficient response. Dealing with these scenarios is not a simple task, since usually first responders face chaotic situations in places they do not know and often with inaccurate and incomplete information regarding the events. However, recent technological advances allow the arising of new approaches and techniques to respond to the needs.
Mobile devices are increasingly being used by our society and are playing an important role in how we perceive the world and relate with others. Augmented reality, on the other hand, is a technology that is gaining preponderance and various ways of integrating it in different contexts are currently being studied.
The aim of this work is to develop a mobile application capa-ble of assisting the tasks and decisions of first responders through the use of emerging technologies, namely augmented reality tech-niques, that allow the visualization of georeferenced data, which correspond to the various occurrences (points of interest, incidents, teams operating) reported during an emergency operation.
The mobile application integrates an intelligent distributed sys-tem, funded by the National Ministry of Defense and by the Na-tional Navy, that aims at supporting and facilitating the exchange of information between the different actors involved in disaster recovery and rescue operations, especially the agents operating on the ground (first responders) and the decision makers present in the command center, providing them with a situational and holistic understanding of the occurrences [11].
The mobile application developed in the scope of this work follows an iterative and user-centered design methodology and started from a previously built prototype [9]. The new version, discussed in this article, adds new solutions at the level of the graphical interface, new features, and improved techniques that enhance the user experience, including optimized augmented reality techniques, which are the main subject of this work.
This paper discusses the mobile application development pro-cess, the new contributions introduced, mostly augmented reality techniques, and the consequent outcomes. It is structured as fol-lows. Section 2 briefly reviews related work in the field of mobile
Augmented reality (AR) combines, in real time, virtual objects with the real world, providing additional information about the real environment. AR techniques have been used in many different areas, such as military, infrastructure construction, robotics, medicine or entertainment [1]. Marketing campaigns and tour itineraries are also benefiting from the use of AR systems [17]. In the context of emergency situations, mobile systems that make use of AR are being studied and developed as described next.
Training emergency responders through AR mobile interfaces -The work described in [13] aims at supporting emergency responders trainees in acquiring familiarity with new technologies which can prepare them to face disaster situations. The authors propose the adoption of augmented reality mobile interfaces to enhance the training efficacy for on-site crisis preparedness activities. The sys-tem provides an integrated solution for mobile devices which is composed by two visualization modalities: MapMode corresponds to a two-dimensional map view, where paths and geographic objects of interest are drawn on the map; LiveMode exploits the augmented reality techniques in order to improve users perception about their surroundings. To make use of this system, a disaster scenario is built and the trainees are requested to perform some specific tasks that are usually difficult to perform under stress in the real world. Augmented reality system for earthquake disaster response -In [8], an augmented reality system for earthquake disaster response is described. This system uses augmented reality techniques to display additional information in the context of a disaster, more specifically earthquakes. Such information can be humans hidden by debris or simulations of damages. The whole system consists of a disaster management tool (DMT) made for experts on search and rescue (SAR), whose main goal is to find and rescue people trapped in the rubble of collapsed buildings. An AR system is part of the DMT and it was developed in order to enable SAR experts of different institutions, that have to work together, to communicate and ex-change information among each other. The virtual images overlays the real world and the result can be observed with a display or a helmet mounted retinal display.
Augmented reality for fire and emergency services -In [16], an aug-mented reality system for fire and emergency services is proposed. The system aims at improving the collaboration between different entities involved in a fire emergency and at providing a rapid flow of information across different devices used in this context. Through the aid of augmented reality, displayed on head mounted displays, certain locations can be target on a 3D map which can be seen by the operators. Field operators can also use augmented reality markers to mark relevant information, which is then accessible to all other entities involved in the operations. In addition, building plans can be loaded into the real environment, giving the user a better perception of the area. When the operation ends, the created
Methods to automatically filter information according to the needs of the user are suggested by some authors [5, 7]. These tech-niques needs to collect contextual information, such as the location of the user or the task being performed. After being processed, the contextual information allows to check which virtual objects should be presented, avoiding the display of non-relevant data.
Other studies have presented different approaches to display rel-evant information in mobile augmented reality systems [14]. The solution consisted of representing more relevant objects through warm colors and less relevant objects through cold colors. In ad-dition, the opacity of the objects was altered according to their degree of relevance to the user, with the most relevant objects being represented by higher opacity values.
Another method that seeks to make the information that is dis-played to the user more noticeable consists of aggregating objects that are at a very close viewing angle. This technique acts locally and prevents the concentration of objects in the same region, which can cause overlapping or confusion [3].
Mobile AR applications work with a limited angle, therefore, many objects are off-screen. To address this problem three tech-niques were introduced. Mini-maps are miniature maps, usually placed on the screen corner, that contain a two-dimensional refer-ential to place objects around the user location. Although accurate, some authors claim that they are difficult to interpret [12]. 3D Ar-rows, on the other hand, indicate the direction of off-screen objects via three-dimensional arrows. The size of the arrow is propor-tional to the distance the object is. However, this technique is only adequate when representing a few number of points of interest, otherwise it induces confusion. Sidebars technique provides two sidebars where off-screen objects can be displayed. The side where the objects are represented defines the shortest direction the user should rotate the device to find them [15].
3
APPLICATION DEVELOPMENT
The development of the prototype described in this paper followed a user-centered design methodology, involving an iterative design process with several design, implementation and evaluation cycles that help to improve the system’s quality, functionality and inter-face. Several meetings with representatives of the Navy also took place, where the requirements of the prototype were discussed. The diagram in figure 1 illustrates the development process.
In 3.1 the overall behavior of the current prototype is described, whereas in 3.2, the main contributions and techniques introduced in the scope of this work are mentioned. Subsection 3.3 exposes the technologies used in the development of the solution while subsec-tion 3.4 addresses the augmented reality techniques introduced.
Figure 1: Development process in the new prototype
3.1
Mobile Application Behavior
The developed mobile application is a tool for first responders ad-dressing emergency situations that allows them, as members of a specific operation team, to report and access information regarding different points of interest (POI), such as command centers or ad-vanced medical posts, and incidents that occur during emergency operations, which can be divided into four categories: person, in-frastructure, security and hazard. All the POI and incidents reported are associated with specific geographic coordinates. Furthermore, real-time information about each team operating on the ground, which includes their actual locations, is also provided through the application to all teams.
The information about each occurrence (POI, incidents and oper-ation teams) is centralized and shared between the different teams, allowing them to have a better perception of the environment in which they are inserted, optimizing their tasks.
In addition to the occurrences, the operating teams are also able to consult, through the application, the orders assigned to them.
POI and incidents are usually inserted by operation teams whose role is to make the site recognition (RECON), and the other teams, such as search and rescue (SAR) or rapid intervention teams (BIR), may rely on this collect data to perform their tasks and also edit it. Users, who are logged as members of a specific team, can access occurrences through search pages (Fig. 2 left) or a georeferenced view that makes use of a map (Fig. 2 center). To complement the two-dimensional map view, the user can use the augmented reality view (Fig. 2 right), which presents the events from a different perspective. Each object represented in the AR view may correspond to either an occurrence or a set of occurrences. Users can interact with the objects displayed in the AR view. Objects that represent multiple occurrences can be expanded so that each of the associated occur-rences is displayed. Objects that represent a single occurrence can be selected and so its detailed information is provided
In the AR view, the user has also several options available that allow to configure the way the data is displayed, so that the most important data for the user can be quickly and efficiently identified. The options introduced are discussed in more detail in section 3.4.
3.2
Contributions of The Developed Work
The definition of the system requirements, which were improved throughout the development process, in collaboration with the Navy representatives, contributed to the construction of a data model better suited to the needs of the project, or even to the implementation of a new interface and functionalities. One of the
Figure 2: Search page (left); Map view (center); AR view (right)
added requirements refers to the possibility of specifying what are the objectives (specific incidents or POI) of the orders that are assigned to the operation teams. In this way, it was easy to conclude that the occurrences do not always present the same relevance for each of the response teams.
The development of the new functional prototype, object of study of this article, was also based on the results obtained in the usability tests performed at the end of the development of the previous prototype [9], as well as those that resulted from the introductory usability tests conducted at the beginning of the development of this work, which also evaluated the old prototype and are mentioned in section 4. The conclusions drawn from these two evaluations to the previous prototype revealed the need to adjust its graphic interface in order to make it more attractive, clear and comfortable for the user, as well as making it responsive to devices of different dimensions. As far as the augmented reality is concerned, some difficulties were found in the proper visualization of the different occurrences, especially when these were concentrated in the same region. In these cases, occurrences appeared at different heights, often outside the user’s field of vision, or even overlapped with each other.
These are aspects that deserved special attention during the development of the application described in this paper.
3.3
Implementation Details
The application runs in Android operating system and it is now compatible with devices of different dimensions. The communica-tion with the remote server is ensured via HTTP requests.
New data insertion layouts took into account previous ergonomic studies carried out on the subject [6]. To reduce the learning process, the implemented insertion and query layouts are similar for all data types in the application.
The symbology adopted to represent the points of interest, inci-dents and teams resulted from the combination of symbols used in other emergency exercises, as well as other related proposals [10]. The Wikitude SDK was used to implement the augmented reality view in the application. The techniques introduced in the latest
Figure 3: Cluster of occurrences (top); Expanded cluster of occurrences (bottom)
version of the prototype have made use of the features supported by the Javascript API, which includes the possibility of creating location-based markers by using georeferenced data. These mark-ers are associated with geographic coordinates and represent the various points of interest, incidents and operation teams.
3.4
Augmented Reality Techniques Introduced
Although the results of the work developed consisted of the mod-eling of a new data structure and the introduction of new func-tionalities and a more suitable graphical interface, the main object of discussion and analysis of the present article concerns the opti-mizations and augmented reality techniques adopted in the most recent version of the functional prototype. These contributions are presented below.
3.4.1 Information Overlap.The previous prototype represented the augmented reality objects at different heights, according to the distance to the user. This solution contributed to reducing the probability of seeing objects overlapping in space, but often forced the user to rotate the device vertically to locate all objects. The new prototype implemented a solution that displays by default all objects on the horizon line, when the user positions the device perpendicularly to the ground.
neighboring regions are not grouped, although they may overlap. An alternative algorithm, which dynamically creates the space regions occupied by each cluster, aggregating all points that transi-tively occupy similar regions, was also implemented. This option avoids the assignment of objects that are in a similar viewing an-gle to different clusters, but, in the other hand, may lead to the formation of clusters associated with excessively wide regions.
Both approaches are available and the user can choose which one is best suited to the circumstances in which he is inserted. In both approaches, when the user selects the AR object that represents a particular cluster, it is expanded during ten seconds, regrouping after that period of time. Figure 3 shows a cluster before and after being expanded.
3.4.2 Information Filtering.While it may be an added value in most cases, automatic information filtering is not advisable in systems that provide assistance in emergency situations, as much as it is not desirable to omit information without the user being aware of its existence. Although first responders normally have their functions well defined in the operation, the remaining information should not be overlooked.
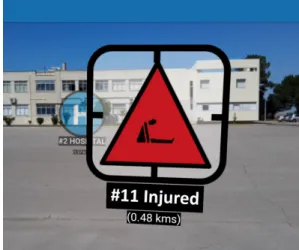
In the scope of this work, a visualization option was introduced that applies different levels of opacity to each occurence according to the relevance that it presents to the user. When this functionality is enabled, the objectives of the running orders always maintain the maximum opacity value, since they correspond to the user’s focus at that instant. The other occurrences present different levels of opacity, according to the type of operation team that is making use of the application. Search and rescue teams, for example, typically have people-related actions, so these occurrences have a higher opacity value than the remaining ones.
Figure 4 illustrates the application of different opacities in two occurrences. The injured person, unlike the hospital, coincide, in this example, with the objective of the running order and therefore maintains the maximum value of opacity.
3.4.3 Off-screen Information.From the analysis of all the off-screen techniques mentioned in the related work (2), table 1 has been constructed.
The first column of the table contains the techniques to be com-pared. The second column indicates the ease of integrating the technique into the existing prototype. The parameter in the third column refers to the possibility of differentiating points according to categories. The ease with which the user can identify the objects through the technique is represented in the values of the fourth column. In the last column it is mentioned the scalability that the technique presents for a high number of objects.
From the table results, it has been concluded that the techniques that best fit the current prototype are the mini-map and sidebars,
Figure 4: Different values of opacity in the AR view Table 1: Comparison between off-screen visualization tech-niques
Technique Integ. Categ. Ident. Scal.
Mini-map 3 2 2 3
3D Arrows 1 2 3 2
Sidebars 2 3 3 3
since it requires the usage of many points. Therefore, the prototype makes use of a radar which behaves in a manner equivalent to a mini-map.
The points that mark the different objects in the user’s vicinity have been designed with the formats and colors shared by the augmented reality symbols to become more easily distinguishable by the users, as can be seen in figure 3.
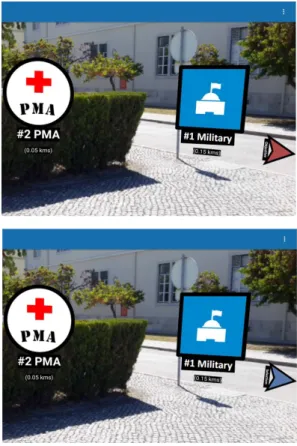
In addition, side indicators, which behave in a similar way to the sidebars, were used. This approach, supported by the Wikitude JS API, indicates in which direction the off-screen objects can be found. In the developed prototype, the side indicators are only triggered when an objective is off-screen, represented in red, or when an occurrence is selected, as described in 3.4.4, in which case a blue indicator is displayed. The purpose is to use this feature only when strictly necessary, in order to avoid excessive information or even confusion to the user. Figure 5 shows two examples where side indicators were triggered.
3.4.4 Object Selection. In the augmented reality view, users are allowed to select an occurrence, by clicking on it. When an oc-currence is selected, it becomes more salient, either through an increase in its dimensions or through the substitution of its icon for another that suggests its selection. In addition, when an object is selected, the blue side indicator is on, which indicates the direction in which the selected occurrence can be found when it is not visible within the boundaries of the screen, as described in the previous section (3.4.3).
Figure 5: Objective indicator (top); Selection indicator (bot-tom)
In addition to the above, a selected object that is initially part of a cluster does not regroup with the remaining objects after the established 10 seconds. Instead, it acquires a property that allows it to be represented in front of any augmented reality objects with which it overlaps.
Figure 6 shows an example in which the selected occurrence is displayed in front of another, with which it formed a cluster before the selection.
To remove the selection, the user can click on the selected ocur-rence again, or alternatively select another one, since only one object is allowed to be selected at a time.
4
USER EVALUATION
During the development of the mobile prototype, three assessments were carried out to evaluate the application usability and detect aspects to improve. In all of them, a scenario of use that simulates the occurrence of a disaster was set up. Tasks were outlined to be fulfilled by users with the help of the mobile application. The users were accompanied by a facilitator who noted the effectiveness in carrying out each task, as well as the difficulties to perform them. All users belong to the National Navy, representing potential future users of the developed prototype, and had previously partic-ipated in at least one emergency simulation exercise.
Figure 6: Occurrence selected in augmented reality view
4.1
Preliminary Evaluation
The first evaluation had an introductory nature and allowed to collect information about the behavior of the existing preliminary prototype. Three users, aged between 18 and 24 years, all males, experienced the application through three different mobile devices, and notes were drawn about the user experience which guided the redesign of the application and the optimization of the augmented reality techniques as it is described in this paper.
In addition to the problems reported by users regarding the graphical interface of the prototype, they also had difficulties in lo-cating the occurrences in the augmented reality view, as sometimes it was necessary to move the device vertically to locate them. At other times the occurrences even came to overlap with each other.
4.2
Intermediate and Final Evaluations
The last two assessments consisted of a more formal process and some written questionnaires were answered by the participants after performing the assigned tasks.
4.2.1 Methodology and Tasks Performed. In both intermediate and final evaluations, before the tests started, a brief explanation of the scenario and tasks to be performed was given to the users. Each test session was comprised by two different parts, each performed by one different user. In order to complete all the tasks (in a balanced way), each user participated in two distinct test sessions, playing different roles in each one of them. A test session starts with the intervention of a user which represents a recognition team (RECON) member. This kind of teams are mainly responsible for reporting events at the place where the operation takes place, and so, the tasks requested to this user served essentially the purpose of testing the insertion/editing of data (points of interest and incidents) in the application, as well as checking the usability of the application and the usefulness it presents in recognition operations.
The second part of a test session was performed by a user play-ing the role of a search and rescue team (SAR) member. This user was requested to search for points of interest and incidents previ-ously entered by the recognition team member. In addition, they were asked to find this same information in the map and AR view.
Figure 7: Participant performing an user test
These two visualization options were also used to assist the user in navigating to these points on the ground.
Figure 7 shows a participant performing the user tests. During the test sessions, users were encouraged to think aloud, sharing their feelings and thoughts.
4.2.2 Intermediate Evaluation.For this evaluation, five elements of the navy, aged between 19 and 24 (mean: 20.2, SD: 1.94), all male and with experience in emergency simulation exercises, participated in the user tests. The device used was a Sony Xperia G3221.
At the end of the test sessions, the participants answered two questionnaires to assess the experience of using the application. One uses the System Usability Scale (SUS) [2], which is a very easy scale to administer to participants in order to measure the usabil-ity, while the other is the standard User Experience Questionnaire (UEQ) [4], which measures the user experience of interactive prod-ucts. Furthermore, a few questions were asked specifically to get the participants opinion about the main features of the application. Both SUS and additional questions were based on a Likert scale, ranging from 1 (totally disagree) and 5 (totally agree).
The tasks performed in the augmented reality view consisted mainly in the identification of occurrences, which also included their identification through the existing radar. Participants were also asked to identify clusters of objects, attempting to test the ease with which they manipulated and accessed their content. The features related to the selection of an occurrence, the side indicators and the differentiation of opacity values (according to the relevance of the occurrence) had not yet been implemented at the time of this evaluation. Therefore they were not tested at this stage.
On a Likert-scale of 1 to 5, with 5 being the best score, the average response rate was 4.0 when users were asked how easy it was to operate the augmented reality view and 4.2 when they rated the statement "Augmented reality view is a valuable complement to the map view".
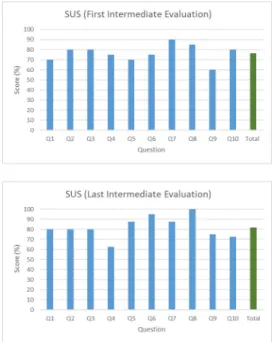
Figure 8: SUS results obtained in the intermediate evaluation (top); SUS results obtained in the final evaluation (bottom)
Regarding the clustering of concentrated points, two partici-pants commented that the expanded points should not necessarily regroup after a few seconds unless it is explicitly requested by the users.
The average score obtained in the SUS questionnaires was 76.5, which is good, but susceptible to improvements, while the UEQ questionnaires results were also positive, as shown in figures 8 (top) and 9 (top).
After these usability tests, new augmented reality techniques were introduced, namely the selection of an occurrence, the side indicators and the differentiation of opacity values, as well as some adjustments in the interface and overall application behavior. 4.2.3 Final Evaluation.For the final usability tests, which took place two months after the previous ones, ten participants (nine male and one female), between the ages of 19 and 24 (mean: 20.5, SD: 1.57), carried out the tasks proposed and answered the question-naires. SUS and UEQ were considered once again and the additional questionnaire included more questions than those covered in the intermediate evaluation. The device used was a tablet Samsung Galaxy Note 10.1 2014 Edition.
All of the AR techniques mentioned in 3.4 were tested and no user had difficulty in completing the proposed tasks.
The score obtained in the SUS questionnaire was 82%, which is an improvement of 5.5% when compared to the results obtained previously.
As can be seen in figure 8 (bottom), question "Q8" ("I found the system very cumbersome to use"), which follows an inverted logic, obtained the maximum score of 100%, whilst "Q6" ("I thought there was too much inconsistency in this system") also surpassed 90%, which indicates that the application is not cumbersome and it is consistent. In contrast, although questions "Q4" ("I think that
Figure 9: UEQ results obtained in the intermediate evalua-tion (top); UEQ results obtained in the final evaluaevalua-tion (bot-tom)
I would need the support of a technical person to be able to use this system") and "Q10" ("I needed to learn a lot of things before I could get going with this system") also obtained positive scores, they reached weaker outcomes than those previously obtained. This may indicate that the addition of new features led some users to think that it would be useful to obtain training before using the mobile application in real emergency situations.
Regarding the UEQ questionnaire, overall results also improved, as shown in figure 9.
The optimization and introduction of new AR techniques may have contributed to the enhancement of "Stimulation" and "Effi-ciency", whereas the interface and overall application behavior adjustments led to improvements on "Dependability".
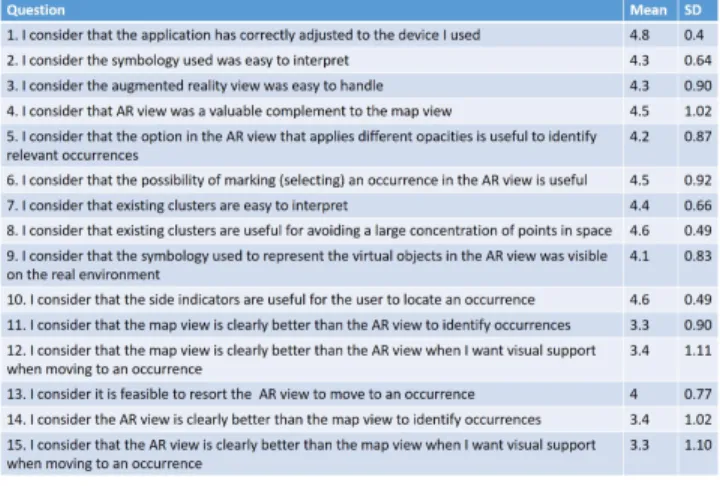
In addition to the first four questions, which were also answered in the intermediate evaluation, 11 new questions were added, fo-cusing mostly on the experience of use of the AR view. All of them are mentioned in figure 10.
All the answers to questions related to the implemented AR tech-niques obtained an average score higher than 4 and were better when compared with those obtained in the intermediate usabil-ity tests (regarding AR only questions "3" and "4" were asked in both evaluations). Thus, it can be concluded that these techniques are viable options to solve the problem based on the difficulty of organizing the flow of data displayed in augmented reality envi-ronments. In particular, the side indicators and the clusters were the techniques that presented better outcomes. Regarding the tech-nique that applies different opacities to occurrences, according to their relevance, quite positive results were also obtained. One of the participants suggested that, in addition to this technique, most relevant occurrences could also blink.
Figure 10: Results of additional questions in the final evalu-ation
The comparison between the two implemented clustering op-tions comes from the declared preference of the users after using the two aggregation techniques to perform the tasks. The behavior of those aggregation algorithms is dependent on the exact location where the occurrences are introduced and where the user is. Small changes between each of the test sessions are sufficient for the algorithm to calculate the clusters in a different way. As such, the results obtained by the various usability tests were not homoge-neous. In 40% of the cases, the participants did not observe any difference when they changed the aggregation algorithm, whereas of the remaining 60%, 2/3 preferred the alternative algorithm, to avoid more effectively overlapping data in neighborhood areas, while the other 1/3 preferred the Wikitude algorithm, because it does not excessively aggregate objects. These data are enough to get a trend but not to draw conclusions.
When comparing which of the viewing options (map view or AR view) is more efficient, both in identifying and navigating to occurrences, opinions are also not unanimous, as can be seen from the answers provided to questions "11","12","14" and "15" of the additional questionnaire. Some participants find the map view more suitable, while others feel more comfortable when using the AR view. The standard deviation obtained in these questions reinforces the idea that there was some division in the opinions of the users. One participant commented that he preferred the map view if he was in a location he knew well, while in an unknown location the view of AR might be more advantageous.
5
CONCLUSIONS AND FUTURE WORK
This paper presented the development process of a mobile applica-tion that assists first responders in emergency situaapplica-tions, highlight-ing the augmented reality techniques that were implemented.
The aim of this work was to develop a tool which facilitates the report of data in these contexts, such as points of interest and incidents, as well as provide a way of communication between the agents present in those operations. The prototype uses an in-teractive map where the occurrences are displayed and also an
this matter.
It is also foreseen to integrate the mobile application with the central system in order to provide interoperability between systems and allow the communication between all the actors in the ground and the decision makers in the command center.
It would also be interesting to develop a tool that focused on the time spent performing each task and on the number of clicks needed to complete each one, introducing optimizations at this level.
ACKNOWLEDGMENTS
This work is funded by FCT/MCTES PEstUID/CEC/04516/2019 NOVA LINCS, the Portuguese Ministry of Defense, and the Por-tuguese Navy.
REFERENCES
[1] Ronald T Azuma. 1997. A survey of augmented reality. Presence: Teleoperators & Virtual Environments6, 4 (1997), 355–385.
[2] John Brooke. 1996. SUS-A quick and dirty usability scale. Usability evaluation in industry189, 194 (1996), 4–7.
[3] Maria Beatriz Carmo, Ana Paula Afonso, António Ferreira, Ana Paula Cláudio, and Gonçalo Silva. 2016. PoI Awareness, Relevance and Aggregation for Augmented Reality. In Information Visualisation (IV), 2016 20th International Conference. IEEE, 300–305.
[4] Manuel Pérez Cota, Jörg Thomaschewski, Martin Schrepp, and Ramiro Gonçalves. 2014. Efficient measurement of the user experience. Procedia Computer Science 27 (2014), 491–498.
[5] Steven Feiner, Blair Macintyre, and Dorée Seligmann. 1993. Knowledge-based augmented reality. Commun. ACM 36, 7 (1993), 53–62.
[6] Diogo Figueiredo. To publish. Applying the User-Centered Design approach for Pro-totyping the Interfaces of an Intelligent Emergency Management System. Master’s thesis.
[7] Simon Julier, Yohan Baillot, Dennis Brown, and Marco Lanzagorta. 2002. In-formation filtering for mobile augmented reality. IEEE Computer Graphics and Applications22, 5 (2002), 12–15.
[8] Johannes Leebmann. 2004. An Augmented Reality System for Earthquake Disaster Response. International Archives of the Photogrammetry, Remote Sensing and Spatial Information Sciences34 (2004).
[9] Raquel Lucas. 2017. Realidade Aumentada para Emergências. Master’s thesis. [10] Silvia T Marinova. 2018. New Map Symbol System for Disaster Management.
Proceedings of the ICA1 (2018), 74.
[11] Isabel L Nunes, Raquel Lucas, Mário Simões-Marques, and Nuno Correia. 2017. Augmented Reality in Support of Disaster Response. In International Conference on Applied Human Factors and Ergonomics. Springer, 155–167.
[12] Torben Schinke, Niels Henze, and Susanne Boll. 2010. Visualization of off-screen objects in mobile augmented reality. In Proceedings of the 12th international conference on Human computer interaction with mobile devices and services. ACM, 313–316.
[13] Monica Sebillo, Giuliana Vitiello, Luca Paolino, and Athula Ginige. 2016. Training emergency responders through augmented reality mobile interfaces. Multimedia Tools and Applications75, 16 (2016), 9609–9622.
[14] Gonçalo Silva, Maria Beatriz Carmo, Ana Paula Afonso, Ana Paula Cláudio, and António Ferreira. 2015. Visualização de Objetos Off-Screen em Realidade Aumentada Móvel. 22o Encontro Português de Computação Gráfica e Interação, Coimbra(2015).
[15] Teresa Siu and Valeria Herskovic. 2013. SidebARs: improving awareness of off-screen elements in mobile augmented reality. In Proceedings of the 2013 Chilean Conference on Human-Computer Interaction. ACM, 36–41.
[16] Aameer R Wani, Sofi Shabir, and Roohie Naaz. 2013. Augmented reality for fire and emergency services. In Int. Conf. on Recent Trends in Communication and Computer Networks, Byderabad India.
[17] Feifei Xu, Feng Tian, Dimitrios Buhalis, Jessika Weber, and Hongmei Zhang. 2016. Tourists as mobile gamers: Gamification for tourism marketing. Journal of Travel & Tourism Marketing33, 8 (2016), 1124–1142.