Equity Valuation
Carlsberg A/S
Karina Theresia Arnold
Dissertation written under the supervision of
Professor José Carlos Tudela Martins
Dissertation submitted in partial fulfilment of requirements for the MSc in Finance, at the
Universidade Católica Portuguesa, 07.06.2019
i
Carlsberg A/S
Key Financial Data
600 700 800 900 1000 1100 29 .1 2. 20 17 28 .0 2. 20 18 30 .0 4. 20 18 30 .0 6. 20 18 31 .0 8. 20 18 31 .1 0. 20 18 31 .1 2. 20 18 28 .0 2. 20 19 30 .0 4. 20 19
Stock Price Performance
Carlsberg OMXC20 Price Index
WACC Computation Risk-free rate 0.236% Beta 0.84 ERP 8.84% Cost of Equity 7.68% Cost of Debt 1.62% Tax rate 27% E/V 81.39% D/V 18.61% WACC 6.47%
S
H
B
Sell
Hold
BuyDownside risks after share buy-back
In course of the new strategy Carlsberg also announced a share buy-back program of DKK 4.5bn, which boosts the earnings per share. Further, Carlsberg increased its dividends by 100% since 2014 and reduced its costs. However, to sustain this performance additional investments are required and also macroeconomic conditions remain difficult in the main markets. The DCF valuation resulted in a target price of DKK 826.51, with an upside potential of 4%, reflecting the challenges in the next years. Thus, a hold recommendation is given. Successful transformation strategy and greatly improved growth Since the launch of the new strategy in 2016, Carlsberg strengthened its brand performance, optimised efficiency and improved its operational performance. This is also reflected in the strong financial results in 2018. Improvements in the EBITDA and net profit were mainly driven by cost savings and increased sales in Asia. Revenues increased by 2.9% from 2017 to 2018. Further, the cash flows of Carlsberg were driven by lower depreciations and working capital as in the last three years Carlsberg reduced its cash conversion cycle by extending the days payables outstanding.
Focus on premiumisation and expanding in emerging markets In recent years Carlsberg focused on premiumisation, driving growth and leader positions in emerging markets. The achieved revenue growth was boosted by sales in the Asian market. The beer market in Europe is highly saturated. In addition, government regulations and shifts in consumer behaviours towards healthy lifestyles make it difficult for Carlsberg to gain further market share in the near future. Carlsberg’s focus on fast-growing and high-end segments, especially in the Asian market offer new opportunities that are mainly driven by premiumisation and the focus on craft, speciality and low-and non-alcoholic beverages.
in DKK Million 2016 2017 2018 2019E 2020E 2021E
Sales 62,614 60,655 62,503 64,341 66,279 68,082 EBITDA 13,006 13,583 13,420 13,600 14,046 14,801 margin% 20.8% 22.4% 21.5% 21.1% 21.2% 21.7% EBIT 8,245 8,876 9,329 9,197 9,510 10,142 margin% 13.2% 14.6% 14.9% 14.3% 14.3% 14.9% Net Profit 4,486 1,259 5,309 5,750 5,582 5,989 margin% 7.2% 2.1% 8.5% 8.9% 8.4% 8.8% EPS (DKK) 29.4 8.3 34.8 37.7 36.6 39.3 ROE 8.4% 2.8% 11.1% 12.5% 12.1% 12.7% Sales Growth -4.2% -3.1% 3.0% 2.9% 3.0% 2.7% EV/EBITDA (x) 11.3 10.8 11.0 10.8 10.5 9.9 EV/EBIT (x) 17.8 16.6 15.8 16.0 15.5 14.5 Debt/Equity 56.3% 48.8% 50.1% 57.5% 62.0% 62.0% NIBD/EBITDA 2.05 1.53 1.37 1.83 1.91 1.88 Close date 28.02.2019 Share price (DKK) 794.6 Target Price 826.5 Upside 4.0% Market Cap (DKKm) 104,899 Enterprise Value (DKKm) 147,074 52 Week High (DKK) 894.8 52 Week Low (DKK) 682.8 Reuters CARLb.CO Bloomberg CARLB.DC
ii In order to obtain the target share price of Carlsberg the WACC-based DCF approach was selected. The DCF methodology is based on assumptions and forecasts reflecting the expected future market developments. The appropriate WACC for discounting the FCFF and the Terminal Value amounts to 6.47%. After the explicit period a perpetual growth rate of 1.2% is assumed.
Relative Valuation
To verify the results obtained through the DCF valuation, a relative valuation using forward multiples was performed. The peer group contains the following five comparable companies: AB InBev, Heineken N.V., Molson Coors Brewing Company and Asahi Group Holdings Ltd. The obtained target prices are slightly different from the DCF valuation results.
Relative Valuation EV/EBITDA EV/EBIT EV/Sales PER P/Sales
Multiple (harmonic mean) 10.5 14.5 2.3 15.4 1.5
Enterprise Value 141,231.40 135,080.88 146,814.21 81,516.47 95,488.60
Share Price 788.22 747.90 824.81 534.32 625.91
FCFF 2019E 2020E 2021E 2022E 2023E 2024E 2025E 2026E 2027E 2028E
EBIT 9,197 9,510 10,142 10,422 10,664 11,201 11,504 11,736 11,953 12,139 - Taxes on EBIT 2,483 2,568 2,738 2,814 2,879 3,024 3,106 3,169 3,227 3,277
NOPLAT 6,714 6,942 7,403 7,608 7,785 8,177 8,398 8,567 8,726 8,861
+ Depreciation 3,788 3,902 4,008 4,110 4,198 4,289 4,376 4,458 4,535 4,607
+ Amortisation 550 567 582 597 610 623 636 648 659 669
- Impairment PPE and IA 65 67 69 71 72 74 75 77 78 79
- ∆ Operating WC 478 -442 -411 -402 -349 -361 -407 -351 -329 -306 - Capital Expenditures 4,517 4,653 4,779 4,901 5,005 5,115 5,218 5,316 5,408 5,494
FCFF 5,991 7,133 7,556 7,745 7,864 8,261 8,523 8,631 8,763 8,870
PV FCFF 5,627 6,293 6,261 6,027 5,748 5,671 5,495 5,227 4,984 4,739
Total PV FCFF 56,072
Perpetual growth rate 1.20%
Terminal Value 170,340
PV Terminal Value 91,002
Total Enterprise Value 147,074
- net Debt 18,394
- Non-Controlling Interests 2,587
Equity Value 126,093
Shares Outstanding 152.56
iii
Abstract
In this dissertation, the share price of Carlsberg A/S, as of 28th February 2019, was examined
to identify whether it is under- or overvalued or properly priced. First, the different valuation models were investigated, concluding that a WACC-based DCF valuation is the most suitable approach to obtain the fair value of Carlsberg. Supplementary, a relative valuation was performed to verify the DCF results. It was found that through the implementation of a new strategy, Carlsberg is able to adapt to challenges in the industry and to preserve its market position. The main valuation methodology returned a target price of DKK 826.5. The similarity to the market price of DKK 794.6 at the valuation date resulted in a hold recommendation for Carlsberg’s stock. To assess the effect of the key valuation input such as WACC and the perpetuity growth rate on the share price, the performed sensitivity showed that even small changes cause significant changes in the share price. Lastly, the valuation results were compared with the equity research report of ODDO BHF. Despite different assumptions and valuation parameters the target prices are fairly similar.
Title: Equity Valuation – Carlsberg A/S Author: Karina Theresia Arnold
Keywords: Beer Industry, Brewing Industry, Beverage Industry, Equity Research, Firm Valuation, Carlsberg A/S
iv
Resumo
Nesta dissertação, o preço das ações da Carlsberg A/S, à data de 28 de fevereiro de 2019, foi examinado para identificar se este está sub- ou sobreavaliado ou se tem um preço adequado. Em primeiro lugar, foram investigados os diferentes modelos de avaliação, tendo-se concluído que uma avaliação DCF baseada no WACC é a abordagem mais adequada para obter o valor justo da Carlsberg. Complementarmente, foi realizada uma avaliação relativa para verificar os resultados do DCF. Verificou-se que, através da aplicação de uma nova estratégia, a Carlsberg é capaz de se adaptar aos desafios do setor e de preservar a sua posição no mercado. A principal metodologia de avaliação revelou um preço-objetivo de DKK 826,5. A semelhança com o preço de mercado de DKK 794,6 na data da avaliação resultou numa recomendação de detenção das ações da Carlsberg. Para avaliar o efeito do fator-chave de avaliação como o WACC e a taxa de crescimento da perpetuidade sobre o preço das ações, a análise de sensibilidade realizada mostrou que mesmo pequenas alterações provocam alterações significativas no preço das ações. Por fim, os resultados da avaliação foram comparados com o relatório de equity research da ODDO BHF. Apesar dos diferentes pressupostos e parâmetros de avaliação, os preços-alvo são bastante semelhantes.
Título: Equity Valuation – Carlsberg A/S Autor: Karina Theresia Arnold
Palavras-chave: Indústria da cerveja, Indústria das bebidas, Relatório de Pesquisa, Avaliação de Empresas, Carlsberg A/S
v
Acknowledgement
The completion of this dissertation not only marks the end of my Master’s degree, it is also the end of an important stage in my life. I am grateful and curious to start a new chapter with lots of opportunities and remarkable experiences.
Along the path of completing my degree and my dissertation I faced several challenges, that would not be possible to overcome with the support of some important people I would like to thank.
First, I would like to thank my advisor, Professor José Carlos Tudela Martins, for his availability, support and guidance throughout this process, which was crucial for the completion of this dissertation.
Second, I want to express my gratitude to my family, who continuously supported me during my whole life and without them, this and my other milestones I achieved would not have been possible.
Finally, I would like to thank my dearest friends, who accompanied me during this time thru giving constructive inputs and suggestions as well as personal support along all the way.
vi
Table of Contents
1 INTRODUCTION ... 1 2 LITERATURE REVIEW ... 2 2.1 INTRODUCTION TO VALUATION ... 2 2.2 VALUATION MODELS ... 32.2.1 Discounted Cash Flow ... 3
2.2.1.1 Free Cash Flow to the Firm ... 4
2.2.1.2 Dividend Discount Model ... 4
2.2.1.3 Free Cash Flow to Equity ... 5
2.2.1.4 Adjusted Present Value (APV) ... 5
2.2.1.5 Economic Value Added (EVA) ... 6
2.2.2 Input Factors for DCF Valuation ... 7
2.2.3 Valuation in Emerging Markets ... 11
2.2.4 Relative Valuation ... 12 2.2.4.1 Peers ... 12 2.2.4.2 Multiples ... 12 2.2.4.3 Limitations ... 13 2.3 FINAL CONSIDERATIONS ... 14 3 STRATEGIC ANALYSIS ... 15 3.1 INDUSTRY ANALYSIS ... 15 3.1.1 Beer Industry ... 15
3.1.2 Porter’s five forces ... 17
3.2 COMPANY OVERVIEW ... 20
3.2.1 Key Facts about Carlsberg ... 20
3.2.2 Ownership Structure ... 21
3.2.3 Brands ... 22
3.2.4 Markets ... 23
3.2.5 Company Strategy and Business Model ... 24
3.2.6 SWOT Analysis ... 24
4 FINANCIAL ANALYSIS ... 25
vii
4.2 EBIT,EBITDA AND NET INCOME ... 25
4.3 WORKING CAPITAL,CAPITAL EXPENDITURES AND D&A ... 26
4.4 RATIO ANALYSIS ... 26
5 VALUATION ... 27
5.1 DISCOUNTED CASH FLOW VALUATION ... 27
5.1.1 Forecasts ... 27
5.1.1.1 Revenue Forecast ... 27
5.1.1.2 Special Items ... 31
5.1.1.3 Operating Expenses ... 31
5.1.1.4 Capital Expenditures ... 33
5.1.1.5 Depreciation and Amortisation ... 34
5.1.1.6 EBIT and EBITDA ... 35
5.1.1.7 Working Capital ... 35
5.1.1.8 Tax Rate ... 37
5.1.1.9 Financial Statement Forecast... 38
5.1.2 Weighted Average Cost of Capital ... 38
5.1.2.1 Cost of Equity ... 38
5.1.2.2 Cost of Debt ... 39
5.1.2.3 Target Capital Structure ... 40
5.1.3 Target Price of DCF Valuation ... 41
5.2 SENSITIVITY ANALYSIS ... 43
5.3 RELATIVE VALUATION ... 44
5.3.1 Peer Group ... 44
5.3.2 Multiples ... 45
6 EQUITY REPORT COMPARISON ... 47
7 CONCLUSION ... 50
8 APPENDICES ... 51
viii
List of Figures
Figure 1: Segmentation Global Beer and Cider Market 2017 ... 15
Figure 2: CAGR Beer Consumption 2011 - 2016 ... 16
Figure 3: Revenue of Beer Worldwide in Billion US$ ... 16
Figure 4: Global Beer Growth by Price Segment, CAGR 1999 – 2017 ... 17
Figure 5: Global Beer and Cider Market Share, 2017 ... 17
Figure 6: Price Elasticity Alcoholic Drinks, Developed / Emerging Countries, 2014 ... 19
Figure 8: Porter’s Five Forces – Global Brewing Industry ... 20
Figure 9: Distribution of A and B shares, Free float vs. Carlsberg Foundation ... 21
Figure 10: Share Price Evolution Carlsberg vs. OMXC20 Index Price, 2014 – 2019 ... 21
Figure 11: Ownership Structure Carlsberg S/A ... 22
Figure 12: Percentage of Net Revenue from Brand Type by Region ... 22
Figure 13: Global Presence of Carlsberg ... 23
Figure 14: Segmentation of Revenue by Region 2014 – 2018... 25
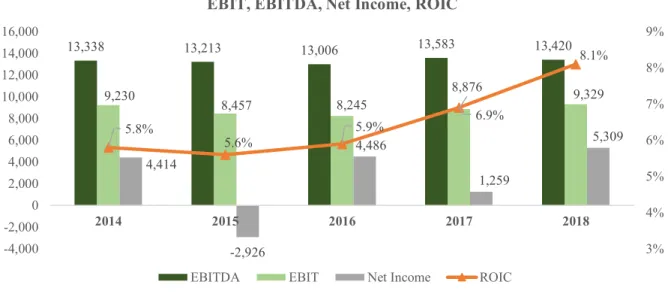
Figure 15: EBIT, EBITDA, Net income, ROIC; 2014 - 2018 ... 26
Figure 16: WC, CapEx, D&A; 2014 - 2018 ... 26
Figure 17: Forecasted Revenue segmented by Region; Growth Rates total Revenue ... 31
Figure 18: CapEx and D&A ... 34
Figure 19: EBIT and EBITDA ... 35
Figure 20: Debt Structure of Carlsberg in 2018 ... 39
Figure 21: Capital Structure Carlsberg 2014 – 2018; Source: Thomson Reuters Eikon ... 40
Figure 22: Comparison possible Peers regarding different Characteristics ... 44
Figure 23: Comparing Valuation Results via a Football Field ... 46
Figure 24: Revenue Comparison ... 47
Figure 25: Comparison EBIT and EBIT Margin... 48
Figure 26: FCFF Comparison ... 48
ix
List of Tables
Table 1: Key Facts Western Europe, Eastern Europe and Asia ... 23
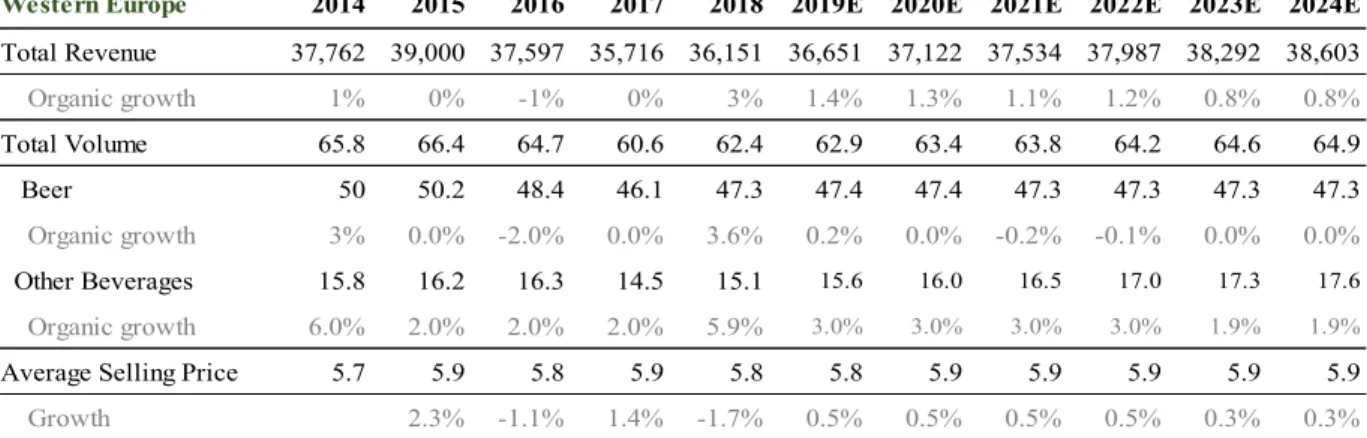
Table 2: Summary Total Revenue Forecast in Western Europe, 2014 – 2024 ... 29
Table 3: Summary Total Revenue Forecast in Eastern Europe, 2014 – 2024 ... 29
Table 4: Summary Total Revenue Forecast in Asia, 2014 – 2024 ... 30
Table 5: Forecasts Cost of Sales ... 32
Table 6: Forecast Other Expenses ... 33
Table 7: Forecasts Capital Expenditures ... 33
Table 8: Forecast PPE, IA, D&A ... 35
Table 9: Summary Working Capital ... 37
Table 10: Summary of the WACC Computation ... 38
Table 11: Inputs for the Computation of the cost of Equity ... 39
Table 12: Issued Bonds ... 39
Table 13: Computation after-tax cost of Debt ... 40
Table 14: Market Value of Debt and Equity ... 41
Table 15: FCFF Computation ... 41
Table 16: Target Price Computation ... 42
Table 17: Sensitivity Analysis ... 43
Table 18: Peer Group achieved through a Cluster Analysis ... 45
Table 19: Relative Valuation using Enterprise and Price Multiples ... 45
x
Appendices
Appendix 1: Interest Tax Shield and Expected Bankruptcy Costs ... 51
Appendix 2: Liquidation and Accounting Valuation ... 52
Appendix 3: Contingent Claim Valuation ... 53
Appendix 4: History of Carlsberg ... 54
Appendix 5: Share Classes of Carlsberg ... 55
Appendix 6: Operating Markets of Carlsberg ... 55
Appendix 7: SWOT Analysis ... 56
Appendix 8: Segmentation of Volume by Region ... 57
Appendix 9: Ratio Analysis ... 58
Appendix 10: Revenue Forecast by Region and Total Revenue Forecast ... 59
Appendix 11: Average Number of Employees ... 60
Appendix 12: Forecast Capital Expenditures ... 60
Appendix 13: Working Capital ... 61
Appendix 14: Rearranged and forecasted Income Statement ... 62
Appendix 15: Forecasted Balance Sheet ... 63
Appendix 16: Equity Risk Premium by Region ... 66
Appendix 17: Equity Report Comparison ... 67
1
1 Introduction
The purpose of this dissertation is to determine the fair value of Carlsberg’s stock as of 28th
February 2019. The analysis performed in the next chapters aims at identifying if the current share price of Carlsberg is under- or overvalued or properly priced. Based on the performed valuation an investment recommendation is given related to the difference between the intrinsic valuation and the current share price.
The dissertation is divided into five parts. First, a literature review is conducted, illustrating the state-of-art of the current valuation literature. Different approaches are presented and evaluated regarding the suitability for the valuation of Carlsberg. Next, a detailed strategic analysis is performed capturing the beer industry including the competitive forces that Carlsberg faces. Further, the past financial performance is investigated in order to assess the future prospects of the company.
Chapter four, explains the estimates and assumptions on which the intrinsic WACC-based DCF approach is based. A sensitivity analysis is conducted to consider the effects of changes in key parameters on the target price. Further, this section contains a relative valuation to verify the results of the DCF methodology. Finally, the results of the intrinsic valuation are compared to the ones of an equity research report of ODDO BHF.
2
2 Literature Review
The literature review in this section elaborates the state-of-art of the equity valuation literature and evaluates these approaches regarding the suitability for the valuation of Carlsberg.
2.1 Introduction to Valuation
“Valuation can be considered as the heart of finance” (Damodaran, 2006, p. 694) as every sensible decision in making business requires an understanding about what drives the firm value and how this value is estimated. Valuation determines the value of an asset, a business line, or a company. If a company is bought, sold or liquidated its value is estimated, but even for the determination of market efficiency, concerns about corporate governance or decisions between different investments, value estimates are useful to “identify sources of economic value creation and destruction within the company” (Damodaran, 2006; Fernández, 2007, p. 2).
Although, the goal of every valuation is to determine the fair market value, there are several ways to obtain this value, which in the end might result in different valuation outcomes. The most common valuation models rely on the determination of the intrinsic value through the discounted cash flow or the comparison of the firm with comparable market peers using multiples (Holthausen & Zmijewski, 2012).
All of the different valuation models are based on assumptions, different perspectives of analysts and certain market, industry or company specific circumstances that influence the forecasts and valuation estimates (Penman, 2006). Moreover, valuations are often biased by the collected information, already existing market prices or accounting distortions resulting from accounting flexibility (Damodaran, 2006).
3
2.2 Valuation Models
The first step in estimating the value of a company is to decide on the appropriate valuation model. There are various valuation techniques that require a critical assessment in order to determine the best model for the respective valuation.
According to Damodaran (2006) the different valuation models can be classified into four categories:
1. Discounted Cashflow Models
2. Liquidation and Accounting Valuation 3. Relative Valuation
4. Contingent Claim Models
In the following, each of the approaches is considered and shortly elaborated.
2.2.1 Discounted Cash Flow
Among practitioners and academics the discounted cash flow (DCF) is the standard valuation method (Koller, Goedhart, & Wessels, 2010). The value of the company equals the present value of its estimated future cash flows discounted at an appropriate discount rate that incorporate the cash flow’s risks (Fernández, 2007; Luehrman, 1997).
Every cash flow discounting model is based on the following equation:
V
0= ∑ E(CFt) (1+r)t n t=1 + TVn (1+r)n[1]
Where:V0 = Value of asset at time 0 | E(CFt) = expected future cash flow at time t
n = number of cash flows | r = discount rate | TV = Terminal Value
The DCF is a forward-looking valuation method and historical data solely influences the forecast assumptions. This implies, that the accuracy of this approach dependents on precise assumptions, the discount rate and the terminal value (Fernández, 2007).
The cash flows and the discount rate in equitation [1] vary depending on the assets being valued. The main variants of the discounted cash flow model are the free cash flow to the firm, the free
4 cash flow to equity, the dividend discount Model and the adjusted present value approach (Damodaran, 2006).
2.2.1.1 Free Cash Flow to the Firm
The most common approach in the DCF valuation, is the determination of the enterprise value (EV) through the free cash flow to the firm. This free cash flow “reflects the value of all claims on the firm” (Damodaran, 2006, p. 696) and is the cash flow available for the distribution to creditors and shareholder (Palepu et al., 2016).
To obtain the EV, equation [1] is adapted for the FCFF and the WACC as appropriate discount rate. Firm Value = ∑ FCFFt (1+WACC)t n t=1 + TVn (1+WACC)n
[2]
The FCFF is defined as follows:
FCFF = EBIT * (1-Tax) – Capital expenditures + Depreciation – ∆Working capital [3] An alternative way to obtain the FCFF is to reverse the calculation of the free cash flow to equity. The payments to the debtholders and preferred stockholders are added to the FCFE, resulting in the FCFF.
FCFF = FCFE + Interest Expense * (1 – Tax rate) + Principal Payment [4] – New Dept issues + Preferred dividends
2.2.1.2 Dividend Discount Model
The Dividend Discount Model (DDM) is the oldest variant of the discounted cash flow model (Damodaran, 2006) and focuses on the valuation of equity using future dividends. According to Fernández (2007) the dividends are part of the earnings that are paid to the shareholders and the share’s value is the present value of the expected future dividends discounted at the required return on equity.
Equity Value = ∑ E(DPSt)
Ke t=∞
t=1 [5]
In the case, the future dividend is expected to grow, the basic DDM model is extended by a constant annual growth rate (Fernández, 2007):
5 Equity Value =DPS1
Ke−g [6]
In practice, the DDM is seldomly used as the value estimates are too conservative and dividends do not display the value creation in a company (Miller & Modigliani, 1961). Due to the flaws of this Model, it is not used to estimate the value of Carlsberg.
2.2.1.3 Free Cash Flow to Equity
Another approach of directly valuing the equity of a company is to discount the FCFE at the cost of equity (Ke). Since, the discount rate represents the risks associated with the cash flow,
the Ke is the required return of investors for holding a stake of equity in the company (Koller et
al., 2010). The FCFE follows the underlying principle of the DCF calculation and thus, equation [1] can be reformulated as followed:
Equity Value = ∑FCFEt
(1+Ke)+ TVn
(1+Ke)n [7]
The FCFE is the cash flow after reinvestments and debt payments that is available to the distribution among shareholders. Formally, it is calculated as followed (Damodaran, 2006):
FCFE = Net income – CapEx + Depreciation – ∆ Non-Cash Working Capital
+ (New Debt issued – Debt Repayment) [8] – (Preferred Dividend + New Preferred Stock Issue)
Another starting point to compute the FCFE is to derive it from the previously explained FCFF: FCFE = FCFF – Interest * (1 – taxes) + ∆ Debt [9]
2.2.1.4 Adjusted Present Value (APV)
The APV model, first developed by Myers (1994) is based on the theory of Modigliani and Miller arguing that the choice of financial structure in a world without taxes does not affect the value of the assts (Koller et al., 2010). The APV separates the company’s financing and investing activities by applying a concept of value additivity (Luehrman, 1997).
According to Damodaran (2006), the APV approach is calculated by adding the value of the financial side effects to the value of the operations of an all equity financed firm:
6 Value of business = Value of business with 100% equity financing
+ PV Interest Tax Shield [10] - Expected bankruptcy costs
Compared to the WACC-based DCF models the APV is more versatile, flexible and reliable as it does not depend on a constant debt-to-value ratio and it requires less restrictive assumptions. Further, the APV enables to value companies with complex tax positions, changing capital structures or cross-border budgeting problems (Luehrman, 1997).
However, Damodaran (2006) also states that there are discrepancies among researches how to calculate the present value of interest tax shields. Moreover, some analysts overestimate the value of the business by ignoring the expected bankruptcy costs that are often difficult to estimate. In the case the company has a constant debt-to-value ratio the WACC-based DCF approach is simpler and more suitable method. The ITS and expected bankruptcy costs are further explained in Appendix 1.
2.2.1.5 Economic Value Added (EVA)
The EVA is based on the concept of NPV and capital budgeting, assessing profit maximization and shareholder wealth (Young, 1997). It estimates the value of a company “as a function of expected excess returns” (Damodaran, 2006, p. 732) by measuring the “difference between the return on a company’s capital and the cost of that capital” (Young, 1997, p. 335).
The EVA is calculated in the following way:
EVA = (Return on capital invested – Cost of capital) * (Capital invested) [11] = NOPLAT – (Cost of capital * Capital invested)
To compute the company’s value, the value of the assets-in-place and the value of the expected future projects is added up and then discounted to the NPV:
Firm value = Capital InvestedAssets-in-place+∑ EVAt,Assets−in−place (1+Ke)t
t=∞
T=1 + ∑
EVAt,Future Projects
(1+Ke)t
t=∞
t=1 [12]
According to Young (1997) the EVA approach has become more popular as it does not contain the flaws associated with the estimation of the Ke. However, calculating the EVA is often not
7
2.2.2 Input Factors for DCF Valuation
Cost of Capital
The cost of capital is the rate of return investors require from the company for their invested capital. It represents the opportunity cost of investors, as they have access to financial market investment opportunities (Brotherson et al., 2013).
In the DCF valuation models the cost of capital is crucial to discount the expected free cash flows to obtain the present value. The different financing models of a company and thus the different cash flows presented in the DCF models require different discount rates. The discount rates are the Ke which is used if the business is entirely equity financed, the Kd, if the company
is funded only by debt and the WACC in the case the company is financed by a mix of debt and equity.
Weighted Average Cost of Capital (WACC)
The WACC is the rate to discount the expected FCFF and reflects the risks of the entire company. It is calculated by “weighting the cost of the debt and the cost of the equity with respect to the company’s financial structure” (Fernández, 2007, p.16).
WACC = D∗ (1−Tax rate)
E+D ∗ Kd+
E
E+D∗ Ke [13]
In order to compute the WACC, the capital structure and the risk profile of the company needs to be stable. Otherwise, the presented formula needs to be adjusted to compensate for effects causing additional risks like specific financing programmes, issue costs, exotic debt securities, tax shields or dynamic capital structures (Luehrman, 1997). Further, the capital structure presented in the WACC formula needs to be based on target capital structure measured in market values of debt and equity (Koller et al., 2010).
Cost of Debt
Incorporated in the WACC formula is the after-tax cost of debt. The cost of debt is the return external lenders require for lending their money to the company (Frykman & Tolleryd, 2003). It depends on the firm’s debt size and its associated risks. To capture the risk that firms might not be able to pay the promised payments back, the lenders add a default risk to the riskless rate (Damodaran, 2010b), resulting in the following formula:
8 According to Damodaran (2010b) there are three components to estimate the cost of debt: the risk-free rate, the default spread and the tax rate. The risk-free rate is the same as used in the calculation of the cost of equity, presented later on in this section.
There are two possible approaches for the estimation of the default risk. First, if the company has issued bonds, the yield to maturity is a good proxy for the default risk. The issued bonds are usually rated by one of the established rating agencies such as S&P, Moody’s or the Fitch Group. The rating agencies publish default spreads according to the respective rating. Second, if the firm is not rated but has outstanding debt a synthetic rating based on the financial ratios can be conducted. A simple approach is to base the rating on the interest coverage ratio of the company (EBIT/Interest expense) (Frykman & Tolleryd, 2003).
The last input is the tax rate. Interest expenses paid to the lenders, reduce the taxes paid. The accurate tax rate for this calculation is the marginal tax rate.
Cost of Equity
The cost of equity is the required return on shareholders’ equity which is part of the WACC and further also used to discount the FCFE and dividends in the DDM. The most popular approach of calculating the cost of equity is through the capital-asset pricing model (CAPM), which converts the risks of investing in the company into the expected return (Fernández, 2007). Ke = risk-free rate + ß * ERP [15]
Where,
ERP = Equity Risk Premium = E(rm)– rf | rm = market return | ß = beta
The CAPM represents the relationship between the expected return on an asset and the systematic beta risk. The model explains the asset’s sensitivity in respect to the systematic risk in a well-diversified portfolio. To calculate the cost of equity, the model requires the estimation of an appropriate risk-free rate (rf), beta and an equity risk premium (ERP) (Frykman
& Tolleryd, 2003). Risk-free rate
The risk-free rate represents the time value of money and is the rate of return an investor receives when investing in an asset with no default risk (Fernández, 2007).
A proxy for the risk-free rate are long-term investments in government bonds or treasury bills assuming that they do not default (Damodaran, 2010b). Further, the maturity should be in line
9 with the investment horizon of the investor, thus it is recommended to use a 10-year government bond in the home country of the company. A lower investment horizon would dismiss the reinvestment opportunities and in longer periods the liquidity of the bonds is limited. (Damodaran, 2010b; Frykman & Tolleryd, 2003).
Equity Risk Premium
The equity risk premium, is the average risk premium an investor expects to receive when investing in a risky asset over an alternative risk-free investment. It is calculated as the excess return on the market over the risk-free rate.
According to Damodaran (2010a) there are three possible methods to estimate the equity risk premium. The first and also most common approach is to calculate the equity risk premium based on historical premiums. Thereby, the actual returns in a risk-free investment are compared to the historical stock returns. The second approach is the ‘Survey Premiums’ by which the investors, managers or academics are asked about the equity returns they expect in the future. Lastly, the ERP can be estimated by using implied premiums. This approach estimates a “forward-looking premium based on the market rates or prices on traded assets today” (Damodaran, 2010a, p. 15).
Beta
Beta is a measure of the systematic non-diversifiable risk of the stock returns reflecting its volatility regarding the market. This systematic risk cannot be eliminated by investing in a diversified portfolio (Fernández, 2007).
A riskless investment yields a beta of zero. A beta equal to one means that the companies changes in performance are similar to changes in the economy. Firms with betas higher than one are highly sensitive to economic changes and are thus perceived as risky investments. By contrast, firms with betas lower than one are less sensitive to economic changes (Palepu et al., 2016).
In order to estimate the value of the company’s beta Koller et al. (2010) and Damodaran (2006) propose to regress stock returns (rj) against market return (rm) of a well-diversified portfolio.
After the empirical estimation of the raw beta, the estimate needs to be improved by incorporating industry comparable and smoothing methods. To obtain accurate results they suggest to incorporate at least 60 observations of monthly returns.
10 Regression:
rj = α + ß * rm [16]
where: ß = Cov (rj ,rm)
σ𝑚2 [17]
Smoothing beta: Adjusted beta = 1
3+ 2
3∗ raw beta [18]
Another way to estimate the value of beta is to use the beta of similar companies or a sector beta (Frykman & Tolleryd, 2003).
Also, the degree of operating and financing leverage influences the beta. In the case a company is not entirely equity financed the incremental risk from “leverage must be added to the intrinsic systematic risk of the company’s business”, resulting in the levered beta (Fernández, 2007, p. 18). The following equation displays the relationship between the levered and unlevered beta. For the debt and equity, it is important to use market data.
ßL = ßU * (1+ D
E(1 − Tax rate)) [19]
Terminal value
After forecasting the explicit period, the company is expected to generate cash flows beyond this period. Cyclical companies may require a longer explicit period. For the selection of the terminal year, the company needs to be in a steady state. This means, that the company’s revenue growth rate, NOPLAT, asset turnover, the financial structure and free cash flow growth are constant (Palepu et al., 2016).
The terminal value is a very important parameter in estimating a company’s value and allows simplifying the assumptions for the forecasting periods beyond the terminal year. According to Frykman and Tolleryd (2003) the terminal value accounts for 70% - 80% of the company’s value estimate. Further, it is important to consider that the expected growth of the firm can never be “greater than the average growth rate of the economy” (Palepu et al., 2016, p. 363). Damodaran (2012) states three approaches of estimating the terminal value: First, the estimation of a liquidation value of the firm’s assets. Second, the application of multiples to the firm’s earnings or revenues and third, the use of a stable growth model assuming the company is in a steady state.
11 For the valuation of Carlsberg, a stable growth of cash flows and profits is expected. The following formulas are used to compute the terminal value in the different DCF valuation models.
Terminal Value FCFE0= FCFET∗(1+g)
(Ke−g)∗(1+Ke)T [20]
Terminal Value FCFF0= FCFFT∗(1+g)
(WACC−g)∗(1+WACC)T [21] 2.2.3 Valuation in Emerging Markets
The valuation in emerging markets is more difficult as in developed markets as investors face obstacles and greater risks (James & Koller, 2000). Therefore, company’s often “reject good investment opportunities and underestimate the performance of existing businesses” (Goedhart & Haden, 2003, p. 3). However, according to Goedhart and Haden (2003) the investment in a diverse portfolio across different countries spreads the risks and is not more risky than investments in developed countries.
Recent research shows that there is only little agreement about the question how to perform a valuation in emerging markets. The models used are the same as in developed markets, only the assumptions vary as emerging markets entail additional risks (Goedhart & Haden, 2003; James & Koller, 2000).
There are two possibilities to account for the additional risks. Either, to incorporate the risk in the cash flows by conducting a DCF analysis and probability-weighted scenarios or to add a country risk premium (CRP) to the discount rate (James & Koller, 2000). James and Koller (2000) prefer the robust and solid cash flow method which incorporates macroeconomic and industry related. In contrast, adjusting the cost of capital by a country risk premium has several flaws. For instance, there is no systematic methodology to determine the premium and it is difficult to accurately account for specific risks (James & Koller, 2000).
For the valuation of Carlsberg, the risks in the different markets the company operates are incorporated in the discount rate including a CRP.
Further important valuation models such as the liquidation & accounting based valuation and the contingent claim model are presented in Appendix 2 and 3, respectively.
12
2.2.4 Relative Valuation
The relative valuation of a company is based on the value of similar assets in the market by which the value of a company is estimated relative to the market value of comparable firms. A multiples valuation first requires the identification of similar assets by selecting appropriate comparable companies in the market. Second, the prices need to be standardized by converting them into multiples based on common variables (Damodaran, 2006).
In practice, the relative valuation, is often used by analysts due to the simplicity of this method as the multiples valuation is not dependent on assumptions and detailed forecasts. Most analysts use multiples either on a stand-alone basis or to verify the results of the more complex DCF valuations (Liu, Nissim, & Thomas, 2007).
2.2.4.1 Peers
When performing a relative valuation, the selection of the comparable companies is crucial to obtain accurate results.
Koller et al. (2010) emphasise to select peers in the same industry with “similar growth, return on capital and ROIC characteristics” (Koller et al., 2010). Also, Foushee, et al., (2012, p.2) argue that only companies that “compete in the same market are subject to the same set of macroeconomic forces” and thus relevant for the peer group. Additionally, it is important that the value drivers are proportional (Kaplan & Ruback, 1995).
Damodaran (2006) further elaborates that if the cash flows and risks, the growth of comparable companies are identical, the set of comparable firms is not restricted to a specific industry. In practice, it is often difficult to determine benchmark companies as they do not perfectly match. Even if the companies are operating in the same industry, they might have different capital structures, growth rates, risks and cash flows (Kaplan & Ruback, 1995).
For the selection of Carlsberg’s peer group, a set of variables will be selected to determine the most similar companies with regard to Carlsberg’s operating and financial performance, growth and macroeconomic conditions.
2.2.4.2 Multiples
To obtain the company value through multiples, first a particular multiple for a set of comparable companies is calculated. Multiples represent a ratio between the company’s equity
13 or enterprise value and a common variable. Next, to estimate the company’s target value the peers’ multiple is multiplied with the corresponding value driver of the firm being valued (Liu et al., 2007). Value drivers are measures that are related to the company’s revenues, earnings, cash flows or book values and are crucial for the determination of the enterprise or equity value (Holthausen & Zmijewski, 2012).
To reduce the influence of outliers, Liu at al. (2007) suggest to use a harmonic mean for the calculation of industry multiples instead of using the average or median.
Harmonic mean = 1 1
n∗∑ Price value driver
[22]
According to Fernandez (2001) the use of multiples depends on the respective sector in which the company operates. He shows that price-to-earnings ratios (PER) and EV/EBITDA multiples are the most widely used multiples. However, Beneish et al. (2013) state that multiples based on earnings and expected returns incorporate flaws as earnings can be easily manipulated through the use of different accounting policies and the inclusion of non-operating items (Goedhart, Koller, & Wessels, 2005). Besides, the PER can also be affected by the changes in the capital structure thru the increase of leverage. The authors therefore suggest to use EV/EBITA or EV/EBITDA as they are less affected by distortions (Foushee et al., 2012; Goedhart et al., 2005).
Another important distinction is between trailing and forward multiples. Forward multiples are based on the forecasts, while trailing multiples rely on historical data (Liu, Nissim, & Thomas, 2002). According to Koller et al. (2010) forward looking multiples are more accurate as they take into account the future of the company, exclude sunk costs and one-time gains and losses. Liu et al. (2002) found that multiples based on earnings forecasts outperform historical earnings, cash flows and book-equity multiples. Further, the worst value driver are sales (Liu et al., 2007).
2.2.4.3 Limitations
The relative valuation needs less information than the intrinsic valuation of a company. This is a big advantage but at the same time it is also a big weakness. The selection of comparable firms is difficult and important value drives might be ignored. Further, as multiples reflect the market, the estimated multiples of comparable firms can be too high or too low by over- or
14 underestimating the market (Damodaran, 2010b). As mentioned above, multiples are affected by the capital structure and accounting distortions.
Given these limitations Holthausen and Zmijewski (2012) suggest to use multiple in conjunction with other valuation methods.
2.3 Final Considerations
The choice of the valuation models used for the valuation of Carlsberg was based on the advantages and disadvantages of the respective models in conjunction with company specific circumstances.
Thus, as primary valuation model, the WACC-based discounted cash flow to the firm is considered as the appropriate model as a stable target capital structure is expected and further this model overcomes the flaws of the APV. To account for different possible company’s future states a sensitivity analysis is performed considering possible variations in the discount rate and growth of the company. The other valuation models are not taken into account for the previously explained reasons. In order to verify the results obtained through the DCF a relative valuation using price and enterprise multiples is conducted.
15
3 Strategic analysis
Before performing the forecasts and the valuation, it is crucial to analyse the company’s strategic performance which aims at identifying whether Carlsberg is able to create value for its shareholders. In this context the internal as well as the external environment of Carlsberg is examined through an industry- and a SWOT analysis.
3.1 Industry analysis
The industry analysis is conducted by analysing the general beer market and the framework ‘Porter’s five forces’.
3.1.1 Beer Industry
The global beverages industry is divided into the segments soft drinks, beers, spirits, wines, ciders and flavoured alcoholic beverages (MarketLine, 2015). In the category alcoholic beverages, “beer is the most consumed alcoholic drink” (Colen & Swinnen, 2016, p.186) and accounts for 37% of the alcoholic drinks revenue (Statista, 2019).
In the global beer and cider market, beer is the largest segment with 97.6% market share, whereas cider only presents the remaining 2.4%. Geographically, the three largest consumer markets for beer are Europe with 32.7%, followed by Asia (30.3%) and the United States (19.7%) as figure 1 illustrates (MarketLine, 2019).
Figure 1: Segmentation Global Beer and Cider Market 2017 (MarketLine, 2019)
The following figure shows the CAGR of the last 5 years in different regions. In recent years, the sales volume in traditional beer markets such as Europe is declining, indicating a highly saturated market. In contrast, the beer consumption in emerging countries like Asia, Africa,
32.7%
30.3% 19.7%
0.7% 16.5%
Segmentation Global Beer and Cider Market 2017
Europe Asia-Pacific United Stated Middle East Rest of the World
16 Central and South America increased rapidly (Colen & Swinnen, 2016; MarketLine, 2018b). However, despite the declining beer consumption in traditional markets “beer is the most valuable beverage category in the world with a high consumer penetration” (Carlsberg, 2016).
Figure 2: CAGR Beer Consumption 2011 - 2016 (JP Morgan, 2018)
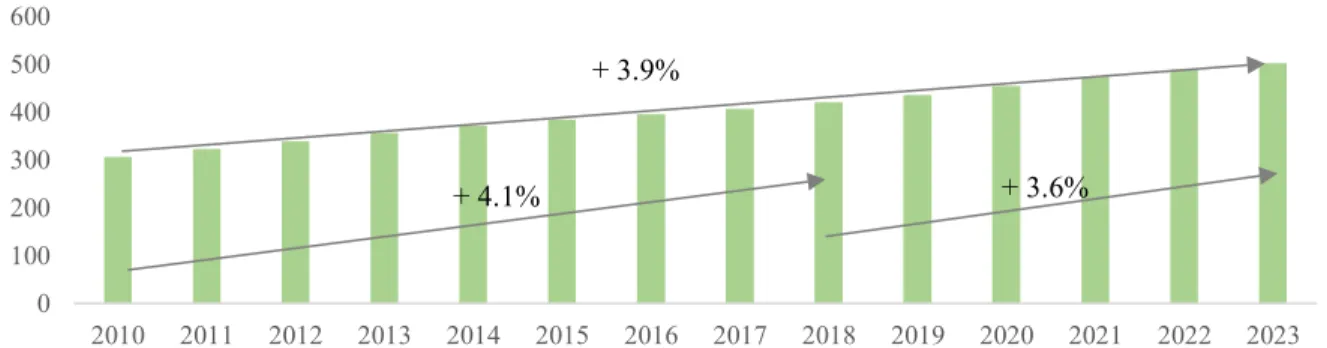
Figure 3 illustrates the revenues and the respective CAGR in the years 2010 – 2013. Compared to the CAGR of 4.1% in the period of 2010 – 2018 the expected CAGR for 2018 – 2023 amounts to 3.6%. In terms of volume sales, the CAGR between 2010 – 2018 was 0.7% (Statista, 2019) and is expected to be 1% between 2017 and 2022 (MarketLine, 2019).
Figure 3: Revenue of Beer Worldwide in Billion US$ (Statista, 2019)
Recent trends show that the segments craft beer, alcohol-free and flavoured beverages are growing rapidly resulting from a lifestyle change that focuses on sensory and indulgence, smart and connected, urbanisation, health and wellness (Carlsberg, 2016; MarketLine, 2018b). Besides, consumers favour “drinking less but drinking better” (JP Morgan, 2018) which points out customers’ willingness to pay more for high quality beer. In this context the premiumisation of beer plays an important role. From 1999 - 2017 the CAGR for premium and superpremium
-1.70% -1.30% -1.00% -0.40% 0.10% 0.50% 1.20% 4.30% 0.10% -2.00% -1.00% 0.00% 1.00% 2.00% 3.00% 4.00% 5.00%
Europe Japan Middle
East Oceania AmericaNorth Asia (ex-Japan) Central andSouth America
Africa Global Total
CAGR Global Beer Consumption 2011 - 2016
0 100 200 300 400 500 600 2010 2011 2012 2013 2014 2015 2016 2017 2018 2019 2020 2021 2022 2023
Revenue Worldwide in Billion US$ + 3.9%
17 was 3.1% respectively 5.0% compared to a CAGR of 1.6% for mainstream beer (Kevin Baker, 2018).
Figure 4: Global Beer Growth by Price Segment, CAGR 1999 – 2017 (Kevin Baker, 2018) 3.1.2 Porter’s five forces
Rivalry among existing firms: The current beer market is dominated by four big players as displayed in figure 5: Anheuser-Busch InBev, Heineken, Molson Coors Brewing Company and Carlsberg. These four players account for a market value of 51.6% in 2017, whereby AB-InBev is controlling 28.2% of the market value mainly driven by the acquisition of its main competitor SABMiller in 2016. In comparison, the market share of Carlsberg accounts for 5.5% (MarketLine, 2019). In the last 20 years, numerous mergers and acquisitions in the beer sector took place to expand into new markets (Kevin Baker, 2018).
Moreover, as most brewing companies generate their main revenues by selling mass-market products such as lager, the fixed costs to operate the plants are high. Additionally, low switching costs of buyers, the moderate industry growth and the strong power of large retail chains cause the beer prices to drop downwards, which further increases the rivalry amongst competitors (MarketLine, 2019). The rivalry among existing firms is high.
Figure 5: Global Beer and Cider Market Share, 2017, in % (MarketLine, 2019)
5.00% 3.10% 1.60% 1.60% 2.00% 0.00% 1.00% 2.00% 3.00% 4.00% 5.00% 6.00% Superpremium Premium Mainstream Discount All
Global Beer Growth by Price Segment, CAGR 1999 - 2017
28.2%
11.1%
6.8% 5.5%
48.4%
Market Share in the Global Beer and Cider Market, 2017
Anheuser-Busch InBev Heineken
Molson Coors Brewing Company Carlsberg A/S
18 Threat of new entrants: The global beer market is controlled by large multinational companies. To enter this market, new entrants have to undertake large investments to fund the production facilities and distribution centres. For smaller companies the entrance into the beer market is difficult as brand identity, customer loyalty and reliable business partners throughout the value chain are essential. The dependency on the retail channels like supermarkets is high, which can drive the prices up and therefore the margins of the breweries down (MarketLine, 2019).
In the mass-market production, the margins tend to be much lower compared to small companies that only focus on the production of premium beer. Thus, new entrants may be more attracted by the premium sector and enter the market as ‘microbreweries’.
Further, many countries have strict government regulations regarding brewing and selling alcoholic beverages, which reduces the number of new entrants (MarketLine, 2019). Consequently, the threat of new entrants is considered low.
Threat of substitute products: The threat of substitute products is considered to be high as the switching costs for customers and distributors are low due to many available substitutes for beer. First, there are lots of different beer brands and competitors offering the same types of beer. Second, other alcoholic beverages as wine and spirits or even cider, non-alcoholic or flavoured beers are substitutes for traditional beer.
The demand for beer is also dependent on the geographic area. In western European countries beer is the dominating alcoholic beverages, while southern European countries prefer wine. In Asia and Eastern Europe there is a strong tendency for consuming spirits (WHO, 2018). Besides, beer is a heavy beverage and is best when it is refrigerated before consumption, which might rise storage costs (MarketLine, 2019).
Bargaining power of buyers: In 2017 the biggest buyers for beer were on-trade businesses, followed by hypermarkets and supermarkets accounting for 57.6% respectively 24.2% of the sales. Favourably negotiated beer prices of important buyers and low switching costs for customers increase the bargaining power (MarketLine, 2019). Furthermore, the price sensitivity and the high elasticity of beer consumption increases the buyers’ power even more. As figure 6 shows, in developed markets the price elasticity for alcoholic drinks is generally higher than in emerging markets (Euromonitor International, 2014).
19
Figure 6: Price Elasticity Alcoholic Drinks, Developed / Emerging Countries, 2014 (Euromonitor International, 2014)
The bargaining power of buyers is further dependent on the geographic region. The western European market is saturated, highly competitive and the demand is declining, which increases customers power. The customer power in Eastern Europe is limited due to Baltika’s market presence, which was acquired by Carlsberg. The growing demand for beer in Asia reduces the buyer power (MarketLine, 2019).
Consequently, the bargaining power of buyers is considered to be moderate to high.
Bargaining power of suppliers: The main ingredients to produce beer are hops, malted grain and water. The quality of these raw materials is crucial for a high-quality end product. Thus, many multinational brewing companies use vertical integration to better influence the quality of their beer which lowers the influence of suppliers (MarketLine, 2019). However, the breweries are dependent on these ingredients, which are often subject to price changes due to weather conditions (Barth-Haas Group, 2018).
The suppliers of breweries are small and local companies that are spread across the world which reduces their power. Though, barley producers can sell their products to various markets as animal feed or spirit producers and therefore reduce their dependence on the breweries and increase their power. Moreover, multinational breweries have a dominant market position which allows them to create competition among suppliers (MarketLine, 2019). Overall, the bargaining power of suppliers is assessed as low.
To sum up, the following illustration presents the previously described dimensions for the global brewing industry:
-1 -0.9 -0.8 -0.7 -0.6 -0.5 -0.4 -0.3 -0.2 -0.1 0
Ready-to-drink Sparkling Wine Still Light Grape Wine Beer Lager Beer Total Alcoholic drinks
Price Elasticity for Selected Alcoholic Drinks
20
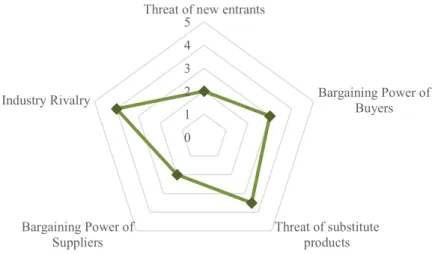
Figure 8: Porter’s Five Forces – Global Brewing Industry 3.2 Company Overview
3.2.1 Key Facts about Carlsberg
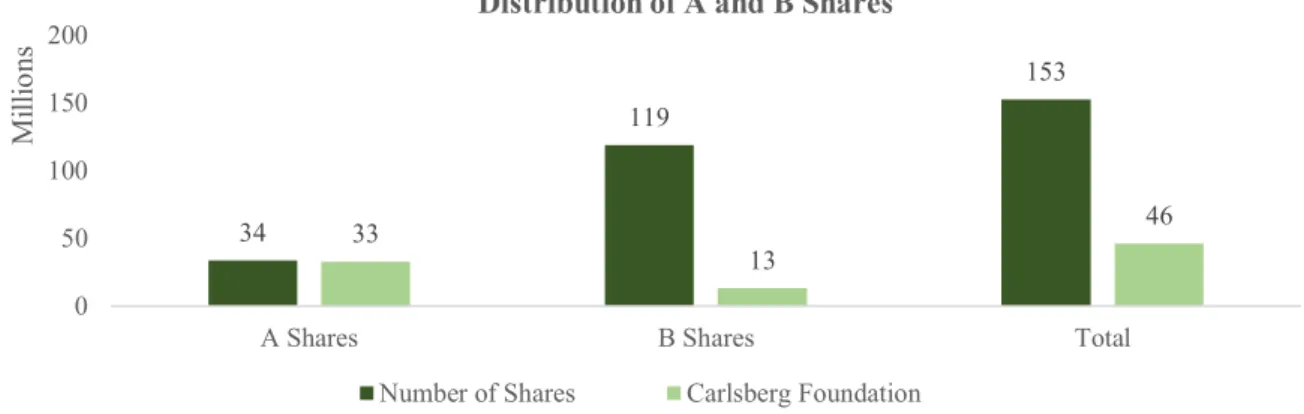
The Carlsberg Group (Carlsberg S/A) founded in 1847 by Jacob Christian Jacobson and headquartered in Copenhagen is one of the world’s leading brewing companies (Carlsberg, 2019a). A detailed history is presented in Appendix 4. Since 1970 Carlsberg is listed on the Copenhagen Stock Exchange (Carlsberg, 2019f). The worldwide well-know flagship brand of the company is Carlsberg, besides a diversified global and local product portfolio of 140 brands sold in 150 markets (Carlsberg, 2019a). In the fiscal year 2018 Carlsberg recorded revenues of DKK 62,503m, a reported growth in volume of 5.3% and an operating margin of 14.9% (Carlsberg, 2019c).
Carlsberg has issued A shares and B shares. For a par value of DKK 20 per share, A shares give the shareholders 20 votes per shares, whereas B shares incorporate 2 votes per share. The share prices are close to each other and the dividend paid is identical for both types, amounting to DKK 18 per share in 2018 (Carlsbeg Group, 2019). Figure 9 shows the distribution of A and B shares. A shares account for 22.1% and B shares for 77.9% of the total shares. Almost all of the A shares are hold by the Carlsberg foundation and are thus own shares of the company. The B shares are mainly free float. A detailed overview of the shares classes is presented in Appendix 5. 0 1 2 3 4 5
Threat of new entrants
Bargaining Power of Buyers Threat of substitute products Bargaining Power of Suppliers Industry Rivalry
21
Figure 9: Distribution of A and B shares, Free float vs. Carlsberg Foundation
Figure 10 presents the share price evolution of Carlsberg within the last five years compared to the OMXC20. The OMXC20 is an index of the Copenhagen Stock Exchange consisting of the 20 most traded stock classes. The stock of Carlsberg generally follows the movements of the OMXC20, but the returns of Carlsberg are mostly lower than the index. In recent years the share price of Carlsberg has been increasing continuously with some minor fluctuations.
Figure 10: Share Price Evolution Carlsberg vs. OMXC20 Index Price, 2014 – 2019 3.2.2 Ownership Structure
In 1876 J.C. Jacobsen established the Carlsberg Foundation to secure the future of the brewing company with a focus on high-quality and innovative products. The Foundation must at least hold 51% of the total voting rights. Today, 30% of the share capital of Carlsberg S/A are owned by the Carlsberg Foundation which accounts for 75% of the voting rights. The remaining 30%
34 119 153 33 13 46 0 50 100 150 200
A Shares B Shares Total
M
ill
io
ns
Distribution of A and B Shares
Number of Shares Carlsberg Foundation
0 200 400 600 800 1000 1200 31 .1 2. 20 13 31 .0 3. 20 14 30 .0 6. 20 14 30 .0 9. 20 14 31 .1 2. 20 14 31 .0 3. 20 15 30 .0 6. 20 15 30 .0 9. 20 15 31 .1 2. 20 15 31 .0 3. 20 16 30 .0 6. 20 16 30 .0 9. 20 16 31 .1 2. 20 16 31 .0 3. 20 17 30 .0 6. 20 17 30 .0 9. 20 17 31 .1 2. 20 17 31 .0 3. 20 18 30 .0 6. 20 18 30 .0 9. 20 18 31 .1 2. 20 18 31 .0 3. 20 19 S ha re pr ic e (DK K )
Share Price Evolution Carlsberg vs. OMXC20 Index Price
OMCX20 Index Price Carlsberg Carlsberg Share Price Maximum
22 of capital, corresponding to 25% of the voting right, are free float as figure 11 displays (Carlsberg, 2019d).
Figure 11: Ownership Structure Carlsberg S/A 3.2.3 Brands
After the foundation of the company in 1847, Carlsberg solely produced larger beer. Nowadays, Carlsberg offers a large and diversified product portfolio, targeting different premium and local customer segments around the world. Carlsberg, Baltika and Tuborg are the most known and sold brands in Europe (Carlsberg, 2019a). Other major brands of the company are Kronenbourg, Ringnes, Falcon, Grimerbergen, Somersby, Lav and Lvivske (MarketLine, 2018a).
Carlsberg’s product portfolio is divided into core beers and growing categories. Core beers include international premium brands and local brands, whereas the growing categories contain a large number of craft and speciality, alcohol-free brews, water and cider (Carlsberg Group, 2019). The core segment accounts for 87% of Carlsberg’s net beer revenues. As figure 12 presents the global brands have the highest presence in Asia (46%). In Eastern Europe and in Western Europe the presence of local brands is stronger.
Figure 12: Percentage of Net Revenue from Brand Type by Region (Oeming, et al., 2019)
27% 15% 46%
74% 85% 54%
0% 50% 100%
Western Europe Eastern Europe Asia
% of Net Revenue from Brand Type by Region
Global brands Local brands 100%
30% of capital
75% of votes 70% of capital 25% of votes Carlsberg
Foundation Free Float
Carlsberg A/S Listed on Nasdaq OMX Copenhagen Carlsberg Breweries A/S Operating Companies
23
3.2.4 Markets
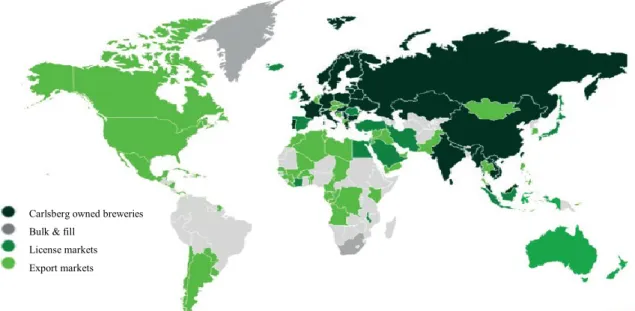
Carlsberg is operating in three different regions: Western Europe, Eastern Europe and Asia. In these markets the company operates through local breweries that are partially or fully owned by the Carlsberg Group. Besides that, license agreements, export partnerships and urban developments allow Carlsberg to be present in more than 100 markets worldwide where they do not have own breweries. Totally, Carlsberg serves customers in over 150 markets as shown in figure 13 (Carlsberg, 2019e).
Figure 13: Global Presence of Carlsberg (Oeming et al., 2019)
In Western Europe, Carlsberg is the second largest beer brewing company and operates through 22 local breweries. This region accounts for 58% of the total revenues. The Eastern European market is the smallest region accounting for 17% of the revenues whereby Russia and the Ukraine are the main markets. In Asia, Carlsberg has a strong market position and is operating through a network of 41 breweries, where the majority is located in China. Table 1 summaries the main key facts about the three regions.
Table 1: Key Facts Western Europe, Eastern Europe and Asia
Western Europe Eastern Europe Asia
Percentage of Revenue 58% 17% 25%
Breweries 22 Breweries 14 Breweries 41 Breweries
CAGR Revenue 5yr -0.87% -5.23% 4.45%
Main Markets Poland, Germany, Finland Russia, Ukraine China, Cambodia, Vietnam Current situation highly saturated market,
stable market environment
difficult political situation, restrictions regarding advertising and selling beer
Growth potential, promising market
Carlsberg owned breweries Bulk & fill
License markets Export markets
24
3.2.5 Company Strategy and Business Model
“Probably the best beer in the world” is the tagline of Carlsberg which represents the companies high quality standards for beer brewing and the responsible use of resources to protect the environment (Carlsberg, 2019h). In accordance with this, in March 2016 Carlsberg launched its new strategy ‘Sail 22’. The following key priorities of this strategy are designed to deliver shareholder value (Carlsberg Group, 2019):
1. Strengthen the core 2. Position of growth 3. Create a winning culture
The strategy aims at strengthening the core business, expanding the presence in the Asian market and sustaining the market leadership in Russia. Further focus is set on expanding in big cities and gaining a leader position in emerging markets trough the premiumisation of international and local beer brands and expanding the craft and low-or non-alcoholic beverage portfolio (Richard Milne, 2016). The strategy is split in two part. From 2016 – 2018 the focus was on ‘funding the journey’ including cost savings. From 2018 – 2022 Carlsberg will reinvest the money.
Since the launch of the new strategy Carlsberg was able to strengthen its brand performance, to optimise efficiency and to improve the overall operational performance (Carlsberg Group, 2019). As part of Sail’22, a share buyback program, starting in February 2019, was announced amounting to DKK 4.5bn (Carlsberg Group, 2019).
3.2.6 SWOT Analysis
In Appendix 7 a SWOT analysis of Carlsberg is presented, displaying the company’s strength and weaknesses as well as the opportunities and threats.
25
4 Financial Analysis
The financial analysis presented in this section aims to analyse the relationship between the past performance, external factors and management decisions. The past performance is observed using key performance indicators and a ratio analysis.
4.1 Revenue
The following figure presents the revenues of Carlsberg in the last five years, segmented into the different operating regions. Total revenues decreased by a CAGR of -0.63% between 2015 to 2018. InWestern Europe the revenues were stable in recent years, whereas in Eastern Europe they experienced a decline due to instable political situations and new regulations affecting the beer market. The beer market in Asia is a very promising region for Carlsberg. In the displayed period the revenues recorded a CAGR of 4.45%. The development of the total beverage volume is presented in Appendix 8.
Figure 14: Segmentation of Revenue by Region 2014 – 2018 (Annual Financial Reports) 4.2 EBIT, EBITDA and Net Income
In the years 2014 to 2016 the EBIT and EBITDA decreased mainly due to higher operating expenses and D&A. The challenging financial situation was also reflected by the decrease in net income in 2016. The main reason for this was the drop in revenues in the Eastern European market due to advertising bans, night sales restrictions and kiosk bans as well as the PET ban of bottles larger than 1.5 litres. Since 2016, the company started their new strategy approach with a cost saving program, resulting in a higher ROIC. In 2017, the decrease in net income was caused by an impairment of the Baltika brand in Russia of DKK 4.8bn. Since the start of Sail’22 the company recovered from their difficult financial situation which is also reflected in the growing EBIT, EBITDA and ROE in 2018.
37,762 39,000 37,597 35,716 36,151 14,100 10,963 10,205 10,925 10,780 12,491 15,339 14,666 13,944 15,530 153 52 146 70 42 0 10,000 20,000 30,000 40,000 50,000 60,000 70,000 2014 2015 2016 2017 2018
Segmentation of Revenue by Region
Western Europe Eastern Europe Asia Intra-Segment
26
Figure 15: EBIT, EBITDA, Net income, ROIC; 2014 - 2018
4.3 Working Capital, Capital Expenditures and D&A
The investments in PPE and intangible assets decreased in 2015 and 2016, whereas D&A increased slightly. The decline of investments also reflects the decreased profitability in these years. In 2018, the CapEx and D&A were nearly equal. The working capital of Carlsberg diminished continuously in recent years. Carlsberg was able to reduce their cash conversion cycle, mainly due to the increased days payables and slightly reduced days receivables. This implies that the company is able generate cash quickly from selling their products, while having more time to pay their suppliers.
Figure 16: WC, CapEx, D&A; 2014 - 2018 4.4 Ratio Analysis
A detailed analysis of Carlberg’s past performance was conducted through a ratio analysis which is presented in Appendix 9.
13,338 13,213 13,006 13,583 13,420 9,230 8,457 8,245 8,876 9,329 4,414 -2,926 4,486 1,259 5,309 5.8% 5.6% 5.9% 6.9% 8.1% 3% 4% 5% 6% 7% 8% 9% -4,000 -2,000 0 2,000 4,000 6,000 8,000 10,000 12,000 14,000 16,000 2014 2015 2016 2017 2018
EBIT, EBITDA, Net Income, ROIC
EBITDA EBIT Net Income ROIC
-15,530 -15,873 -16,357 -16,587 -18,564 5,908 4,150 3,840 4,053 4,027 4,103 4,674 4,742 4,581 4,064 -20,000 -15,000 -10,000 -5,000 0 5,000 10,000 2014 2015 2016 2017 2018 WC, CapEx, D&A
27
5 Valuation
To obtain the target share price of Carlberg, the WACC-based DCF was used as primary valuation model. To verify these results a relative valuation using multiples was performed.
5.1 Discounted Cash Flow Valuation
For the DCF valuation, the FCFF needs to be computed and discounted at the WACC in order to obtain the final stock price. These calculations require forecast assumptions which are elaborated in this section.
5.1.1 Forecasts
For the forecasts an explicit period of ten years is considered, including the years 2019 – 2028. In the last year, which is the terminal year, Carlsberg has reached a steady state. After this, the FCFF is estimated by using a terminal value.
5.1.1.1 Revenue Forecast
The revenue forecast is crucial for the valuation as the revenue is the value driver for many positions of the balance sheet and the income statement. To forecast the revenues, the regional break down and the main components that drive the revenue such as volume, price and transactions of acquisitions and disposals were taken into account.
However, as Carlsberg does not disclose information about their acquisition strategy, it is difficult to estimate the future acquisitions. Thus, the focus lies on the drives volume and price for which the organic growth of Carlsberg’s revenues was considered. In addition to the historical movements, economic conditions, the expected GDP growth and the industry outlook in the respective regions was observed.
In accordance with Koller et. al (2010) the explicit period was divided into two periods. A detailed six-year forecast by breaking down the revenue into regions and a simplified forecast for the remaining four years in which revenues are expected to reduce by 15bsp each year until Carlsberg reaches the steady state in 2028.
The forecasts in the respective region are also driven by the Sail’22 strategy which states goals for the development of the company. After ‘funding the journey’ which was based cost savings, the company will reinvest the money in the years 2019 - 2022.
28 Western Europe: Western Europe is the main region of Carlsberg in terms of revenue and net income. Carlsberg’s market share accounted for 11.7% in the European beer and cider market in 2018.
The GDP for the next years is expected to grow, but as income grows also the health awareness increases and customers change their alcohol consume towards premium beers, wine and spirits as well as low and alcohol-free beers. This implies a negative correlation between the GDP and the beer consumption in high-income countries (Colen & Swinnen, 2016). The customers in Western Europe seek variety and are willing to pay more for high quality beers. According to Sail’22 Carlsberg focuses on growing premiumisation, craft agendas and the expansion of low and alcohol-free beers. The market in Western Europe is highly mature, competitive which makes it difficult for Carlsberg to capture incremental potential in Western Europe.
Overall, the total revenues in Western Europe are expected to decrease in the next years. Further, they will grow at a lower rate than the industry expectations due to competition and a highly saturated market. This is also in line with past performance as the organic growth in the last five years was around 1% compared to 3.2% industry growth.
By analysing the volumes and average prices, the beer consumption is expected to stay at the industry level till 2022. Thereafter, the beer volume is expected to stagnate. In contrast to this, the volume of other beverages is anticipated to increase at a rate of 3% which is the average of the last 5 years’ organic growth. It is higher as the industry, but this is in line with the historical movements comparing industry and organic growth. Then, it is expected to grow at the industry level of 1.9% (Statista, 2019).
Regarding the average selling prices, an increase is expected due to the premiumisation and speciality efforts. However, as competition is high among brewers and retailers, substantial investments in innovations and product development are required. Thus, a price increase of 0.5% is expected in the next four years followed by a lower increase of 0.3% from 2023 – 2024. The GDP and industry growth rates for the different regions are provided in Appendix 10.