MASTER
IN
FINANCE
MASTER
´
S FINAL WORK
D
ISSERTATION
R
ISK MANAGEMENT AND VALUE CREATION IN BANKING
INSTITUTIONS
:
ANALYSIS TO THE RISK
-
ADJUSTED PERFORMANCE
MEASURES
CARLA ALEXANDRA DELGADO PIRES
MASTER
IN
FINANCE
M
ASTER
´
S FINAL WORK
D
ISSERTATION
R
ISK MANAGEMENT AND VALUE CREATION IN BANKING
INSTITUTIONS
:
ANALYSIS TO THE RISK
-
ADJUSTED PERFORMANCE
MEASURES
CARLA ALEXANDRA DELGADO PIRES
S
UPERVISOR:
PROFESSOR FERNANDO FELIX CARDOSO
I
Acknowledgment
I dedicate this dissertation mostly to my mother, who had and will always be in my thoughts.
Also, would like to express my gratitude to several people for their invaluable help. First and foremost I would like to thank my supervisor, Professor Fernando F. Cardoso, for his great support, dedication, patience, and rewarding guidance. Second, I am grateful to my brother for all the dedication and support he gave me, for, followed me from the beginning to the end of the preparation of this work.
Finally, I thank all my friends and colleagues, who have always been with me and have greatly contributed to the preparation of this work, for all the patience, strength and advice they gave me during these last two years.
II
Abstract
Until the 1980s, traditional metrics based on financial statements have been the primary methodology used to assess banking performance. However, such metrics have shown significant divergence between accounting and economic realities, therefore becoming inadequate to analyze the perception of institutions in terms of value creation for its shareholders and, most importantly, it has become clear that they weren't including a correct management of the several risks to which financial institutions are exposed. New value-based corporate performance assessment metrics have emerged, and risk-adjusted value-based management systems started to be implemented, as opposed to the more traditional indicators. Thus, the so-called RAPM – Risk-Adjusted Performance Measures arose.
The dichotomy between accounting indicators and value-based indicators is the focus of this work, whose main objective is the study of the RAROC metric – Risk-Adjusted Return on Capital, to infer about its advantages and disadvantages. We intend to contribute with a possible implementation approach, to have a better understanding of and to adopt the RAROC methodology through a practical experiment which implements this framework.
In conclusion, the use of risk-adjusted profitability assessment and measurement frameworks, with such risk being inherent to banking operations, proves to be extremely important, so that we can avert the inconsistencies shown by traditional and risk-based criteria.
Keywords: Value Creation, Risk Management, Risk Adjusted Performance Measures,
III
Resumo
As métricas tradicionais, com base nas demonstrações financeiras, foram até à década de 80, a metodologia privilegiada para avaliar a performance bancária, mas estas demonstraram um afastamento significativo entre a realidade contabilística e económica, e como tal, insuficientes para análise à percepção se as intituições estariam ou não a criar valor para os seus accionistas e principalmente denotou-se que não estavam a incluir uma correcta gestão dos diferentes riscos a que as instituições financeiras estão expostas. Emergiram assim, novas métricas de avaliação e gestão da performance baseadas no valor ajustada ao risco, sendo a mais utilizada o Risk Adjusted
Return on Capital (RAROC), em contraposição com estes indicadores mais
tradicionais.
Este trabalho é desenvolvido tendo por base este contexto. São descritas algumas das métricas tradicionais utilizadas, inferindo sobre as suas vantagens e desvantagens. E por fim, é efectuada uma introdução abrangente da métrica RAROC, adicionalmente acrescido de um estudo empiríco prático de implementação do modelo, como qual se pretende-se contribuir com uma possível abordagem de implementação e uma maior compreensão e adopção da medida RAROC.
Conclui-se, que com o uso de modelos de avaliação e quantificação das rentabilidades ajustadas ao risco subjacente às operações bancárias, é possível a obtenção de decisões de crédito e alocação de capital mais consistente, eficientes e concretas, porque se evidenciam e corrigem as inconsistências verificadas entre os critérios tradicionais e os critérios que utilizam a componente de risco.
Palavras-chave: Criação de Valor, Gestão do Risco, Medidas de Performance
IV
Table of Contents
ACKNOWLEDGMENT ... I
ABSTRACT ... II
RESUMO ... III
TABLE OF CONTENTS ... IV
INDEX OF TABLES ... V
LIST OF ABBREVIATIONS ... VI
CHAPTER 1 - INTRODUCTION ... 1
CHAPTER 2 - STATE OF THE ART ... 3
2.1. T
RADITIONALP
ERFORMANCEA
SSESSMENTM
ETRICS... 3
2.1.1. Accounting metrics... 4
2.1.2. Financial Metrics ... 5
2.2.
V
ALUE-B
ASEDM
ANAGEMENT AND ITSM
ETRICS... 7
2.3.
V
ALUE-
BASEDM
ETRICS... 8
2.4.
R
ISKS AND THEIRM
ANAGEMENT... 10
2.5.
T
HEN
EWC
APITALA
CCORD-
B
ASELII ... 11
2.6.
R
ISK-A
DJUSTEDP
ERFORMANCEM
EASURES... 14
CHAPTER 3 - EMPIRICAL STUDY ... 21
3.1.
S
AMPLE DESCRIPTION AND ANALYSIS OF THE UNDERLYING VARIABLES... 21
CONCLUSION ... 29
SUGGESTIONS AND RECOMMENDATIONS ... 31
REFERENCES ... 32
V
Index of Tables
TABLE A.2 - RISK NOTATIONS AND CUMULATIVE AVERAGE DEFAULT RATES
... 37
TABLE A.3 - PROBABILITY OF DEFAULT (PD) ... 37
TABLE A.4 –TYPES OF COLLATERAL AND MINIMUM LDG ... 38
TABLE A.6 - DIFFERENCES IN EXPECTED LOSSES GIVEN THE CREDIT
RATINGS AND COLLATERAL ... 40
TABLE A.7 –UNEXPECTED LOSSES ... 41
TABLE A.8 –HIGHER AND LOWER UNEXPECTED LOSSES ... 42
TABLE A.9 – COMMISSIONS ... 42
TABLE A.10 –RISK-ADJUSTED RETURN ... 43
TABLE A.11 - LOANS WITH MAJOR AND MINOR RISK-ADJUSTED RETURN 44
TABLE A.12 –ECONOMIC CAPITAL ... 45
TABLE A.13 - LOANS THAT ABSORB MORE AND LESS ECONOMIC CAPITAL
... 46
TABLE A.14 – RAROC CALCULATION ... 47
TABLE A.15 - LOANS THAT ADD VALUE TO THE INSTITUTION - HIGHER
RAROC ... 48
TABLE A.16 - DECISION-MAKING BASED ON THE HURDLE RATE ... 48
TABLE A.17 - UNIFORMITY VALUES TEST ... 49
TABLE A.18 – UNIFORMITY VALUES TEST - DECISION-MAKING ... 50
VI
List of Abbreviations
BCBS – Basel Committee on Banking Supervision
CAPM – Capital Asset Pricing Model
CFROI - Cash Flow Return on Investment
CVA - Cash Value Added
EAD – Exposure at Default
EL – Expected Loss
EVA - Economic Value Added
IRR - Internal Rate of Return
LGD – Loss Given Default
NPV- Net Present Value
PER - Price Earnings Ratio
PD –Probability of Default
RAPM - Risk Adjusted Performance Measures
RAROC - Risk-Adjusted Return on Capital
RARORAC - Risk-Adjusted Return on Risk-Adjusted Capital
ROE - Return on Equity
ROI - Return on Investment
RORAC - Return on Risk-Adjusted Capital
VII VaR - Value at Risk
1
Chapter 1 - Introduction
The banking environment is changing, not only from the perspective of market forces and competition, but also from the regulatory and prudential perspectives. It was revised by the Basel Committee, especially in terms of risk management and capital allocation. The latter are the two key instruments for a financial institution's value creation. They assist on decision-making, as well as on choosing different options, and facilitate a safe and sustained growth in an increasingly globalized market.
Banks are currently attempting to meet regulatory requirements. However, they should also create management systems that provide ways to credibly determine the amount of capital needed to sustain their businesses, not only at the individual level, but also as a whole. The aim is to ensure balance between two crucial goals, which are often divergent: profitability (related to efficiency in terms of capital use), to ensure there was value creation instead of value destruction, and perpetuity (which is associated to the need of maintaining a capital base able to absorb adverse shocks).
There are several metrics used to assess performance, and they have greatly evolved. These metrics were, at first, exclusively based on accounting and financial data, subsequently the concept of value arose and thus management based on value and its metrics emerged. Examples of such metrics are the Economic Value Added (EVA) metric and the Risk-Adjusted Return on Capital (RAROC). The latter came from the growing need of a proper risk management.
Given this context, the main aim of this dissertation is to discuss the relationship between risk management and value creation, seeking to give an answer to the following question of investigation:
Is the RAROC metric an effective tool for the calculation, assessment and comparison, in an integrated way, of risk-adjusted performance, and is it consistent with the aim of an effective capital management and shareholder value maximization?
2
In order to answer this question, this dissertation begins with a literature review to establish theoretical bases, which will be further developed by means of an empirical analysis.
Therefore, in addition to this introductory chapter, the body of this work comprises another four chapters.
Chapter 2 provides a literature review, focusing firstly on the description of the concepts and aims of a few traditionally used metrics for performance assessment in a financial and accounting context, as well as the concept of value creation and value-based management. Moreover, this chapter tackles a number of the newest performance measurement metrics based on the concept of value creation. Lastly, this chapter provides an analysis of the most widely used risk-adjusted performance measure: RAROC.
Chapter 3 includes an empirical study, seeking to show that there is value creation through the use of the RAROC metric. This study is grounded on hypothetical data, compiled in MS Excel 2010. Results will also be presented and discussed in this chapter.
3
Chapter 2 - State of the Art
This chapter provides a literature review on the subject, so we can analyze the concepts applied to banking risk management based on value creation. We will begin with a general approach on the traditionally used performance assessment metrics, tackling the concepts associated to such metrics and analyzing its limitations. Value creation and value-based management are then addressed, focusing on the importance of risk management based on value creation. Lastly, the main risk-adjusted performance assessment measures are presented, with a focus on the RAROC metric.
2.1. Traditional Performance Assessment Metrics
There are several performance assessment metrics, widely known today as traditional metrics. These metrics can either have a financial or an accounting nature. They have advantages such as being easy to calculate, being grounded on historical data and having an accounting nature, where the relevant information for their calculation is available in financial statements.
Their main aim is to assist analysts when choosing different investment options. However, in terms of performance assessment, these metrics have a number of limitations.
Rappaport (2001: 30-38) specifies these limitations:
• These metrics are based on accounting results, which in itself is a limitation because these data may arise from alternative calculation methods, which are generally accepted and subject to regulations that can be amended over time or may vary from company to company. Another problem when using these data is the fact that the net income does not correspond to cash flow, as presumed by the approach on the company's current economic value.
• These metrics do not include the time value of money in their calculation. This represents a limitation, since a currency unit today does not have the same value of a
4
currency unit tomorrow. Thus, such metrics aren't suitable to assess the company's variations in economic value because they do not take inflation into account.
• They do not reflect operational risk. When excluding operational risk, the assessment becomes distorted.
• They do not include the opportunity cost of equity in their calculation. When valuing a company, consideration should always be given to whether a more advantageous opportunity has been wasted, so that the risk of overvaluation of the created value can be avoided.
2.1.1.
Accounting metrics
Return on Investment (ROI)
This indicator is regarded as one of the most suitable indicators to assess a company's economic performance, since it is not influenced by the company's financing structure (Neves, 2002). ROI is used to compare the performance of companies having a similar level of business risk, and it can additionally be used to assess the performance of divisions, departments and business units. It allows to assess the amount of net revenue units generated by each invested capital unit (both equity and liability) (Araújo, 2003).
ROI is rather simple to calculate, given that it correlates (in percent) the company results with its investment. In other words, ROI reflects the ratio between profit and investment.
Nevertheless, this measure has a few problems, such as neglecting that the investments' rate of return should be higher than the cost of capital; not including investment risk; and, lastly, not recognizing that maximizing the rate of return does not necessarily imply a maximization of shareholder value.
5 Return on Equity (ROE)
ROE is a performance assessment measure, more directed to shareholders, since it provides a ratio between net incomes and the company's equities. ROE is calculated by the ratio between net profit and net equity. It is different from the latter method because part of the total investment is financed from liabilities.
This method has the same problems as the latter, and leads to a contradictory and conflicting situation with value creation because if the investments' rate of return is higher than the interest rate, the ROE shall increase due to the increase in debt via financial leverage, leading to a decline in the value of the company caused by an increase in financial risk (Rappaport, 2001).
Price Earnings Ratio (PER)
PER is a result of the ratio of the share price and its net profit. In other words, this indicator derives from share price, and so it is possible for this indicator to increase in value solely because of investment that has been made. This indicator is sensitive to the company's new investment opportunities, procurement and changes, such changes in a structural level but also regarding accounting policies. We can therefore conclude that this indicator does not assure value creation or value destruction within the company.
2.1.2. Financial Metrics
Since traditional accounting metrics present a few problems, financial performance assessment metrics started to be used, especially in investment project analysis: Net Present Value (NPV) and Internal Rate of Return (IRR). These metrics take time value of money into account, unlike the traditional metrics.
• Net Present Value (NPV)
NPV compares cash flows generated by a project with invested capital. NPV can be therefore defined as the present value of a project's cash flows. This method is used in the analysis of investment projects, as well as in company valuations when these companies are seen as an investment themselves (Ferreira, 2002).
6
This metric separates consumption decisions from investment decisions, and so provides a maximization of the projects' (or company's) present value, since it allows to select projects having a positive NPV, regardless of the investor's consumption profile. However, this metric does not take the project's global financial risk into account.
• Internal Rate of Return (IRR)
IRR is the discount rate which makes the NPV equal to zero, thus representing the cost of capital's maximum rate the project can sustain. In other words, it is the highest rate the investor is able to engage in a loan to finance the investment without losing money (Barros, 1995). Based on this criterion choosing a project should be done when IRR is higher or equal to the minimum return required by the investor, i.e., the discount rate.
This technique is linked to the NPV technique, since, on the one hand, the IRR assesses a project's return in relative terms, and, on the other hand, the NPV assesses a project's return in absolute terms. What further proves this link is the fact that, in situations where the methods used provide conflicting information, such as investing / not investing, the decision to be taken should always be based on NPV, since this criterion presumes all the project's intermediate cash flows are reinvested under the cost of capital rate, whereas the IRR criterion assumes that such reinvestment shall be done under the IRR rate (Ferreira, 2002).
This metric also has a few limitations, i.e., regarding decisions to be taken in capital restriction situations, as well as in mutually exclusive projects.
We can therefore conclude that traditional metrics do not provide a completely realistic view on whether there was value creation or not. In order to overcome these limitations, value-based corporate performance assessment measures have emerged, such as Economic Value Added (EVA), Cash Flow Return on Investment (CFROI), Economic Margin (EM) and Cash Value Added (CVA), which shall be described in section 2.3. However, this work won't cover several other existing metrics.
7
2.2. Value-Based Management and its Metrics
Rappaport (1986) states that management's main task is the focus on value creation for the shareholder. Following the publication of the book "Creating Shareholder Value" in 1986, managers started to become aware of the importance of this topic for their companies. By contrast, until the 1980s, there were only a few companies focusing on value creation for shareholders. These companies were managed based on a short-term profit orientation.
According to Young and O'Byrne, (2000: 6) “the growing importance of value creation for the shareholder arose from multiple social and economic changes, and the following are the main ones: Globalization and deregulation of capital markets; the ending of capital exchange control; advances in information technology; more liquid securities markets; improvements in the capital market regulation; overall changes in saving and investing options; and, lastly, expansion of institutional investment.”
None of these factors alone is able to make a drastic change. However, their interaction and combination led to a significant change in attitude, causing scholars and entrepreneurs alike to start developing a tendency advocating value creation in companies and in financial institutions.
At this point, value-based management systems started to be implemented and new value-based corporate performance assessment metrics emerged, as opposed to accounting indicators and financial indicators.
According to Neves, (2002) there are three key elements that distinguish a value-based management system from other systems:
1. Shareholder capital, when employed in the company or in business units, should be quantified to ascertain whether there was value creation. This will occur if the return of such capital is higher than the corresponding opportunity cost.
2. The second key element is the pursuit of value for shareholders. In other words, creating value should be the managers' main objective.
8
3. Lastly, all performance assessment metrics used by managers should be aligned with shareholders' objectives and interests. Furthermore, the shareholders should inform managers about the best investments to be carried out.
To briefly summarize, in order to make a management decision that is able to create value, such decision must accomplish one of the following results: an increase in cash flows generated by assets in a short and long-term; a higher prospect of growth results; a wider period of supranormal growth (value creation) and a low cost of capital (Neves, 2002). Lastly, the main question is how to measure such value creation and which tools should be used to do so. Since every metric has its own features, and in order to select the most suitable one, we must take specific conditions into account when doing an assessment.
2.3.
Value -based Metrics
Economic Value Added (EVA)
EVA is a registered trademark of Stern Stewart & Co.; it is a quite popular measure used by companies to assess economic value, representing the margin generated by a company after doing all the underlying and necessary returns (Jordan et al., 2007). This metric derives from the concept of residual profit, since its purpose is to ascertain whether the return carried out by the investor is enough to compensate the underlying investment and risk. Its calculation is obtained by subtracting cost of capital (both equity and liability) from net operating results of taxes (Neves, 2002).
EVA is a value creation metric, and its main focus is on the difference between profitability of invested capital and the underlying cost of financing sources. A positive value indicates value creation, however, a negative value indicates value destruction.
This indicator has a few advantages. Firstly, it can be used when analyzing a company, either as a whole or in sections; secondly, it is easily understood by managers; thirdly, it is easy to be implemented in companies; and lastly, it is the basis of managers' system of incentives (Ferreira, 2002).
9
This indicator has also a few disadvantages, such as not including future expectations; not allowing a direct comparison of companies or business units; showing a bias when acquiring new assets or when making new investments, since this indicator usually becomes low in the investments' initial periods and high during maturity periods; lastly, bigger businesses and those having more modest results tend to show higher EVAs when compared to small businesses, however, the latter can be more profitable (Ferreira, 2002).
Cash Flow Return on Investment (CFROI)
The concept of CFROI was developed by the Boston Consulting Group, as well as by the Holt Value Associates. This method compares generated cash flows with invested capital, adjusting such cash flows to inflation. Thus, CFROI has the purpose of collectively assessing the company's performance as though it was a single project (Ferreira, 2002). There is always value creation when CFROI is higher than inflation-free cost of capital. CFROI is compared to the inflation-adjusted cost to ascertain whether there were returns higher than its cost of capital.
This indicator reflects economic reality in a more accurate way, since it converts accounting data into measures based on cash flow, thus reducing the influence of the accounting data; furthermore, it provides better correlations with the market value of shares.
However, its calculation is rather complex and scholars have pointed out a few disadvantages, which are the following: this indicator does not allow comparisons to be made between projects having different dimensions, nor between projects having different lifetimes; it does not allow comparisons to be made between companies, since their assets' lifetimes can only be the same by coincidence; and lastly, CFROI cannot be calculated when cash flows are negative.
Cash Value Added (CVA)
CVA is a value creation assessment measure registered by the Boston Consulting Group, (Ferreira, 2002). In order to calculate invested capital, it uses assets for their gross value, and not for their net accounting value, which avoids biases caused by new investments, as opposed to the EVA methodology. Therefore, by taking economic
10
amortization into account (as opposed to accounting amortization), the aim of CVA is to take the fixed assets' effective depreciation into consideration, therefore overcoming the distortion caused by the EVA model. The latter, by calculating cost of capital based on net assets, causes the amortizations’ effect alone to lead to an increase of the EVA value. Therefore, managers can invest in modernization because value creation assessment will not be affected, which is the case when using EVA.
Market Value added (MVA)
MVA is a natural evolution of the EVA concept, and is also a registered trademark of Stern Stewart & Co.. MVA is defined as the difference between the market value of the company (both equity value and debt value) and the total value of invested capital (equity and debt accounting value).
According to Ferreira (2002), MVA is a definitive and cumulative measure of value creation. MVA is seen as definitive because it measures the difference between the initial capital invested and the value to be received when selling shares in the market. However, two distinct scenarios may occur: either the market value is higher than the invested capital, which implies a positive MVA; or the market value is lower than the invested capital, which in this case implies a negative MVA. MVA is also seen as a cumulative measure for expressing the assessment made by a market in a given point in time of the past performance, as well as of future expectations.
2.4.
Risks and their Management
A proper risk management is linked to performance management, as well as value creation and its measurement, not only in the context of companies in general, but also in the more specific context of financial institutions. Financial institutions take risks that affect their economic and financial performance either in a positive or negative way, and consequently their market value. These effects depend on the way such risks are managed. According to Schroeck (2002: 30), “by accepting that risk and its management have a crucial role in financial institutions, it is essential to link risk management to value creation.” Therefore, risk management systems (that effectively and efficiently treat the several types of risks that financial institutions are subject to)
11
become essential in such institutions, since there is a wide range of risks. According to Silva (2008: 7), "the banking sector is an activity that involves risks. Risk is inherent to any situation involving decision making, whose results are in the future, which can cause different results from those expected. Such volatility is the essence of risk."
The Bank of Portugal (2007)1 identifies nine risk categories to which financial institutions may be subjected, and divides such categories into two groups: financial risks and non-financial risks. The first group includes credit risk, market risk, interest rate risk and foreign exchange risk, whereas the second group includes operational risk, information systems risk, strategy risk, compliance risk and reputation risk.
In this context, the global banking system has been widely investing on risk and performance measuring systems. Basel II spurred such movement, boosting the conception of risk management models, especially credit risk management models and capital requirements adaptation models.
2.5.
The New Capital Accord - Basel II
According to the Bank of Portugal2, Basel II is a revision of the first Capital Accord (1988, called Basel I), which includes the amendments incorporated in the meantime. The aim of this capital accord was the internationalization of banking activity. However, significant changes in the sector led to the need of a revision. When Basel I entered into force, the definition of the own funds minimum requirements given by such accord was in line with the approach used by financial institutions to control their credit risks (which were the only covered risks on the accord). However, with technological advances and the development of financial markets, with the emergence of new and more complex financial valuation instruments, and with the crises in emerging markets that occurred in the final years of Basel I, it became clear that the own funds requirements were moving further from financial risks management systems and that
1
Available at:
http://www.bportugal.pt/ptPT/OBancoeoEurosistema/ConsultasPublicas/Documents/Consulta_BP_2_0 7_MAR.pdf (viewed 3rd July 2015).
2 Prudential Supervision – Basel II. Available at:
http://www.bportugal.pt/pt-PT/Supervisao/SupervisaoPrudencial/Paginas/BasileiaII.aspx (viewed 16th July 2015)
12
these requirements had limitations as an assessment measure of capital levels adaptation for risks.
Hence, the need to go hand in hand with financial and technological innovation arose, as well as the need to tackle the dissatisfaction towards traditional models of risk assessment. A revision process of Basel I was then carried out, aiming not only to own funds sufficiency, but also to reach competitive neutrality. This revision also had the purpose of ensuring greater sensitivity of capital towards the risk profile of institutions through changes in calculation rules of capital requirements; of widening the own funds regime; and, lastly, of encouraging the use of the so-called "best practices".
Other underlying intentions of this revision include: allowing a more accurate assessment of the different risks for both institutions and supervisors; and also developing information systems for risk assessment and management.
According to Beja (2004) the new prudential regime is structured into three pillars which mutually reinforce one another and seek to establish a link between capital adequacy and quality of risk.
Pillar 1 establishes the rules which determine the own funds minimum requirements to cover credit, market and operational risks. Such Pillar introduced operational risk, which was not addressed in the previous accord. In terms of market risk there were no changes, and credit risk was merely redrafted. Regarding market risk, two approaches for the calculation of capital requirements are proposed: the standardized approach (based on standard risk weights) and the internal ratings-based approach, where the estimate of capital requirements is based on the Value at Risk calculation3.
Such method allowed the emergence of new risk assessment measures, called Risk-Adjusted Performance Measures (RAPM). The Value at Risk methodology and the risk-adjusted performance measures shall be explained in section 2.6.
3 According to the Banco de Portugal Notice no. 5/2007, of April 18th: "The risk weighted exposure amount shall be the potential loss on [...] equity exposures as derived using internal value-at-risk models subject to the 99th percentile, one-tailed confidence interval of the difference between quarterly returns and an appropriate risk-free rate computed over a long-term sample period, multiplied by 12.5."
http://www.bportugal.pt/sibap/application/app1/docs1/avisos/textos/5-2007a-c.pdf, (viewed 18th July
2015, whose translation is from
13
Pillar 2 aims to strengthen the supervisory process in terms of financial institutions' capital amount sufficiency. In other words, Pillar 2 aims to strengthen the link between an institution's internal capital and the risks inherent to its activity.
Pillar 3 aims to heighten sufficiency, consistency and transparency of institutions in different markets when disclosing information. This Pillar has therefore the objective of ensuring an effective market discipline, seeking to achieve stability and soundness of the financial system.
Due to the global financial crisis, which began in the second semester of 2007 and intensified in September 2008 after the bankruptcy of the North-American Lehman Brothers bank, the banking sector has been suffering from a few weaknesses, such as excessive financial leverage4, amount and quality inadequacy, as well as an inadequacy of the used capital to bear risks, and, lastly, an inefficient liquidity risk management. Such situation led to the development of a new Basel Accord, widely known as Basel III, which was announced by the Basel Committee on 12 September 2010.
This new accord aims to achieve several objectives, such as forcing financial institutions to strengthen their capital ratios as well as their liquidity so that they can solve future problems without turning to State aids. According to Pereira (2012) citing Silva, E. et al. (2011b: 13), "the purpose of this new regulation is to reduce the excessive risk that these institutions have taken in the period preceding the 2008 global financial crisis".
In order to achieve such purpose, more strict solvency criteria would need to be implemented, more specifically in defining the eligible elements for the calculation of original own funds, which is the main component of financial institutions.
4
Financial leverage is the degree to which a company uses fixed-income securities such as debt and preferred equity. The more debt financing a company uses, the higher its financial leverage. A high degree of financial leverage means high interest payments, which negatively affect the company's bottom-line earnings per share. http://www.investopedia.com/walkthrough/corporate-finance/5/capital-structure/financial-leverage.aspx. (viewed 17th August 2015).
14
2.6.
Risk-Adjusted Performance Measures
As previously shown, after Basel II, institutions were authorized to develop internal assessment methods of their financial risks. Such internal models should include a sufficient number of risk factors in order to encompass every significant variation possible.
The Value at Risk (VaR) methodology has thus been developed, and served as a basis for the development of Risk-Adjusted Performance Measures (RAPM), which have been increasingly accepted and growing in importance.
Such metrics tend to optimize performance levels based, the latter being based on a profitability logic. Such metrics intend to maximize return over a given risk level; they are measures that establish a ratio between risk-adjusted profitability and risk-adjusted capital or economic capital, and are based on the principle that shareholder value is generated when the profits that derive from invested capital exceed risk- and time-adjusted costs of capital.
Some of the performance assessment metrics that were previously addressed are able to calculate an estimate of the generated value for the shareholder, thus overcoming a few limitations of traditional indicators. However, such metrics did not provide enough information on capital allocation according to the income that can be generated, because of risk to which the institution is subjected. Therefore, by using risk-adjusted performance assessment measures, the institution can make decisions on a different level while always maintaining the concept of value creation for the shareholder. Such measures provide information in order to maximize return for a certain risk level, or, to minimize risk for a certain return level.
The present study focuses on Risk-Adjusted Return On Capital (RAROC) because it is the metric that provides a coherent aggregation of factors such as capital, return and risk and their balance, which is the main challenge for banks. Nevertheless, there are other risk-adjusted performance assessment metrics that derive from RAROC, such as Return
15
on Risk-Adjusted Capital (RORAC)5 and Risk-Adjusted Return on Risk-Adjusted Capital (RARORAC)6.
Value at Risk (VaR)
According to the technical document drawn up in 1996 by J.P. Morgan/Reuters7, which covers risk assessment measures, VaR is seen as a measure of the potential maximum value variation of a financial instruments portfolio having a certain probability over a predefined horizon. Ferreira (2006) also agrees with this definition because, in this author's point of view, VaR can be defined as the maximum expected loss on a certain financial instruments portfolio over a certain period of time and a predetermined confidence interval, allowing to measure exposure to the several risk groups in normal market conditions. As such, and taking VaR into account, institutions must have sufficient own funds to sustain a probability of loss.
The VaR methodology was used at first to measure market risk and it is currently used as well to measure credit risk and operational risk (Jorion, 2007:28).
In practical terms, financial institutions must meet several qualitative requirements so that the VaR method is in line with the Basel Committee requirements:
• Financial institutions must prove that they have appropriate risk management procedures destined to control risks originating from the implementation of credit risk reduction techniques, by linking such procedures with management decisions.
• They are required to regularly perform stress tests. Additionally, in terms of organizational structure, they are required to establish an independent risk management department.
After meeting these criteria, the institutions are capable of calculating their risk positions by using internal methods, such as VaR, which should be based on the
5 In this methodology, capital is adjusted to risk through maximum loss potential, based either on the probability of future returns, or on the volatility of results, as opposed to RAROC, where the result is adjusted to risk based on expected losses.
6 This methodology links RAROC to RORAC. It adjusts risk not only to results, as seen in RAROC, but also to capital, as seen in RORAC. In other words, it combines both measures in order to not only adjust results to risk, but also to adjust capital to risk.
7
16
following quantitative inputs8: 99% confidence level; A settlement period of 10 days, or 2 calendar weeks; An effective historical observation period of at least one year, except where a shorter observation period is justified by a significant increase in price volatility; Quarterly data updates.
There is a wide number of methodologies used to calculate VaR, and they can be divided into two major groups – non-parametric models (Historical Simulation and Monte Carlo Simulation) and parametric models based on parameterized distributions.
The present investigation work will not address any of the above methods because they are not necessary to understand risk-adjusted performance assessment measures.
VaR is a great aid instrument for managers since it allows an aggregated view on the institution's risk profile, as well as on their operations. However, it also has a few problems, such as: its difficulty to accurately calculate some probabilities; the fact that rather subjective situations must be assessed; and also the fact that, in the assessment of VaR, normal distributions are assumed when the occurrence frequency and distribution are unknown. Also, during financial crises, the VaR estimate can become distorted because of significant volatility, which is a typical factor in situations of financial crises, putting to question the effect of the correlation between prices and liquidity risk.
According to Marrison (2002), other limitations inherent to VaR come from the fact that, in this measure, variances and the correlations between market risk factors are assumed to be stable. Moreover, VaR does not provide a good description of excess losses over ninety nine percent, and it does not take into account the holding of illiquid instruments for additional risk.
• Risk-adjusted return on capital (RAROC)
The RAROC methodology has been developed in the 1970s by a working group of the Bankers Trust. The aim of this methodology was to measure the bank's loan portfolio risk, as well as to assess the amount of equity needed to limit the exposure of depositors to a given probability of loss (James, 1996: 3). RAROC is currently seen as a metric assisting on decision-making in institutions at a financial level, and its main objective is ensuring that the return of operations is in accordance with the assumed risk. RAROC
8
Available at: http://www.bportugal.pt/sibap/application/app1/docs1/avisos/textos/5-2007a-c.pdf, viewed 15th July 2015.
17
can be used to achieve several goals, such as: a more efficient capital allocation; performance assessment of the various operations; determining different spreads for credit operations according to expected losses; determining the type of (collateral) guarantees provided, and comparing profitability of several business segments.
Another important advantage of this method is the fact that it allows to link managers' performance assessment with their respective awards. In order for this to happen, a manager-oriented risk-based performance compensation model must be outlined because, when considering risk-adjusted capital profitability, the manager will be compensated not only for maximizing profitability but also for minimizing risk.
After the development of the RAROC methodology by the Bankers Trust in 1970, several studies were carried out, aiming to perfect its calculations to obtain a more consistent methodology. The original formula suggested by the Bankers Trust was pretty simple, and the resulting variations are also simple. The complexity of this methodology is not based on its formula, but rather on the definition of the variables of which it is composed. Assessing expected loss (EL) and unexpected loss (UL) for capital allocation requires a specific statistical treatment and a rather consistent database.
According to M. Prokopczuk et al. (2004), RAROC was defined by the Bankers Trust as:
(2.1)
This author questions the original formula shown above, because according to this formula, the expected loss is subtracted from return and is not risk-adjusted, and, if the loss is expected and if there is no risk, such risk would have already been eliminated. Another reason why this author questions such formula is the use of the term equity capital, since nowadays social capital does not exist, and what does exist is economic capital. Thus, he proposes the following formula:
(2.2)
According to M. Prokopczuk et al. (2004: 4), economic capital is based on the amount of money necessary for the bank's survival under the most adverse scenario possible, as
18
opposed to considering economic capital as the required regulatory capital, or even as the corresponding equity capital. The use of the VaR model is proposed in order to measure the maximum amount of capital that can be lost in a certain period of time and for a certain confidence level.
Thus, the original formula is expressed as follows:
(2.3)
The denominator of the fraction represents economic capital (based on three risk factors: market risk, credit risk and operational risk), adjusted to the risk obtained from Value at Risk (VaR). In other words, it is the amount of capital needed to cover unexpected losses with a certain level of statistical confidence and over a certain period of time.
As far as expected losses are concerned, they are the kind of losses with which banks deal, by adjusting the price of operations and transactions in order to cover the risks involved. Hence, such losses are usually compensated by operating profits.
Expected losses can be obtained through the product of the exposure at default, times the probability of default, times the loss-given default, i.e.:
(2.4)
Unexpected losses (UL) can be calculated through the following formula:
(2.5)
The numerator reflects the adjusted expected return for a one-year funding, which is partly or wholly reflected on the following expression:
(2.6)
Where,
Spread: is the direct result from credit to be granted, i.e., the difference between the
credit interest rate and the bank's funding cost 9;
9
Funding is the interest rate paid by the financial institution in order to obtain the funds that shall be injected in its business. A low funding cost shall produce higher incomes when such funds are channeled
19
Fees: are the specific fees to be charged by credit granting, over a year. They are added
to this result in order to obtain a global result of the operation concerned;
Expected Loss (EL): is the product obtained from exposure at default (EAD), times the
probability of default (PD), times the loss-given default (LGD);
Operating Costs (OC): are the costs incurred by financial institutions during the whole
process of analysis, monitoring and operationalization of financing over a year. Such costs are difficult to calculate;
: represents marginal tax rate.
According to Schroeck (2002: 244)," RAROC is a single-period measure, since economic capital is usually calculated at the one-year horizon, such as risk-adjusted return, which is also determined during such period.” However, most of the banking operations are formalized over several years. RAROC can also be used as a multi-period measure, calculated in the two, three, or four-year horizon, but such calculation hence becomes more complex. This subject can be analyzed in more detail in Marrison (2002: 334-335).
This methodology is grounded on other assumptions, such as: comparing RAROC to the institution's hurdle rate10 (minimum rate of return: cost of capital + risk premium) in every operation; and the fact that any operation that is below this rate should be enhanced with more guarantees so it can cover potential unexpected losses. This hurdle rate is fixed by the senior manager, taking into account the expected return that business units, agencies and branches should reach for using a certain capital from the bank.
Hence, financing under RAROC can be calculated as follows:
(2.7)
for short- and long-term financings to borrowers. One of the main profits of funding is the difference between the interest rate paid by the financial institution to finance itself and the interest rate paid to borrowers.
10
The minimum rate of return required by the investor for an investment or project, so that incurred risk is compensated. The bigger the risk, the bigger shall be the risk premium.
20
Once RAROC is calculated and if its value is higher than the defined Hurdle Rate, the loan should be granted since it will create value; alternatively, the loan should not be granted if the resulting value is lower than the minimum rate of return.
Taking into account this transformation of RAROC into economic returns, it becomes easy to prove that in order to assess if a transaction will create or destroy value, one only needs to compare the calculated RAROC with the hurdle rate (minimum rate of return) of the financial institution. This rate reflects the institutions' cost of funds and opportunity cost of equity capital. If an operation's RAROC is higher than the hurdle rate (minimum rate required by shareholders for the return of their investment), then the transaction shall create value for the institution and it should be made, by allocating capital to the business. If RAROC is lower than the hurdle rate, then the transaction shall destroy value and it should not be made (Schroeck, 2002).
In conclusion, RAROC is a tool that aids in the process of decision-making regarding risk-taking, allocation of limits, risk management analyses, adjustment of the pricing of operations, capital management and portfolio performance management. RAROC also allows access to crucial information for the realization of the capital management plan, for assets management and for the management of an organization’s incentive systems. This risk management solution, however, should not be considered on its own. It should be integrated in a wide solution of monitoring and risk management.
21
Chapter 3 - Empirical Study
This chapter provides a detailed description of the calculation of the RAROC metric. This study was based on hypothetical values, and as such, the presented values are purely illustrative. Therefore, the loan amounts, the probabilities of default, the loss-given defaults and the exposures at default were determined in order not to reflect the strategy of any Financial Institution.
3.1.
Sample description and analysis of the
underlying variables
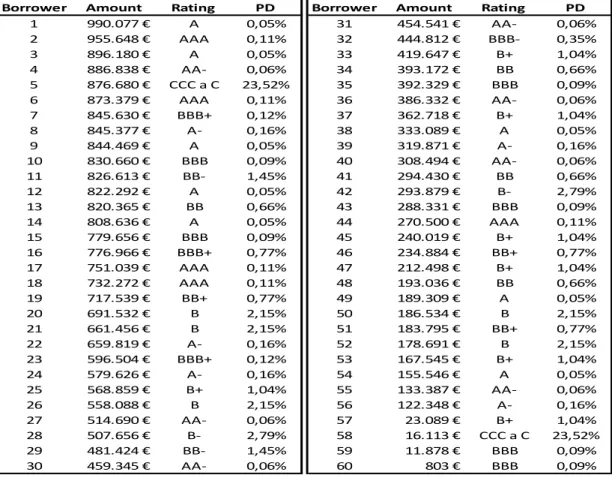
Given the assumptions stated above, we have recreated a credit portfolio composed of a hypothetical sample of 60 borrowers. The value of the financings varies randomly, ranging from 1 to 1,000,000 euro, with different credit ratings, and these ratings are in accordance with the Fitch Ratings classification. Different probabilities of default are associated to each borrower. Subsequently, we had to formulate probabilities of default (PD), loss-given default (LGD) and exposures at default (EAD) to obtain the expected losses (EL) and the unexpected losses (UL), as well as the economic capital needed to calculate RAROC. After determining the RAROC value, it shall be compared to the defined Hurdle Rate (which is also hypothetical): if RAROC exceeds the hurdle rate, there is value creation, and, alternatively, if RAROC is lower than the hurdle rate, the financing should not be granted since it would destroy value from the financial institution.
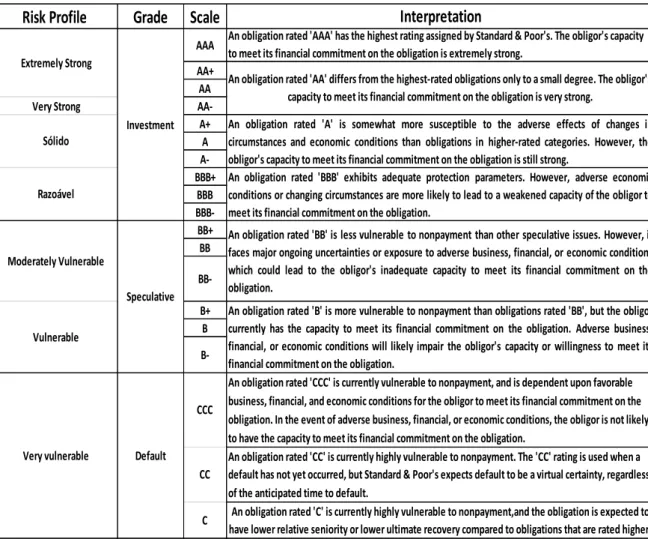
Taking these steps into account, a random loan amount was given to each borrower. Such loan amounts were borrowed from the banking institution and had a credit rating in accordance with the credit ratings shown in Table A.1, in Appendix I.
Subsequently, in accordance with the credit rating, each borrower was linked to their respective probability of default (PD), which was extracted from Table A.2, in Appendix I, at a one-year horizon. Table A.3 was consequently created, which is also in Appendix I.
22
Hence, for example, if a borrower is BBB-rated, the probability of default associated to the respective loan is approximately 0,09% per year. However, if a client is CCC-rated, the probability of default will increase to 23,52% per year.
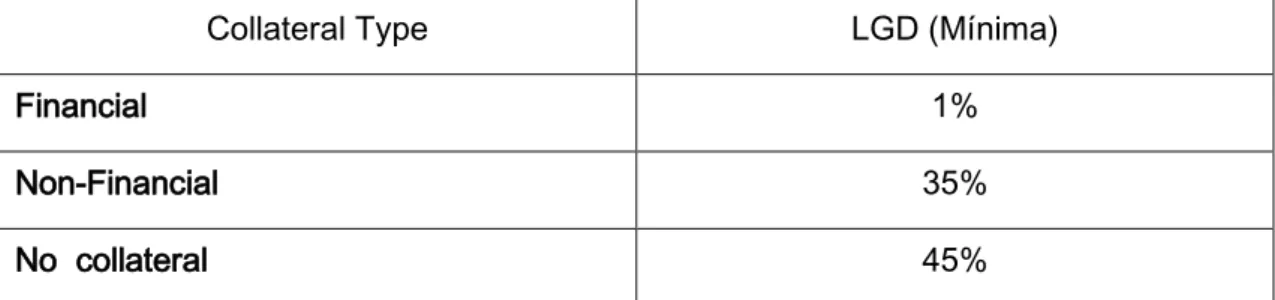
Once PD is obtained, we have to formulate LGD. To do so, we have to take into account the type of collateral (guarantee) given by borrowers. Such collaterals are divided into three categories: financial collateral, non-financial collaterals and no collateral (if the lender entity, when making the financing assessment, decides to decline any type of collateral from the borrower).
Financial collaterals are financial guarantees provided by borrowers. Such collaterals are mainly financial assets, such as term deposits, funds, shares, complex financial instruments or other, contracted in the institution itself (or other), which will serve as a guarantee for the repayment of credits.
Non-financial collaterals are not financial assets. They are usually known as mortgages on immovable property or real guarantees, but personal guarantees (bonds, endorsements, among others) are also included in this category. Lastly, loans that require no collateral are contracted without any associated guarantee.
As seen in Table A.4, in Appendix I, each type of collateral is assigned to a different risk weight. In compliance with the type of guarantee provided by the borrowers, the LGD needed for the calculation of expected loss will hence be equal to its corresponding risk weight.
Lastly, EAD, or exposure at default, was assumed to be the exact amount of the loan, given that, at the time of default, the financed capital that is exposed at default is 100% of the loan amount. This is the debt that should be considered to determine RAROC, in order to ascertain whether the operation created value for the Institution.
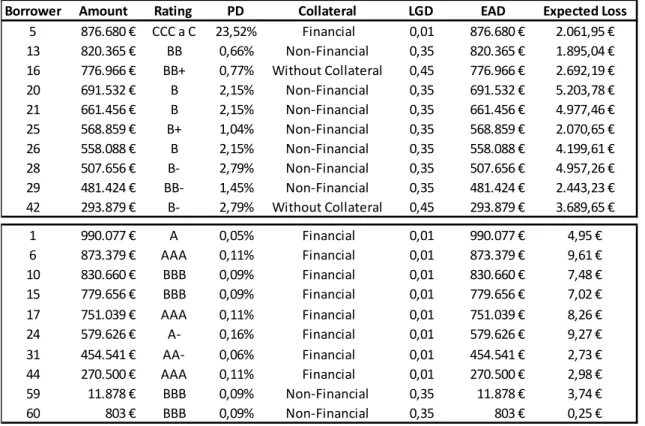
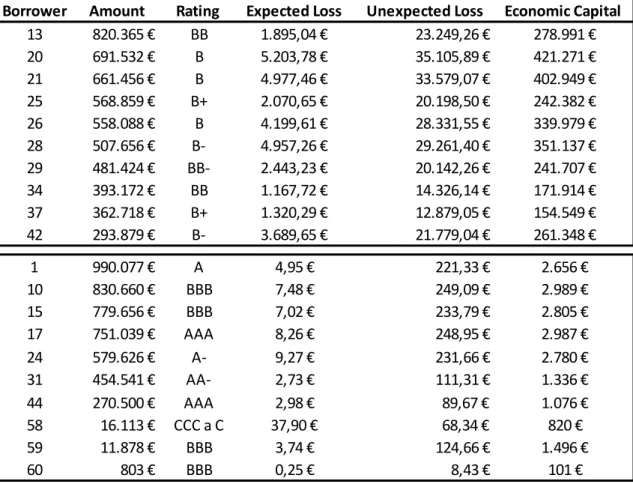
What resulted from such calculations, after a practical approach, were the expected losses of the 60 financings as presented in Table A.5, in Appendix I. After analyzing the above Table, we can understand that uncollateralized loans, and loans secured by non-financial collaterals whose credit rating is within the lowest rates, such as BB, BB-, B, B- and CCC, are the ones with the biggest expected losses, since they refer to borrowers
23
that are more likely to be in default, and, also, because of a lengthy credit recovery process due to its associated collateral. Alternatively, loans secured by financial collaterals and whose credit rating is within the highest rates, such as AAA, A and BBB, are the ones with the lowest expected losses, even if, in some cases, the amounts of such loans are large, as we can see in Table A.6, in Appendix I.
The next step is analyzing unexpected losses, which are directly linked to the uncertainty surrounding banking activity, and are originated by unanticipated events. This analysis is given by the losses' standard deviation, which can be obtained through the VaR methodology, as follows:
(3.1)
where,
- Represents the standard variable Z with normal distribution, which depends on the desired confidence level;
- Represents the standard deviation of the client's probability of default, given its credit rating. Where:
(3.2)
LGD represents loss given default;
EAD represents exposure at default.
It is also important to mention that in the present study the existing correlation between different credit portfolios and business lines was not taken into account, even though some authors state that the denominator of the RAROC equation should take that correlation into account. In order to do so, a new parameter should have been introduced in the calculation of unexpected losses. Such parameter would be which represents the correlation between expected return of the risk asset and market portfolio 11.
11
Saunders (2010: 235) specifically states that James (1996), Crouhy, Turnbull and Wakeman (1998) and Ho (1999), have introduced the variable, which represents the correlation between the expected
24
By excluding such correlation and taking the Banco de Portugal guidelines into account, a confidence interval of 99% was used, which leads the variable to assume the value of 2,326, as referred in the normal distribution table, in Appendix I. And, after applying the equation in 3.1, we have obtained the result of unexpected losses for each borrower, which is shown in Table A.7, in Appendix I.
After analysing Table A.7, we can conclude that the highest unexpected losses, between the range of 35,105,89 euro and 30,561 euro, will occur for borrowers no. 20, 21 and 16, respectively. In such cases the associated collateral is non-financial or there is simply no collateral, which represents a 0,35% and 0,45% LGD respectively; and, in such cases, the credit ratings are the lowest, which implies higher probabilities of default, which in turn present higher standard deviations, giving then origin to also higher unexpected losses. In contrast, the lowest unexpected losses will occur mostly for borrowers having higher credit ratings, therefore having lower probabilities of default. Such losses range from 8 euro and 249 euro, for pretty high loan amounts, with the exception of borrower no. 58, that in spite of having a rather vulnerable credit rating (and therefore a higher standard deviation), this borrower is covered by a financial guarantee, and so has a low unexpected loss, as shown in Table A.8, in Appendix I.
After calculating expected and unexpected losses, we are then able to calculate risk-adjusted return of each operation of the 60 analysed borrowers. As such, the need to calculate a few variable arose, such as: i) Spread to be applied to each operation; ii) The underlying fees; iii) Operational costs inherent to the processing of each operation.
This study is based on purely hypothetical data, and so, when determining spread, we needed to take into account the value of the interest rate (including the potential risk) to be charged from each borrower, as well as the interest rate the Institution needs to pay for obtaining deposits from its savers. We have then arbitrarily established that such interest rate would be 1,25%, for the obtaining of such deposits.
return of the risk asset and market portfolio , where . Hence, the calculation of unexpected losses would be given by . However, the calculation of RAROC under this model contains a few flaws, which were identified by Saunders (2010: 236), and so the variable shall not be taken into consideration in this study.
25
The underlying fees of each operation were calculated by adding together the variables shown in Table A.9, Appendix I. Such fees were taken from price lists of a few financial institutions:
For operational costs, it was necessary to determine the number of operations carried out in the Institution, as well as the value of annual operating costs, so as to find an imputed rate to be applied to each loan of this study. We have assumed a rate of approximately 0,0135%. The value to impute from operational costs from each borrower is equal to the value of the imputed rate multiplied by the amount requested, i.e., the loan amount.
After collecting all these data, we have then calculated the risk-adjusted return of every operation. Such calculation is obtained by adding spread and fees, and then, by subtracting expected losses and operational costs. The results of such calculation are shown in Table A.10, in Appendix I.
After analysing this Table, we were able to obtain some data: the loans that have a higher return are those that also have the highest debt at the date of analysis, because of the borrowers' creditworthiness and risk profile (defined in Table A.1), which ranges from very solid, to solid, to reasonable, and this translates into a lower expected loss, as well as a lower unexpected loss. In contrast, the loans that have a lower return for the Institution are, for the most part, those within a risk profile ranging from moderately vulnerable, to very vulnerable, as shown in Table A.11, in Appendix I.
In Table A.10, as far as spread is concerned, we can ascertain that its application varies with the amount and the applied guarantee, ranging from 0,65% to 5,65%. The highest spreads are, for the most part, associated to low amounts, which means that the profit from these operations to the Institution comes mostly from fees to be paid by borrowers, since the Institution hardly benefits from the difference between the rate charged for the loans and the rate it pays when borrowing funds.
After the calculation of risk-adjusted return, we have calculated the risk-adjusted economic capital needed for each operation.
26
It is important to remember that economic capital is the capital needed to cover unexpected losses, with a certain level of statistical confidence, for a set period of time. After the entry into force of Basel II, Credit Institutions were forced to determine the needed minimum capital requirements, based on their own specific reality, taking their credit portfolio and other specific criteria into account so as to cover credit, market and operational risks. Hence, for this calculation, the guidelines of the Basil committee have been taken into consideration, where economic capital (CE) is obtained through a product of a minimum multiplier, times unexpected losses, using the following formula:
(3.3)
We have applied this equation and, consequently, we have made tables to show the results, such as Table A.12, in Appendix I, and Table A.13, also in Appendix I, where we can ascertain that economic capital is higher for lower credit ratings, and, also, we can ascertain that the unexpected loss is higher, thereby confirming the direct relationship between the three indicators (risk profile, loan amount and unexpected loss) with the economic capital needed for the operation. For example, borrower no. 20 is the one who needs more economic capital, and this borrower has a credit rating of B, where 421.271 euro of economic capital to be spent is more than 60% of the loan amount. In contrast, borrower no. 17, having a credit rating of AAA, which is considered to be extremely solid, needs to spend 2,987 euro in economic capital, which is only 0,40% of the loan amount. This borrower's unexpected losses are insignificant when compared to borrower no. 20, because, in percentage terms, the unexpected losses are approximately 0,03% of the loan amount.
On the other hand, borrowers having higher risk profiles, with the exception of borrower no. 58, presented relatively low unexpected losses of approximately 0,03% of the amount of the loans, which translates into rather insignificant values of economic capital allocation needed by the Institution.
From these calculations, we can then determine the risk-adjusted return on capital (RAROC) of each operation. It is important to keep in mind that the RAROC metric is determined through dividing risk-adjusted return by economic capital, which is also risk-adjusted.
27
Through this return we will be able to ascertain whether the operation should be carried out, because once it is compared to the minimum hurdle rate defined by the Institution, it is possible to make a financing decision based on the Institution's desired returns.
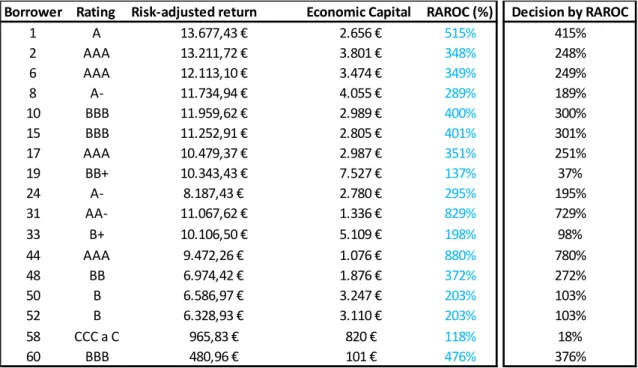
The following results were then obtained, which are described in Table A.14, in Appendix I. Regarding the 60 financings in this study, RAROC is below 100% in 72% of the financings, and above 100% in the remaining 28%. Only the latter loans should be approved because they would be able to add value for the Institution. Regarding the other 72%, the financing request should be rejected, or its base terms should be changed, since it would not create value for the financial institution. We can further ascertain from Table A.14, that financings having a lower economic capital translate into a higher risk-adjusted return on capital, and so we can induce that smaller capital needs are converted into decisions that create more value for institutions. If we take 100% from the values of Table A.14, we get the values that are showed in Table A.15, only containing the value associated to RAROC.
We can conclude that borrower no. 44 is the one giving more return to the Institution, with a RAROC of 780%; whereas borrower no. 58 gives the least return, with a RAROC of 18%, but it is still above 100%.
Lastly, it is necessary to reanalyze each loan to check if the decisions taken previously would be the same after being compared to the minimum hurdle rate, which in this case is 10%. As such, we have the results described in Table A.16, through which we can conclude that the loan request of borrower no. 58 should be rejected because it does not exceed the opportunity cost rate established by the Institution. In other words, we have deducted the 10% rate from the "Decision with RAROC" column, so we could reach a decision taking the hurdle rate into account. Because the resulting percentage is less than 10%, the above mentioned loan should be reanalyzed in order to make possible an increase of the respective return.
Hence, and following the same reasoning as Saunders (2002), if RAROC is higher than the hurdle rate, loans should be granted because they would create value; and, if RAROC is below the reference rate, the loans should not be granted, or, the Financial
28
Institution should take measures to increase the possibility of return associated with each operation, either through an increase in the proposed guarantees when assessing each financing, or through an increase of spreads that are associated with each operation, so as to strengthen the return of operations.
Regarding the reanalysis of borrower no. 58, several factors that were initially defined should go through a few changes, such as: considering the possibility of increasing the corresponding spread, requesting the strengthening of guarantees, reducing the borrower's exposure to risk or simply considering rejecting the operation.
29
Conclusion
The major objective of any company, as well as of Financial Institutions, is value creation. In order to achieve this goal, the need to implement value-based management systems arose, which allowed the development of new value-based performance assessment metrics. Along with such evolution, it became increasingly important to link risk management with value creation because of the growing need to measure the risks involved in the various banking operations, and also because it became necessary to meet the capital requirements of Basel II. From this point, new risk-adjusted performance assessment measures started to be develop, as opposed to traditional accounting and financial indicators that already were inadequate. Using such measures can optimize performance levels, based on a concept of profitability/risk, aiming to maximize return, given a certain level of risk.
This work presented many different measures, however, the risk-adjusted performance measure (RAROC) was the only measure analyzed in detail, so we could analyze its efficiency as a tool for the calculation, assessment and comparison, in an integrated way, of risk-adjusted performance, being consistent with the aim of an effective capital management and of value maximization for the shareholder.
From this study we are able to understand that the main advantage of RAROC is the fact that it is a tool for measuring performance and predicting capital, and thus it reflects the bank's concern on its overall risk by using economic capital (in its denominator). Moreover, RAROC (implicitly) calculates economic profit related to a transaction, including opportunity cost of capital, which is in itself an improvement when comparing it to traditional measures used to determine a transaction's value contribution.
The empirical study that was carried out allowed us to take conclusions and to determine which variables have a bigger effect on the results. As we can see in table A.16, only 26,67% of loans would create value for the institution; also, we reached the conclusion that borrower no. 58 would not be granted a loan, because such borrower does not prove to be able to adequately return the capital of shareholders.
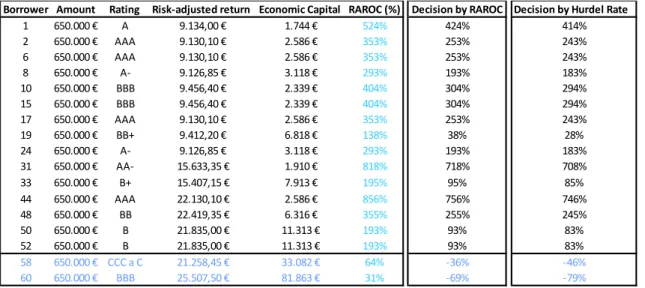
As far as influencing variables are concerned, it was possible to ascertain from the uniformity values test (presented in Table A.17), that the amount does not have a great influence on the results, which, while being different, lead to the same decision, i.e., the