Plenty of land, land of plenty: the agrarian output
of Portugal (1311 – 20)
A N T O´ N I O H E N R I Q U E S
Faculdade de Economia, Universidade do Porto,4200-464 Porto, Portugal, ahenriques@fep.up.pt Instituto de Cieˆncias Sociais, Universidade de Lisboa, Lisbon, Portugal
This article presents a benchmark for Portuguese agrarian output for the 1311 – 20 decade. This benchmark is built from the supply side using the value of church tithes combined with contemporary parish accounts. Two main findings emerge: first, per capita agrarian output was similar in the recently conquered South and the North, hinting that internal mi-gration after the Reconquista led to the equalization of marginal product across the country; second, that Portuguese real per capita agrarian output was above subsistence and higher than that of contemporary England and Wales. This result, which is robust to the assumptions used, confirms that by 1320 Portugal was a “frontier economy” with a high land/labor ratio and a high per capita output. This seems to reinforce the Malthusian theory that the amount of land per person was key in determining living standards. The article discusses the implication of these results for the inequality among nations.
1. Introduction
Inequality between countries has deep roots. Well before Europe surged ahead of the rest of the world, there was a subtle but steady divergence within the continent, as England and the Netherlands grew faster than their neighbors. This “Little” or “First Divergence” started well before the period of rapid technological advance that we know as Industrial Revolution. Recent reconstructions of national accounts from the late thirteenth century onward confirm that the First Divergence might have started as soon as the fourteenth century (Pamuk 2007). In fact, whereas Spain (A´ lvarez-Nogal and Prados de la Escosura 2013) and Italy (Malanima 2010) were at some point caught by growth stagnation and decay of living stan-dards, England and the Netherlands exhibit a nearly continuous growth trend (Zanden and Leeuwen 2011; Broadberry et al. 2012). These results have the effect of moving back the debate about the forces that underlie economic inequality between countries to 1300 rather than 1800 or 1500.
By 1300, however, after centuries of demographic and economic growth, European econ-omies appear to have been caged inside a tight Malthusian regime. This means that output increases translate as higher fertility and that, in the absence of technological advance, popula-tion growth leads to diminishing returns of labor as land becomes increasingly scarce. Thus, demographic growth above a certain standard of living triggers “positive checks” (higher mor-tality induced by declining living conditions) or else preventive checks (fertility restrictions). These forces contrive to keep real per capita output constant in the long run. While they faded away along with the Little Divergence (Nicolini 2007;Crafts and Mills 2009), available evidence indicates that by 1300 mortality still functioned as a positive check, i.e., that it responded to real wages (Kelly and O´ Gra´da 2013, p. 12).
European Review of Economic History,0, 1–22 # The Author 2015. Published by Oxford University Press on behalf of the European Historical Economics Society. All rights reserved. For permissions, please e-mail: journals.permissions@oup.com
There was, nonetheless, hope for fourteenth-century Europe.Voigtla¨nder and Voth (2013)
indicate that the Malthusian cage was unlocked by a specifically European mortality regime marked by “[high-mortality] great cities, pestilence, and war” (Voigtla¨nder and Voth 2013, p. 10). This is compatible with recent research on national accounts. Where the Malthusian trap was more severe, per capita output and real wages appear relieved by the Black Death (Malanima 2010;Broadberry et al. 2012). The alleged positive impacts of war were also con-firmed, albeit less directly byA´ lvarez-Nogal and Prados de la Escosura (2013, figure 7), who argue that the conquest of the Muslim-held half of the Peninsula contributed to a high-mark of real per capita output that would not be bettered until the nineteenth century. The Reconquista turned present-day Spain into a “frontier economy”, a country with a favorable land/labor ratio in a period when most European countries suffered from decreasing marginal returns.
In short, in a Malthusian context, it takes plenty of land to be a land of plenty. This article provides further evidence for this by estimating a benchmark for Portuguese agricultural output for the decade 1311 – 20. The case of Portugal, whose Reconquista ended in 1249, will test whether favorable land/labor ratios allowed indeed for better living conditions.
The second intended contribution is enlarging the number of countries that can be sum-moned to this debate. Assessing living standards and inequality between nations hinges on ac-curate and comparable estimates of per capita output for different countries. These are difficult to construct for earlier periods due to the scarcity of data and to the methodological challenges earlier sources create. Presently, not only the discussion is limited to a few countries but also it is mostly based on indirect, demand-side reconstructions, which pose overwhelming index pro-blems and rely mainly on real wages. Research is starting to take the alternative path of recon-structing national accounts from the output side. This was attempted for England from 1270 to 1870byBroadberry et al. (2012), who found evidence of per capita growth since the thirteenth century, contradicting the pessimism of earlier research based upon product and factor prices. Finally, the present benchmark represents a first step toward quantifying pre-1500 Portuguese economy. The views on the country’s long-term development have largely adopted the pessim-istic thesis drawn inter alia by the influential medievalist Oliveira Marques. For this school of thought, structural problems like inadequate natural resources, peripheral position, poor com-munications, and uneven urban development meant that agriculture struggled to provide the ne-cessary products. The Great Plague offered only a temporary respite to a poorly fed population living in a demographically saturated country. Post-Plague welfare gains would prove temporary, as the structural problems subsided and condemned Portugal to be on the wrong side of the European divergence (Marques 1978,1987).
The article is structured as follows. Section 2 will provide an overview of Portuguese agricul-ture and institutions c. 1300. Section 3 will present the available data and estimation methods used. Section 4 will show the implications of the estimates in a comparative context, while section 5 will discuss the robustness of the data and its compatibility with other evidence on living standards. Finally, Section 6 will resume the debate presented in this introduction and conclude.
2. Historical background
By 1300, contrary to most European economies where natural resources were stretched by centuries of population growth (Campbell 2008; Clark, 2010, table 18;Malanima 2009), Portugal could still be defined as a “frontier economy”, a labor-scarce rather than a land-scarce
agrarian economy. The capture of the Algarve by King Afonso III in 1249 culminated a swift advance through the southern plains that led to a 35 percent increase in the area of the kingdom in about three decades (1217 – 49). As a century (1147 – 1249) of nearly continuous war had driven a large share of the Muslim population away, conquered lands were thinly settled, when not abandoned. Large-scale migration to Muslim-held territory in Spain or North Africa followed the Reconquista and the Moors who remained under Christian rule were confined to one-third or one-fifth of arable land (Fernandes 2000;Barros 2007).
With the former occupants largely gone or dispossessed, the south offered a large space to Portuguese settlers. Given the absence of effective feudal restrictions on labor mobility, north-south migration ensued (Barbosa 1992, p. 169;Viana 2007). The settlement of the conquered lands was gradual rather than immediate as potential migrants had other options. In older lands, there was still scope for assarts and clearances in the first half of the fourteenth century. The crown waived privileges and promised self-government in order to attract new settlers to the string of fortified towns founded along the border with Castile. Thus, there was an eastward, as well as a southward, flow from the densely populated lands in the Northwest to the frontier. Both frontiers proved spacious enough to accommodate Portuguese and even foreign settlers. In 1340s, there was still room to found villages near the best wheat-growing lands (Viana 2007). In the 1320s, settlement of the new areas was still underway, especially in the south. In 1329, nearly a century after its conquest, the southwest could still be described as “a new land, with much room for improvement” (TT, Ordem de Santiago/Convento de Palmela, DR, 1, 25).
In a frontier economy, the availability of land is correlative to the scarcity of labor. This was the case of Portugal. As mentioned, labor flowed without much hindrance from northern Portugal to the east and south. Labor freedom opened up the possibility of equaling marginal product across the old and new lands. This appears confirmed by the proximity of annual wages in the densely settled northwest in 1253 (Marques 1971) and in a southern newly colonized village in 1271 (Saraiva 1997). Royal laws pressing down wages in 1211, 1253, and 1340 confirm at the manpower difficulties facing landowners well before the Plague.
The migrants from the north benefitted from large-scale distributions of arable plots in the new lands. This redistribution gave way to a new system of property rights and to municipal institutions with a strong element of self-rule (Esteves 2003). The municipalities founded in the conquered lands assigned unoccupied land to the incoming settlers, a process that con-tinued up to the mid-fourteenth century (Rau 1982). Municipal law, set in royal charters, pro-tected individual property rights and regulated the use of the commons. While subject to royal (or even seigniorial) authority and taxation, such towns had a measure of self-rule and offered an alternative to more forceful seigniorial jurisdiction (Mattoso 2001). Thus, to a large extent, institutions appear little influenced by feudal limitations. For instance, the customs of Santare´m, which expressly forbade seigniorial monopolies on mills, were applied to the entire kingdom by Afonso III (1248 – 79) (Gonc¸alves 1989, p. 168).
The ample availability of land for settlers went hand-in-hand with relatively low levels of ur-banization. In this respect, the Portuguese contrasted with the Spanish one. The Islamic urban network in Portuguese-held territory was peripheral: neither Lisbon nor Santare´m had been Muslim capitals. Beja and E´ vora and the ports of the Algarve (Silves, Faro, and Tavira) had at some point been capitals or city-states. All these were considerably smaller than the main Muslim cities such as Co´rdoba, Seville, Toledo, Valencia, or Zaragoza. The Reconquista further disrupted the links with these centers. As Portuguese trade veered toward the Atlantic, commerce with Castile was severed. These differences show up in Portuguese and Spanish urbanization rates c. 1300, with the latter being one of the highest in Europe and the former below average (Malanima
2009, p. 245). Most of the one hundred or so municipal towns (vilas) were essentially administrative
and military. These municipalities erected barriers to trade and show few signs of economic special-ization. Thus, on the whole, Portuguese urban networks offered few demand-side stimuli for its agriculture. This was compounded by the limited importance of the wage economy, in a country where access to land either through ownership or lease knew few limitations.
3. Data
It is possible to reconstruct Portuguese per capita agrarian output for 1311– 20 by combining data from different sources. For the sake of clarity, Section 3 was divided into four parts: Subsection 3.1 presents the relevant sources, Subsection 3.2 estimates tithe revenues from this evidence, and the two remaining subsections convert tithes revenues in output (Subsection 3.3) and per capita output (Subsection 3.4).
3.1 Sources
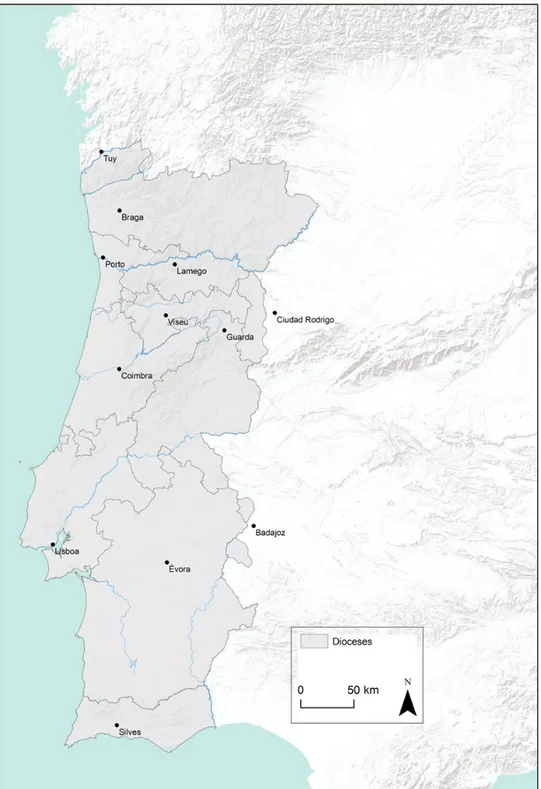
Total tithe revenues for 1311 – 20 can be obtained by combining the taxatio, an extraordinary source that contains the assessment of the revenues of all Portuguese parishes in 1320, with a few roughly contemporary tithe accounts at parish level. The taxatio was compiled on demand of Pope John XXII, who had agreed in 1319 to grant to the King of Portugal a tenth of all the ecclesiastical benefices within the kingdom. The assessment (taxatio) of the benefices was conducted by an English prelate along with two native clergymen, who valued the revenues of the 2,768 ecclesiastical benefices of the realm, including 2,423 parish churches (figure1).
The troika was careful enough to avoid double-counting by distinguishing the different recipi-ents of each benefice and was instructed to lighten the burden of poorer benefices (Boissellier 2012, p. 125). Conveniently, all assessments are expressed in money of account (Portuguese
libras) and stand for the average revenue of the ten preceding years, a very considerate gesture toward future historians. This source was recently re-edited byBoissellier (2012).
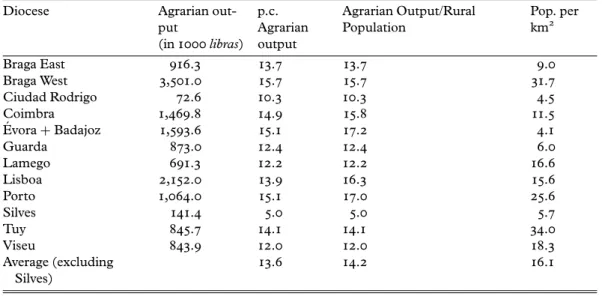
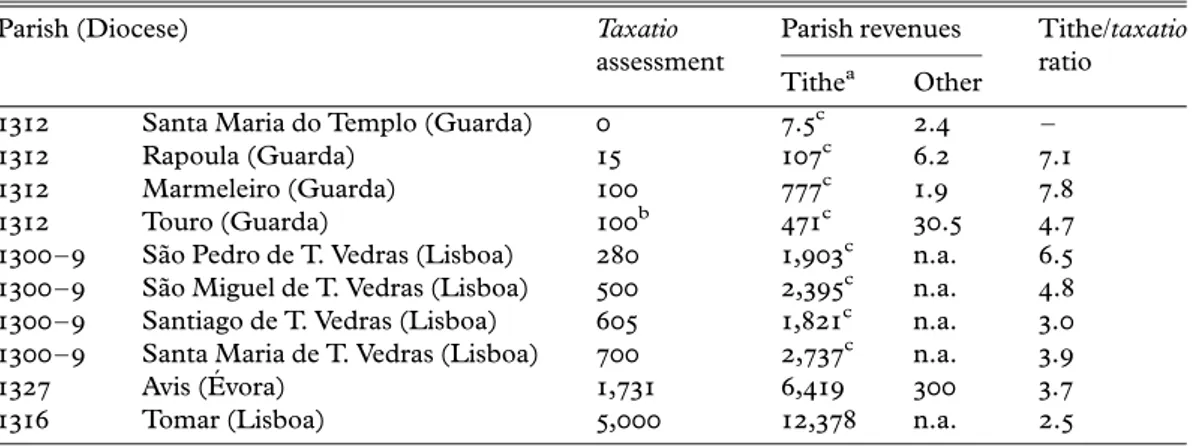
In contrast, accounts indicating the tithes collected at parish level are very hard to find. Searches in archives and in published sources only rendered accounts for ten parishes in the period 1309 – 27. Six accounts relate to churches belonging to military orders and, accordingly, record only the patronal share of the tithes. Of these, five were found inside a later copy of the accounts of the extinct Knights Templar (see figure2), while the sixth source was recently
identified (Oliveira 2012). An enquiry on the production of the lands disputed by rival parish churches in Torres Vedras in 1309 provides the remaining four accounts. This enquiry was published byJohnson (1970) and its data were worked byLopes (1966). Unlike the other accounts, this one indicates the total, i.e., pre-tithe, output. The data from these sources are systematized at table A1, with all payments in kind converted to Portuguese libras, using 1311– 20 prices.
3.2 From taxatio assessments to the tithe
Essentially, the present reconstruction of the total tithe in the kingdom combines the variation of parish assessments in the kingdom (given in the taxatio) with the volumes provided by contemporary tithe parish accounts. This method is based upon three assumptions about ecclesiastical taxation in fourteenth-century Portugal.
Figure 1. The dioceses in Portugal, c.1320 (approx. limits). Cartography by Cla´udia Viana.
The first assumption is that tithes provided the bulk of parish revenues, like elsewhere in Europe (Viader 2010, pp. 17 – 8). Thus, the variation within the taxatio reflects the variation in the tithe collected rather than rents or other patrimonial revenues.
The second is that the assessment of each parish shown in the taxatio is lower than one-third of the actual tithes collected. In fact, parish clergy only retained a share, typically one-third, of the gross tithe in order to maintain their livelihood, as prescribed by cannon law (Viterbo 1966, II, p. 171), and pay the taxes and fees owed to the bishop (Costa [1959] 1997 – 2000;Vilar 2007). The bishop or chapter collected yet another third, while the remaining one was assigned to the church patron who, in theory, had to pay for the cult expenses and conservation works (Vilar 1999;Almeida 1910 – 28). Thus, parish benefices obtained one-third of the tithes, at best.
The final assumption is that the assessments of the parishes followed a progressive rationale. This is clearly stated in the papal instructions to the troika, who was urged to assess only net revenue (i.e., discounting episcopal taxes that vicars were liable to) and to proceed with “just and equal moderation” in order not to overload poorer benefices. This made sense, as expenses with the buildings, the cult or the sustenance of the vicar did not decrease according to the size or wealth of the parish. Moreover, the marginal utility of the revenues was greater for the holders of poorer benefices.
The comparison of the values obtained from parish tithe accounts with those taken from the taxatio (see table A1) fully confirms these observations.
First, parish accounts show that the tithe dwarfed the remaining sources of income (land rents, alms, and fines). The strong correlation between the tithe collected in these parishes and their taxatio assessment (r2
¼ 0.9668) confirms that the variation of parish assessments hinges upon the variation of the tithe.
Second, as anticipated, tithe revenues are a multiple of the parish evaluations in 1320. In fact, this multiple is considerably larger than three. Tomar is the proverbial exception that proves the rule because, as a nullius diocesis territory, it did not share its tithe with the local bishop.
Finally, the accounts attest that the assessments of wealthier parish benefices was in fact more severe than those of the poorer ones, as stated by the papal instructions. Seemingly, the concern with poor parishes took the form of progressive assessment rates. This should not come as a surprise given that concepts like net/gross, marginal utility, and even poverty thresh-old (estimated at 80 libras by the archbishop of Braga in 1296;Repas 2003, doc. 149) impreg-nated ecclesiastical taxation.
Given that the troika under-assessed poorer parishes and that benefices were a fraction of the tithe, the tithe was more than three times the taxatio. In order to convert the values of the taxatio into the total tithe, we inferred a functional relationship between the assessments (x) and the rates at which they were taxed (y) in our sample (table A1). Using the best fit for this regression, we obtain a curve that roughly (r2
¼ 0.6738) captures the relationship between these two vari-ables. With this regression we can predict the annual total tithe by adding up the predicted values of all the 2423 parish assessments. Thus, the predicted value of the annual tithe collected in Portugal during the 1311 – 20 period is 1.5 million Portuguese libras.
3.3 From the tithe to output
It is realistic to use tithe revenues as a basis for estimating agrarian output in fourteenth-century Portugal. In fact, the underlying rationale of the tithe was that all fruits of nature ought to be tithed in order to acknowledge that nature was lent to man by God (Henriques 2013). Thus, tithes tapped essentially outputs (e.g., animal offspring) and left out inputs (e.g., breeding animals). As ordered by the archbishop of Braga in 1304, tithes ought to be paid gross,
“without allowing for expenses” (Viterbo 1966, pp. 247 – 8). There was no exemption for self-consumption or rent and both the market-oriented products (grain, livestock, wine, and olive oil) and the goods produced and consumed within the household were tithed. The centralizing efforts of the bishops led to the adoption of a common set of rules regarding the collection, man-agement, and division of tithe revenues throughout the realm, including making royal, church, and noble lands liable to the tithe (Vilar 1999). Muslim population was an exception insofar as it paid the tithe to the king rather than to the church (Barros 2007).
However, the simple ten-fold multiplication of the total tithe does not amount to either net or gross agrarian product. Commodities were tithed, i.e., divided by ten, at different stages of their production process. Grain was tithed gross of seeds and, hence, tithe revenues on the arable sector tapped more than one-tenth of net output. The same can be said of the sectors in which the tithe fell on finished products, i.e., on wine and olive oil, rather than on grapes and olives. In contrast, the tithe paid by the pastoral sector was considerably less than one-tenth of the output. In fact, this tax fell on the output of the livestock, that it to say, offspring, dairy products and wool. This cri-terion left out the lion’s share of this sector: animals slaughtered for meat.
The shares of net output taken by the tithe in the main agrarian commodities can be quan-tified (Henriques 2013, p. 86). The tithe on grain tapped 12.5 percent of the value of arable output. Tithes on wine and olive oil were less severe, as they stood for 10.3 and 11.1 percent, respectively. Finally, tithes on livestock took only modest shares of the production (2.7 percent for bovines, 3.4 percent for swine, 4.5 percent for sheep, and 5.5 percent for sheep). By combining these coefficients with the shares of these sectors in the agrarian product (see table A3), we find that tithes tapped 10.75 times the agrarian output. Hence, the coefficient required to obtain the agrarian output from the total tithe revenues is 9.3 (the inverse of 10.75) rather than 10. This means that Portuguese agrarian yearly output in 1311 – 20 amounted to some 14 million libras.
3.4 From output to per capita output
Total net output becomes meaningful when divided by population. The most consistent ap-proach to this variable remains that by Mattoso, who proposed a total population of 700,000 souls for 1290. His method was to apply to the whole kingdom the ratio between notaries public and the demographic density in a vast area for which there was reasonable demographic information (Mattoso 2001, pp. 14 – 8). Mattoso admitted that his figure was “almost certainly too low”. In fact, the implied population density (7.8/km2
; 4.8/sq. mile) is about half that for contemporary Scotland as estimated byCampbell (2008, p. 927). However, Mattoso’s method returns a population slightly over one million if corrected using new research on the actual numbers and distribution of all the notaries public (Sa´ Nogueira 2008) and eliminating some major empirical flaws. This figure, which implies a population density of 11.4/km2
and a per capita agrarian output nearing 14 libras, appears far more reasonable. The full results and a more detailed discussion of this issue can be found in table A4.
4. Main results
Two main findings emerge from the present estimates. The first finding is that labor seized the opportunities opened up by the Reconquista and migrated south, thus postponing decreasing returns. Second, that Portuguese per capita agrarian output was considerably higher than that in England, a country struggling with an oversupply of labor.
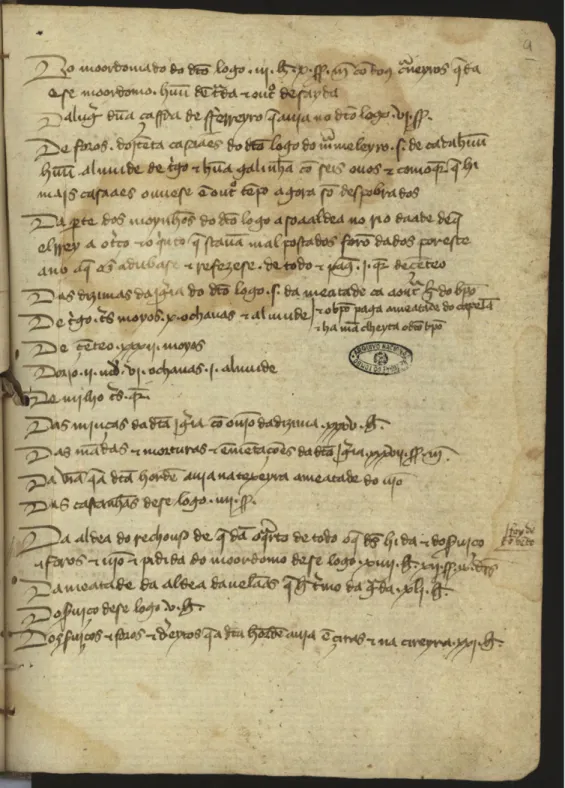
The regional distribution of gross and per capita agrarian output is shown in table1. These
estimates can be complemented by a rough measure of productivity. In the absence of any detailed data on workforce distribution, a straightforward method is dividing output by rural population, assuming that all population from “urban” (i.e., .5,000 inhabitants) centers worked in services or industry. The estimates compiled in the Atlas de Cidades Medievais (Marques et al. 1990) allows us to calculate urban population. Naturally, this only provides a rough indicator as the identification of “urban” and “non-agrarian” does sit well in southern Europe where large “agro-towns” exist, reflecting the concentration of landowners rather than agricultural surplus: Santare´m, the archetypal “agro-town”, had about the same size as Porto, a service- and manufacture-dominated borough (Viana 2007;Melo 2009).
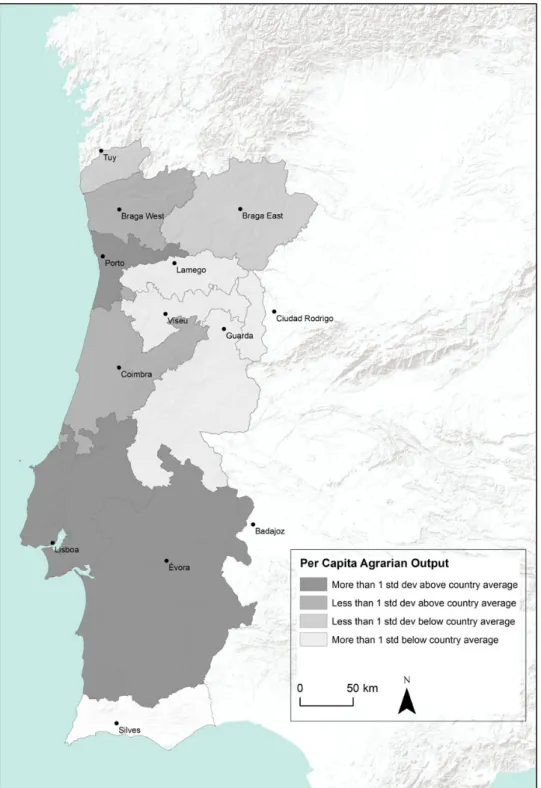
The per capita data appear more realistic and intelligible if the diocese of Silves is excluded. The parish network of this recently conquered territory was still very loose (only nine parishes) and it concentrated the Muslim minority (whose tithe was paid to the king rather than to the church). With this exception, the distribution of agrarian output is coherent with the “frontier economy” theory. The diocese of E´ vora, which covered most of the new territory and had the lowest density, has the highest per capita agrarian output, with Lisbon, which also comprised recently occupied territory, not far behind. On the whole, however, differences are slight. The balanced distribution of per capita agrarian output implies that the movement of labor toward new territories led to the equalization of marginal products across the kingdom. Per capita output in densely settled (Braga West, Porto, and Tuy) was not far behind. Freedom of movement meant that surplus workers could relocate to the south in order to obtain land and/or better wages (figure2).
As with most mainly agrarian economies, the observed inter-regional variation can be attrib-uted to geographical factors. Per capita agrarian output was lower in the landlocked highlands in the interior (Lamego, Viseu, Guarda, and Ciudad Rodrigo) and, to a lesser extent, in the eastern side of the archdiocese of Braga and in Tuy. These overwhelmingly rural dioceses
Table 1. Regional distribution of agrarian output in1311–20 in Portuguese libras
Diocese Agrarian
out-put (in 1000 libras) p.c. Agrarian output Agrarian Output/Rural Population Pop. per km2 Braga East 916.3 13.7 13.7 9.0 Braga West 3,501.0 15.7 15.7 31.7 Ciudad Rodrigo 72.6 10.3 10.3 4.5 Coimbra 1,469.8 14.9 15.8 11.5 E´ vora+ Badajoz 1,593.6 15.1 17.2 4.1 Guarda 873.0 12.4 12.4 6.0 Lamego 691.3 12.2 12.2 16.6 Lisboa 2,152.0 13.9 16.3 15.6 Porto 1,064.0 15.1 17.0 25.6 Silves 141.4 5.0 5.0 5.7 Tuy 845.7 14.1 14.1 34.0 Viseu 843.9 12.0 12.0 18.3 Average (excluding Silves) 13.6 14.2 16.1
Source: tables A2 and A4 – A6.
Notes: Braga was split in two, separating the eastern highlands (or Tra´s-os-Montes) from the coastal core of the diocese; likewise, the two parishes of Badajoz were united to the adjacent diocese, E´ vora.
Figure 2. Accounts of the Knights Templar. The spiritual revenues of the parish of Marmeleira in1312, including tithes start at line 10 (TT, Ordem de Cristo/Convento de Tomar, mc¸.1, n. 16, fol.9).
Figure 3. Regional differences in per capita agrarian output. Cartography by Cla´udia Viana.
lacked the adequate conditions for the products which commanded higher prices (wheat or olive oil) (figure3).
The impact of land-abundance in fourteenth-century economies can also be observed with a comparison across Portuguese borders. Unlike output estimates for Italy and Spain, which are expressed in an index form and cannot be readily converted to nominal or real terms, the recent, well-scrutinized output-side estimates for England and Wales (Apostolides et al. 2008,2012)
provide an apt term for comparison (table2). Mind that consumption patterns were similar,
as shown in work byDyer (1988)andGonc¸alves (2004).
Portugal’s per capita agrarian output was larger than that of England and Wales c. 1300. This result can be related to favorable land/labor ratios. Unlike Portugal, early fourteenth-century England appears pressured by decreasing returns: its demographic density was four times higher (Campbell 2008, table 14). Portugal, on the other hand, was not struggling with excess population and could assign enough land to the pastoral and wine sectors. Wine, in par-ticular, ensured a very good calorie per acre ratio and grew mostly on second-rate soils (Viana 1998). In contrast, ale was “land-extravagant” and disputed the space assigned to bread grains
(Overton and Campbell 2006, p. 15).
Nevertheless, it should be noted that English and Welsh per capita agrarian output was higher in silver terms, i.e., in terms of exchange rate. This suggests that Portugal’s lower agrarian prices also reflect lower demand-side pressure. The land distributions that followed the Reconquista brought on extended land-ownership and access to land via long-term leases for Portuguese farmers. On the whole, this encouraged self-consumption rather than specialization. Pre-Plague England had the inverse problem: a large share of landless workers who had to earn rather than grow their sustenance (Apostolides et al. 2008, p. 32; Campbell 2008, p. 940). England’s largely landless waged labor meant that even the basic agrarian goods were already tradable commodities.
These estimates should not be mistaken for a proxy for per capita output, as they do not in-corporate the output of the remaining sectors. In England, the agrarian sector only represented half of total output, a share that appears high for Portugal, whose industry did not count any clear exporting sector. The latter country could be likened with the Celtic Fringe, whose superior availability of land did not translate as higher per capita income relative to England (Campbell 2008, pp. 933 – 4). The terms of trade implicit in this exercise indicate that
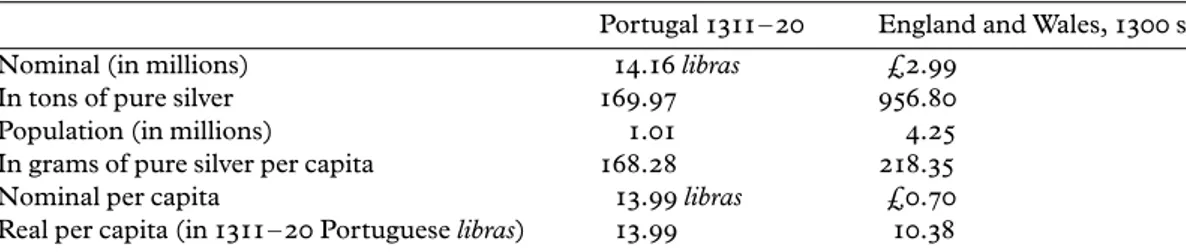
Table 2. Agrarian output in Portugal and England, c.1300
Portugal 1311 – 20 England and Wales, 1300 s
Nominal (in millions) 14.16 libras £2.99
In tons of pure silver 169.97 956.80
Population (in millions) 1.01 4.25
In grams of pure silver per capita 168.28 218.35
Nominal per capita 13.99 libras £0.70
Real per capita (in 1311 – 20 Portuguese libras) 13.99 10.38 Sources: For Portugal, tables A2 and A4 – A6; for England,Apostolides et al. (2008, table 18).
Notes: “Real per capita output (in Portuguese 1311 – 20 libras)” is the quantity of goods purchased in English current prices (PE) by English nominal per capita agrarian output (Q
pc
N) expressed in Portuguese 1311 – 20 prices (PP); this can
be expressed in notation as QR pc= (Q
N pc/P
E) × PP.
PPand PEwere based upon a basket composed of grain (half wheat, half rye), mutton, and beer/wine (with 1 liter of wine
equated with 2.66 liters of beer;Allen 2009). The English price for mutton was obtained through extrapolation from the butter, cheese, and milk prices in 1532 (Clark 2012).
Portugal would, as it did, export agrarian goods like dried fruits, olive oil, or wine (Marques 1978, 156 – 7) to Northwest Europe. In exchange, Portugal imported cloths and other
manufac-tures from Northwestern Europe.
It is possible to extend tentatively this comparison to Spain.A´ lvarez-Nogal and Prados de la Escosura (2013, table 4 and figure 6) attempted a cross-European comparison of per capita GDP in 1300 at constant prices. This was done by applying the reconstructed growth rates of some European countries to a benchmark (1850). If we multiply these results by the share of the agriculture in GDP for England and Spain (Broadberry et al. 2012, table 9;A´ lvarez-Nogal and Prados de la Escosura 2013, table 6), we have a conjectural measure of per capita agrarian output for 1300 in constant prices. As we estimated Portugal’s position relative to England, we can infer Portugal’s position relative to Spain through cross-multiplication (table3).
Within the Reconquista countries, Spain’s higher agrarian productivity is not surprising given her absolute advantages in terms of extent of the market, higher urbanization rate, manufactur-ing sectors (cloth and ironworks), and access to the Mediterranean. However, the difference relative to England appears too high. In the absence of sufficient comparative research, we must turn to real wages, which may be taken as a proxy for per capita income and, hence, reflect the living standard of the majority. The available Spanish rural wages and prices used here come from the dynamic region of Zaragoza (Zulaica Palacios 1994). While they might not be representative of the whole of “Spain”, these prices and wages underpin the conclusions reached by A´ lvarez-Nogal and Prados de la Escosura about the favorable pre-1348 period (table4).
The distance between Portuguese and English wages mirrors the difference between their average per capita agrarian outputs. However, Spanish wages appear lower than those sug-gested by the data from table3. At any rate, the real wages of the two “frontier economies”
are higher, reflecting their lower pressure on land. If we regard real wages as the marginal return to labor, the worse conditions of the land-scarce English laborers become apparent.
Table 3. Conjectural PPP levels of p.c. agrarian product, c.1300 (British GDP in 1850 ¼ 100)
PPP method Spain England Portugal
A´ lvarez-Nogal and Prados de la Escosura dataset
(US 1850 constant prices; British GDP in 1850 ¼ 1900)
24.2 12.5 16.9
Maddison dataset (GK 1990 dollars) 20.4 12.5 16.8
Sources: table2, andA´ lvarez-Nogal and Prados de la Escosura (2013, table 4 and figure 6).
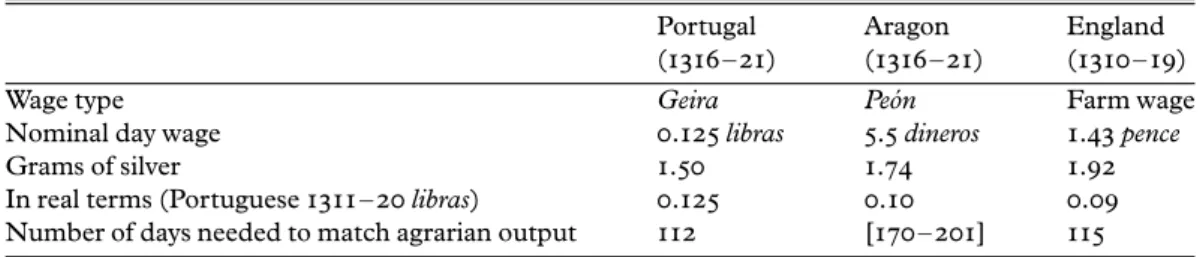
Table 4. Unskilled rural day wages, compared, c.1300 Portugal (1316 – 21) Aragon (1316 – 21) England (1310 – 19)
Wage type Geira Peo´n Farm wage
Nominal day wage 0.125 libras 5.5 dineros 1.43 pence
Grams of silver 1.50 1.74 1.92
In real terms (Portuguese 1311 – 20 libras) 0.125 0.10 0.09 Number of days needed to match agrarian output 112 [170 – 201] 115 Sources: table2; for Aragonese prices and wages:Zulaica Palacios (1994, p. 347, 358, 361);Serrano Larrayoz (1998). For
Spanish p.c. agrarian output: table3; for Portuguese wages:TT, NA 314;ADB, Gaveta das Mate´rias Inu´ teis, 38; for
If significant differences between real wages show how decisive the availability of land was in the Malthusian era, Portuguese and Spanish wages appear lower than English when measured in silver content (table4). This difference mirrors the contrast between Northwestern Europe
and Asia, where “grain wages” were higher and “silver wages” lower (Broadberry and Gupta 2006). The higher “silver wages” of Northwest Europe, where urbanization rates were a
mul-tiple of Chinese and Indian ones, indicates that labor consumed tradable goods rather than subsistence commodities. Thus, the comparison between Portuguese and Spanish and English wages confirms the former’s lower productivity in the traded goods sector. It also sug-gests that the wide transformations wrought by the Reconquista had differential impacts in Portugal and Spain, due to the latter’s higher urbanization rate.
5. Robustness checks and extensions
This section discusses whether the main findings are robust to the assumptions adopted and whether the proposed benchmark is coherent with other available information from the demand side, namely consumption baskets.
We claim that frontier economy conditions meant that Portugal’s real per capita agrarian product was higher than that of England. Thus, we were careful not to exaggerate Portuguese agrarian output, in fact, while the tithe-to-output coefficient adopted was 9.3 based upon the com-position of the product (table A3). Supply-side sources (table 6) suggest a higher share of the pas-toral sector (33 percent rather than 17 percent), which would have elevate the tithe-to-output coefficient close to 12. Alternatively, slightly lower values for English agrarian output (Broadberry et al. 2012, table 3) were not considered. Further changes do not matter much: varying the composition of the real deflator would not substantially change the results as all the three main components of the alimentation were less expensive in real terms in Portugal than in England. Applying the lower-bound population estimate for England (4 million) instead of 4.25 million would improve English position relative to Portugal only in 6 percent.
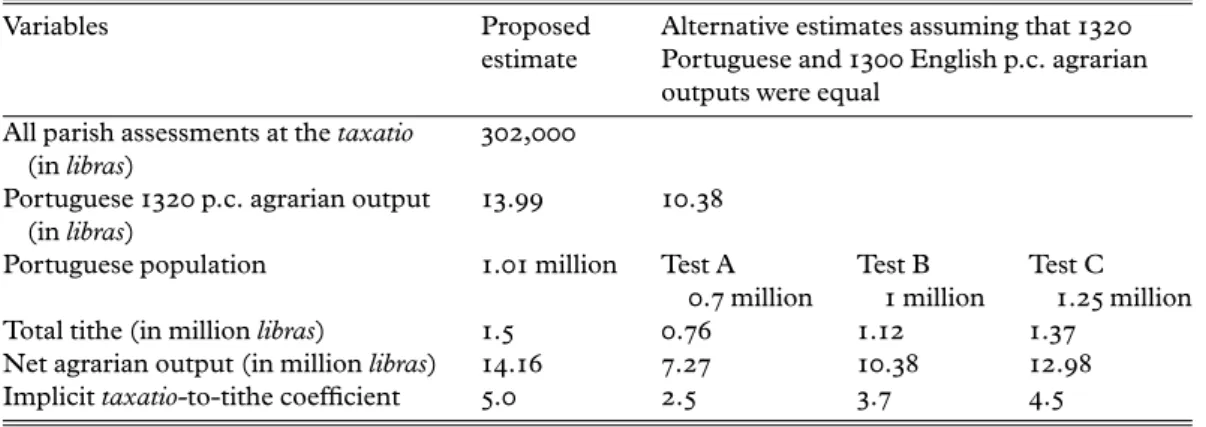
The most disputable issues are the population levels and the coefficients used in the taxatio-to-tithe conversion. We can test the reliability of our assumptions on these issues by postu-lating that, contrary to our claims, Portugal real per capita agrarian product was equal to England and then observing the implications of this supposition on the taxatio-to-tithe coefficient. As there is uncertainty about population, we tested this contrary assumption with different demographic
Table 5. Testing Portuguese p.c. Agrarian Output,1311–20
Variables Proposed
estimate
Alternative estimates assuming that 1320 Portuguese and 1300 English p.c. agrarian outputs were equal
All parish assessments at the taxatio (in libras)
302,000 Portuguese 1320 p.c. agrarian output
(in libras)
13.99 10.38 Portuguese population 1.01 million Test A
0.7 million
Test B 1million
Test C 1.25 million
Total tithe (in million libras) 1.5 0.76 1.12 1.37
Net agrarian output (in million libras) 14.16 7.27 10.38 12.98
Implicit taxatio-to-tithe coefficient 5.0 2.5 3.7 4.5
estimates: (A) Mattoso’s excessively low original proposal; (B) our preferred estimate (see tables A4 – A6); and (C) Portuguese population in 1527– 32, which is certainly too high (table5).
Table5indicates that equating English and Welsh to Portuguese per capita agrarian output
clashes with the available data. The taxatio-to-tithe coefficient predicted in our estimate is 5.0 and the median tithe/taxatio ratio found in our sample is 4.7 (table A1). The 2.5 coefficient found in Test A is lower than three and hence impossibly low. The taxatio-to-tithe coefficient of 3.7 obtained under more realistic population figures remains too low considering the data in table A1: equal or lower coefficients only appear in churches assessed at more than 600 libras (i.e., 2.9 percent of all parishes). Only by exaggerating population figures (Test C), can the alternative estimate of per capita agrarian output produce a realistic taxatio-to-tithe coef-ficient.
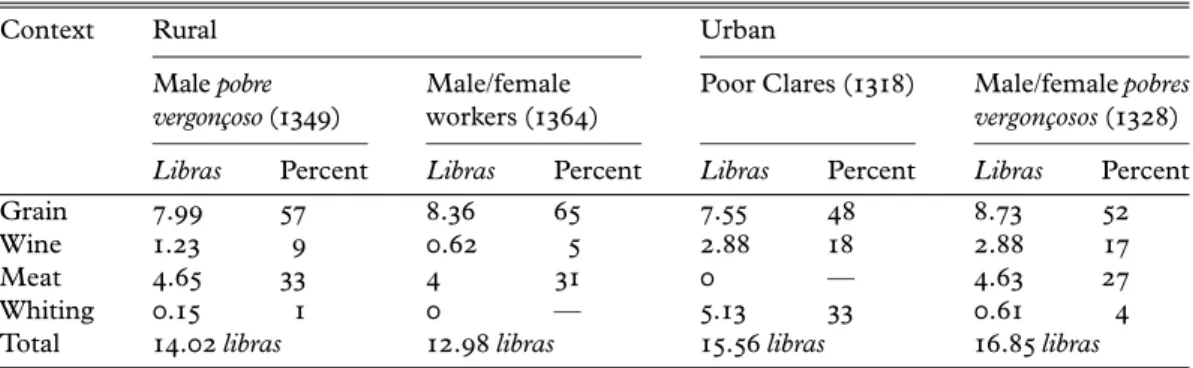
Other empirical data also indicate that our estimates are solid. If a per capita agrarian output of 13.99 libras is realistic, it has to be consistent with per head demand for agrarian products, given that there were no regular food imports. The consumption patterns across different seg-ments of the population (male/female; urban/rural; and ecclesiastical/lay) can be known through allowances, bequests, and grants to the poor. Importantly, all these allowances are above the subsistence level. This also applies to the grants destined to the pobres vergonc¸osos (individuals of some standing who had descended into poverty and could not earn their living), as their rationale was to provide these “new poor” with living conditions befitting their previous status (table6).
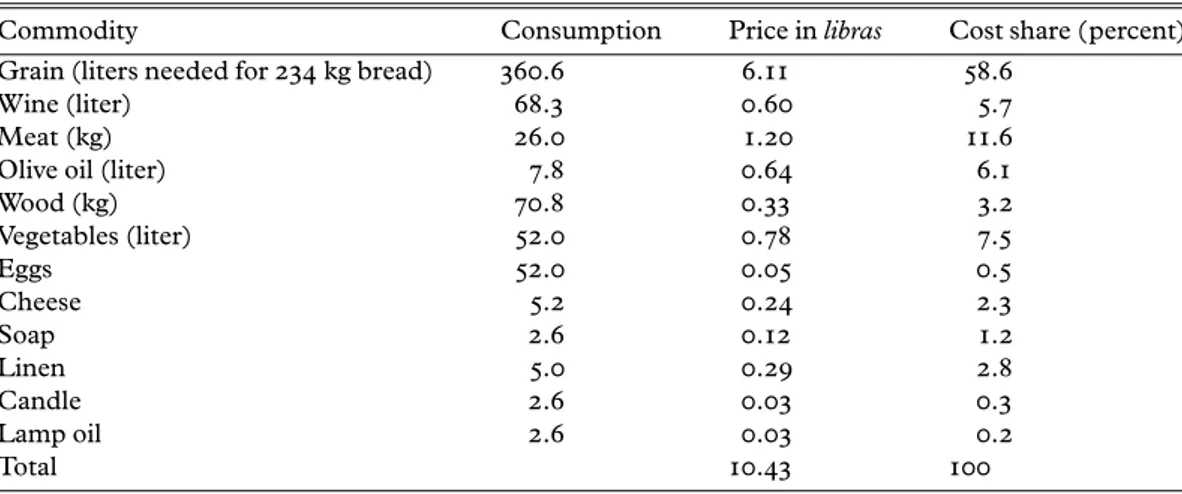
Available consumption evidence broadly coincides with the per capita agrarian output of 13.99 libras. This value is very close to the allowances for rural workers in 1364 and impoverished farmers in 1349. These classes got a respectable intake of meat/fish (table A7). With animal protein consumption stable across the rural/urban divide (between 31 and 34 percent of allow-ance value), wealthier city-dwellers spend their higher income in wine. This high level of con-sumption can also be confirmed by pricing Allen’s “respectability basket” in contemporary Portuguese prices (Allen 2009, pp. 35 – 7). While clearly alien to the present setting, this basket provides a recognizable deflator (table7).
This exercise shows that the cost of “respectability” was below per capita agrarian output. In fact, considering the evidence from Portuguese post-Plague consumption baskets, the pre-1348 age must have appeared as a time of plenty. While in England the Plague led to higher high per capita output and real wages, in Portugal, it appears to have coincided with
Table 6. Individual annual consumption in1311–20 prices
Context Rural Urban
Male pobre vergonc¸oso (1349)
Male/female workers (1364)
Poor Clares (1318) Male/female pobres vergonc¸osos (1328) Libras Percent Libras Percent Libras Percent Libras Percent
Grain 7.99 57 8.36 65 7.55 48 8.73 52
Wine 1.23 9 0.62 5 2.88 18 2.88 17
Meat 4.65 33 4 31 0 — 4.63 27
Whiting 0.15 1 0 — 5.13 33 0.61 4
Total 14.02 libras 12.98 libras 15.56 libras 16.85 libras Sources:TT, Gavetas, I, 3-18, andCoelho (1990),Paiva (2003),Amaral (1994),Lopes (2003),Ferreira (2007) and
Viana (2007, pp. 104 – 7).
a drop in the standards of living. In the early fifteenth century, institutions across the country had to reduce their statutory food allowances defined before the Plague (Mata 2000, p. 51, 264;Rocha 2011, p. 76, 232;Fontes 1998, p. 229;TT, Gavetas, I, 4-25). This cannot be attrib-uted to the excess population, as there are complains about the shortage of people in the 1420s and 1430s (Marques and Dias 1994). Considering the case of Spain, where population decline led to the decay in living standards, this evidence is not surprising (A´ lvarez-Nogal and Prados de la Escosura 2013, p. 24). Instead of releasing the Peninsula from population pressure, the Black Death and subsequent mortality crises led to the disintegration of product and factor (namely labor) markets.
6. Conclusions
Around 1300, having plenty of land meant being a land of plenty. Portuguese real per capita agrarian output and real wages were higher than those of England and Wales and were clearly above subsistence level. This difference cannot be attributed to superior technology or institutions but to a far more comfortable labor/land ratio. When combined with freedom of movement for labor, plenty of land meant increasing returns to labor and relatively high wages. This advantage stems from the Reconquista, which released population pressure by killing, banishing, or dispossessing the peninsular Moors.
Whilst low population density and wide availability of land kept Malthusian checks at bay, weak market integration, thin labor markets, low levels of specialization, and perhaps insuffi-cient monetary supply probably meant that Portugal was not meeting the conditions associated with the Little Divergence. These problems were aggravated by the Black Death, which seems to have contributed to deteriorate living standards in the Reconquista countries, while improving the conditions of northwestern Europe (Pamuk 2007;Voigtla¨nder and Voth 2013).
Table 7. Allen’s “European Respectability Basket” in1311–20 Portuguese prices
Commodity Consumption Price in libras Cost share (percent)
Grain (liters needed for 234 kg bread) 360.6 6.11 58.6
Wine (liter) 68.3 0.60 5.7
Meat (kg) 26.0 1.20 11.6
Olive oil (liter) 7.8 0.64 6.1
Wood (kg) 70.8 0.33 3.2 Vegetables (liter) 52.0 0.78 7.5 Eggs 52.0 0.05 0.5 Cheese 5.2 0.24 2.3 Soap 2.6 0.12 1.2 Linen 5.0 0.29 2.8 Candle 2.6 0.03 0.3 Lamp oil 2.6 0.03 0.2 Total 10.43 100
Sources:Allen (2001,2009) andFerreira (2007).
Notes: (1) non-agrarian components of baskets were not considered; (2) as some prices come from later periods, there might be an upward bias in the total cost; (3) “grain” price is the mean between wheat and rye prices (this was a common combination in bread); and (4) conversion of bread into grain used the extraction rates, losses and specific densities indicated (Gonc¸alves 1999, pp. 236 – 7).
Acknowledgements
Earlier versions of this article were presented at seminars held in Lisbon (ICS and FSCH-Nova) and Ponta Delgada, and also at the 31st APHES Conference in Coimbra. The author would like to thank first Ma´rio Farelo, Nuno Palma, and Jaime Reis, the referees and the editors, in particular Hans-Joachim Voth. The author would also like to thank Nuno Amado, Fa´tima Branda˜o, Steven Broadberry, Jose´ Luı´s Cardoso, Rui Pedro Esteves, Dulce Freire, Pedro Lains, Nuno Moutinho, Pedro Vaz Santos, Filipe Castro Soeiro, Pedro Teixeira, and Cla´udia Viana.
Conflict of interest statement. None declared.
References
ALLEN, R.C. (2001). The Great Divergence in European wages and prices from the Middle Ages to the
First World War. Explorations in Economic History38, pp. 411–447.
ALLEN, R.C. (2009). The British Industrial Revolution in Global Perspective. Cambridge: Cambridge
University Press.
ALMEIDA, F.D. (1910 – 28). Histo´ria da Igreja em Portugal. Lisboa: Civilizac¸a˜o.
A´LVAREZ-NOGAL, C. and PRADOS DE LAESCOSURA, L. (2013). The rise and fall of Spain (1270 – 1850). The
Economic History Review66, pp. 1–37.
AMARAL, L.C. (1994). Sa˜o Salvador de Grijo´ na Segunda Metade do Se´culo XIV. Estudo de Gesta˜o Agra´ria.
Porto: Cosmos.
APOSTOLIDES, A., BROADBERRY, S., CAMPBELL, B., OVERTON, M. andVANLEEUWEN, B. (2008). English
agricultural output and labour productivity, 1250 – 1850: some preliminary estimates. Unpublished Working Paper, University of Warwick.
Arquivo Distrital de Braga, Braga (ADB). Gaveta das Mate´rias Inu´teis. No. 38.
BARROS, M.F.L.D. (2007). Tempos e espac¸os de mouros: A minoria muc¸ulmana no reino portugueˆs (se´culos XII a
XV). Lisboa: FCT/Fundac¸a˜o Calouste Gulbenkian.
BARBOSA, P.G. (1992). Povoamento e Estrutura Agrı´cola na Extremadura Central. Se´culo XII a1325.Lisbon:INIC.
BOISSELLIER, S. (2012). La Construction Administrative d’un royaume: registres de be´ne´fices eccle´siastiques
portugais (XIII – XIVe sie´cles) Lisbon: CEHR.
BROADBERRY, S., CAMPBELL, B.M.S., KLEIN, A., OVERTON, M. and VAN LEEUWEN, B. (2012). British
Economic Growth: 1270 – 1870: an output-based approach. School of Economics Discussion Papers, University of Kent.
BROADBERRY, S. and GUPTA, B. (2006). The Early Modern Great Divergence: Wages, Prices and Economic
Development in Europe and Asia, 1500 – 1800. Economic History Review59, pp. 2–31.
CAMPBELL, B.M.S. (2008). Benchmarking medieval economic development: England, Wales, Scotland
and Ireland, c. 1290. Economic History Review61, pp. 896–945.
CLARK, G. (2007). The long march of history: farm wages, population and economic growth, England
1209– 1869. Economic History Review60, pp. 97–136.
CLARK, G. (2010). The macroeconomic aggregates for England, 1209 – 2008. Research in Economic History
27, pp. 51–140.
CLARK, G. (2012). England_1209 – 1914. Database at gpih.ucdavis.edu/files/England_1209 –
1914_(Clark).xls(accessed March 2014).
COELHO, M.H.D.C. (1990). Apontamentos sobre a comida e a bebida do campesinato coimbra˜o em
tempos medievos. In M.H.D.C. COELHO, (ed), Homens, espac¸os e poderes: se´culos XI-XVI, Vol.1.
Lisboa: Livros Horizonte, pp. 9 – 22.
COSTA, A.D.J.D. ([1959] 1997 – 2000). O Bispo D. Pedro e a organizac¸a˜o da Diocese de Braga. Braga:
Irmandade de S. Bento da Porta Aberta.
CRAFTS, N. and MILLS, T. (2009). From Malthus to Solow: how did the Malthusian economy really evolve.
Journal of Macroeconomics31, pp. 68–93.
DIAS, J.J.A. (1996). Gentes e Espac¸os. Em torno da populac¸a˜o portuguesa na primeira metade do se´culo XVI.
DINIS, A. (1960). Monumenta Henricina. Coimbra: Atlaˆntida.
DYER, C. (1988). Changes in diet in the Late Middle Ages: the case of harvest workers. Agricultural History
Review36, pp. 21–37.
ESTEVES, R.P. (2003). The Portuguese Concelhos and Forais. A case in institutional history from the
elev-enth to the mid thirteelev-enth centuries.
FERNANDES, H. (2000). Entre Mouros e Crista˜os. A Sociedade de Fronteira no Sudoeste Peninsular
inter-ior (se´cs. XII – XIII). Faculdade de Letras, PhD. Lisbon.
FERREIRA, M.D.C.F. (1988). Os Besteiros do Conto de Guimara˜es na Centu´ ria de Trezentos. Revista de
Cieˆncias Histo´ricas3, pp. 183–216.
FERREIRA, S.C. (2007). Prec¸os e Sala´rios em Portugal na Baixa Idade Me´dia. Faculdade de Letras, Mestrado.
Porto: Universidade do Porto.
FONTES, J.L.I. (1998). Frei Joa˜o A´ lvares e a tentativa de reforma do mosteiro de S. Salvador de Pac¸o de
Sousa no se´culo XV. Lusitania Sacra10 (series 2), pp. 217–302.
GOMES, S.A. (1998). As ordens mendicantes na Coimbra medieval: notas e documentos. Lusitania Sacra
10 (series 2), pp. 149–215.
GONC¸ALVES, I. (1989). O Patrimo´nio do Mosteiro de Alcobac¸a nos se´culos XIVe XV. Lisboa: FCSH-UNL.
GONC¸ALVES, I. (1999). Sobre o Pa˜o Medieval Minhoto. O Testemunho das Inquiric¸o˜es de 1258.
Arqueologia Medieval (6), pp. 225 – 243.
GONC¸ALVES, I. (2004). Entre a abundaˆncia e a mise´ria: as pra´cticas alimentares da Idade Me´dia
portu-guesa. In I. GONC¸ALVES(ed), Estudos Medievais. Lisboa: Livros Horizonte.
GONC¸ALVES, I. (2010). Comendas da Beira Interior Centro. Lisboa: Centro de Estudos Histo´ ricos.
HENRIQUES, A.C. (2013). O “Fruto” e o Produto. Do dı´zimo eclesia´stico a`s contas nacionais (Portugal,
se´culo XIV). In M. VIANAand J.A. SOLORZANOTELECHEA(eds), Economia e Instituic¸o˜es na Idade
Me´dia. Novas Abordagens. Ponta Delgada: Centro de Estudos Gaspar Frutuoso, pp. 66 – 94.
JOHNSON, H.B. (1970). Para a Histo´ ria Social de Torres Vedras, um documento eclesia´stico de 1309.
Boletim Cultural da Junta Distrital de Lisboa73–74, pp. 59–74.
KELLY, M. and O´ . GRA´ DA, C. (2013). Living Standards and Mortality Since the Middle Ages. Dublin: University College.
LOPES, F.F. (1966). Para a Histo´ria de Torres Vedras. Lusitania Sacra VII, pp. 135 – 52.
LOPES, L.S. (2003). Sistemas Legais de Medidas de Peso e Capacidade, do Condado Portucalense ao
Se´culo XVI. Portvgalia Nova Se´rie XXIV, pp. 113 – 64.
MALANIMA, P. (2009). Pre-modern European Economy. One Thousand Years (10th-19th Centuries). Leiden: Brill.
MALANIMA, P. (2010). The long decline of a leading economy: GDP in central and northern Italy, 1300 –
1913. European Review of Economic History, pp. 169 – 219.
MARQUES, A.H.D.O. (1971). Daily Life in Portugal in the Later Middle Ages. Madison: University of
Wisconsin Press.
MARQUES, A.H.D.O. (1978). Introduc¸a˜o a` Histo´ria da Agricultura em Portugal. A Questa˜o Cerealı´fera em
Portugal na Idade Me´dia. Lisbon: Cosmos.
MARQUES, A.H.D.O. (1980). A Populac¸a˜o Portuguesa nos Fins do Se´culo XIII. In A.H.D.O. MARQUES
(ed), Ensaios de Histo´ria Medieval Portuguesa. Lisbon: Vega, pp. 51 – 92.
MARQUES, A.H.D.O. (1981). Introduc¸a˜o a` Histo´rida da Cidade Medieval Portuguesa. Bracara Augusta35,
pp. 3 – 23.
MARQUES, A.H.D.O. (1987). Portugal na Crise dos Se´culos XIV e XV. Lisbon: Presenc¸a.
MARQUES, J. (1988). A Arquidiocese de Braga no Se´culo XV. Lisbon: INCM.
MARQUES, M.G. (1996). Histo´ria da Moeda Medieval Portuguesa. Sintra: Instituto de Sintra.
MARQUES, A.H.D.O. and DIAS, J.J.A. (1994). A Populac¸a˜o Portuguesa nos Se´culos XVe XVI. Biblos LXX,
pp. 171 – 96.
MARQUES, A.H.D.O., GONC¸ALVES, I. and ANDRADE, A.A. (1990). Atlas de cidades medievais portuguesas:
(se´culos XII a XV). Lisboa: Centro de Estudos Histo´ricos da Universidade Nova.
MATA, L.A.S.N. (2000). Ser, ter e poder: o Hospital do Espı´rito Santo de Santare´m nos finais da Idade Me´dia.
MATTOSO, J. (2001). A Identificac¸a˜o de um Paı´s. Ensaio sobre as origens de Portugal (1096–1325). Lisbon:
Cı´rculo de Leitores.
MELO, A.D.S. (2009). Trabalho e Produca˜o em Portugal na Idade Me´dia:O Porto, c.1320–c. 1415, PhD.
Braga: Universidade do Minho.
NICOLINI, E. (2007). Was Malthus right? A VAR analysis of economic and demographic interactions in
pre-industrial England. European Review of Economic History11, pp. 99–121.
OLIVEIRA, L.F. (2012). As Definic¸o˜es da Ordem de Avis de 1327. In I.C.F. FERNANDES(ed), As Ordens
Militares. Freires, Guerreiros,Cavaleiros. Actas do VI Encontro sobre Ordens Militares, Vol.1. Palmela: GEsOS/Municı´pio de Palmela, pp. 371 – 388.
OVERTON, M. and CAMPBELL, B.M.S. (2006). Production and productivity in English Agriculture 1086 –
1871. In B.M.S. Campbell (ed),14th International Economic History Congress, Helsinki, Finland. PAIVA, J.P. (2003). Antes das Miserico´rdias. Lisboa: Unia˜o das Miserico´rdias Portuguesas.
PAMUK, S. (2007). The Black Death and the origins of the ‘Great Divergence’ across Europe, 1300 – 1600.
European Review of Economic History11, pp. 289–317.
RAU, V. (1982). Sesmarias Medievais Portuguesas. Lisboa: Presenc¸a.
REPAS, L. (2003). Quando a nobreza traja de branco. A comunidade cisterciense durante o Abadessado de D. Luca
Rodrigues (1286–1299). Leiria: Magno.
ROCHA, A.R.S.D. (2011). A Institucionalizac¸a˜o dos Leprosos. O Hospital de S. La´zaro de Coimbra nos se´culos
XIII a XV. Faculdade de Letras, Mestrado. Coimbra: Universidade de Coimbra.
RODRIGUES, T. (2008). Histo´ria da populac¸a˜o portuguesa : das longas permaneˆncias a` conquista da
moderni-dade. Porto: Afrontamento.
SA´NOGUEIRA, B. (2008). Tabelionado e Instrumento Pu´blico em Portugal. Ge´nese e Implantac¸a˜o (1212–1279).
Lisbon: INCM.
SARAIVA, M.T.M.P. (1997). Figueira, comenda da ordem de Avis (publicac¸a˜o de fontes). Lisboa: Colibri.
SERRANOLARRAYOZ, F. (1998). La alimentacio´n de la realeza navarra en el siglo XV. In J.I. IGLESIADuarte
(ed), La vida cotidiana en la Edad Media. Logrono: Gobierno de la Rioja, pp. 305 – 336.
SILVA, M.J.O.E. (2010). A escrita na Catedral: a Chancelaria Episcopal do Porto na Idade Me´dia: (Estudo
Diploma´tico e Paleogra´fico). PhD. Porto: Universidade do Porto. TORRE DOTOMBO, LISBON(TT). Nu´cleo Antigo, no. 314.
TORRE DOTOMBO, LISBON(TT). Ordem de Cristo/Convento de Tomar. Mac¸o 1, no. 16.
TORRE DOTOMBO, LISBON(TT). Ordem de Santiago/Convento de Palmela, DR. Mac¸o 1, no. 25.
TORRE DOTOMBO, LISBON(TT). Gavetas. Gaveta I, Mac¸o 3, no. 18.
TORRE DOTOMBO, LISBON(TT). Gavetas. Gaveta I, Mac¸o 4, no. 25.
VIADER, R. (2010). La dıˆme dans l’Europe des Feodalite´s. In R. VIADER(ed), La Dıˆme. Actes des XXXes
Journe´es Internationales d’Histoire de l’Abbaye de Flaran. Flaran: Presses Universitaires du Mirail, pp. 7 –36. VIANA, M. (1998). Os Vinhedos Medievais de Santare´m. Cascais: Patrimonia Historica.
VIANA, M. (2007). Espac¸o e Povoamento numa Vila Portuguesa (Santare´m1147–1350). Lisbon: Caleidosco´pio.
VILAR, H.V. (1996). Uma fronteira entre poderes: as dioceses de E´ vora e da Guarda no nordeste alentejano.
Revista de Guimara˜es106, pp. 152–274.
VILAR, H.V. (1999). As Dimenso˜es de um Poder. A diocese de E´ vora na Idade Me´dia. Lisboa: Estampa.
VILAR, H.V. (2007). Patronage, parochial rights and military Portugal. Some analytical perspectives. In
R. CZAJA and J. SARNOWSKY(eds), Die Ritterorden als Tra¨ger der Herrschaft: Territorien, Grundbesitz
und Kirche. Turun: Nicolai Copernici Universitas, pp. 203 – 223.
VITERBO, J.D.S.R.D. (1966). Elucida´rio das palavras, termos e frases que em Portugal antigamente se usaram.
Porto: Civilizac¸a˜o.
VOIGTLA¨ NDER, N. and VOTH, H.-J. (2013). The three Horsemen of Riches: plague, war, and urbanization
in early modern Europe. Review of Economic Studies80, pp. 774–811.
ZANDEN, J.L.V. and LEEUWEN, B.V. (2011). The Character of growth before ‘modern economics growth’?
The GDP of Holland between 1347 and 1807. Working Papers. Centre for Global Economic History, Utrecht University.
ZULAICAPALACIOS, F. (1994). Fluctuaciones econo´micas en un periodo de crisis. Precios y salarios en
Appendix A
Table A2. The taxatio (all values in libras) Dioceses (n parishes) Median value of
parish assessment Total value of parish assessments Estimated total tithe Braga (946) 55 87,449 4,417,025 Ciudad Rodrigo (55) 15 992 72,608 Coimbra (227) 100 30,714 1,469,792 E´ vora+ Badajoz (103 + 2) 300 40,409 1,593,621 Guarda (205) 40 17,325 872,974 Lamego (119) 72.5 13,929 691,313 Lisboa (136) 290 55,830 2,152,004 Porto (277) 50 19,453 1,064,023 Silves (8) 247.5 3,623 141,388 Tuy (183) 60 16,440 845,732 Viseu (162) 85 16,104 843,870 Total (2413) – 302,267 14,164,348 Source:Boissellier (2012, pp. 111 – 203).
Notes: (a) Assessments include 103 parish churches attached to monasteries to which we assigned a value equal to the median of the parish churches within their archdeaconry. (b) For practical reasons, the value of 1 was given to 15 parishes assessed at “0”.
Table A1. Parish tithe accounts (at1311–20 prices in Portuguese libras) and the taxatio
Parish (Diocese) Taxatio
assessment
Parish revenues Tithe/taxatio ratio Tithea Other
1312 Santa Maria do Templo (Guarda) 0 7.5c 2.4 –
1312 Rapoula (Guarda) 15 107c 6.2 7.1
1312 Marmeleiro (Guarda) 100 777c 1.9 7.8
1312 Touro (Guarda) 100b 471c 30.5 4.7
1300– 9 Sa˜o Pedro de T. Vedras (Lisboa) 280 1,903c n.a. 6.5 1300– 9 Sa˜o Miguel de T. Vedras (Lisboa) 500 2,395c n.a. 4.8 1300– 9 Santiago de T. Vedras (Lisboa) 605 1,821c n.a. 3.0 1300– 9 Santa Maria de T. Vedras (Lisboa) 700 2,737c n.a. 3.9
1327 Avis (E´ vora) 1,731 6,419 300 3.7
1316 Tomar (Lisboa) 5,000 12,378 n.a. 2.5
Sources: 1300-9:Lopes (1966) andJohnson (1970); 1312 – 16:TT, Ordem de Cristo/Convento de Tomar, 1-16and 1327:
Oliveira (2012).
aGross yield of the tithe, comprising all shares; as, except for 1300 – 9, all accounts were net of the third given to the
bishop, thus tithes in Avis, Templo and Touro were multiplied by 1.5 allowing for the bishop’s third (Vilar 1996, p. 254,
Gonc¸alves 2010, p. 173), Marmeleira by 2.0 and Rapoula by 1.0 as the bishop was entitled to, respectively, one-half and nothing (TT, Ordem de Cristo/Convento de Tomar, 1-16;Gonc¸alves 2010, p. 173);
b20libras were deduced from Touro in order to allow for a chapel assessed together with the parish in 1320 (Boissellier, 2012, p. 195).
cPrices of the tithes in grain are given by the troika: 1 alqueire (i.e., 9.825 liters) of wheat at 0.2 libras and of second-rate
grain at 0.116 libras; wine was valued according to the 1312 accounts: 1 almude (i.e., 8.33 liters) at 0.05125 libras; with “grain” in 1300 – 9 interpreted as two-third wheat.
Table A3. Agrarian output composition in three large parishes (in libras)
Commodities tithed Tomar 1316 Tomar 1326 Avis 1327
Tithe Tithe adjusted Tithe Tithe adjusted Tithe Tithe adjusted
Libras Percent Libras Percent Libras Percent
Wheat 4,048 3,036 40 5,360 4,020 55 540 405 17 Other grain 1,555 1,166 16 420 315 13 Wine 775 752 10 1,000 970 13 1,500 1,350 55 Olive oil 1,300 1,170 15 1,000 900 12 Livestock 350 1,295 17 350 1,295 18 160 364 15 Other 122 122 2 120 120 2 20 20 1 Totals 8,150 7,541 100 7,830 7,458 100 3,263 3,247 101 Tithe adjusted as percent of Tithe 0.93 0.93 0.93
Sources: 1316:TT, Ordem de Cristo/Convento de Tomar, 1-16; 1326:Dinis (1960: I, pp. 150 – 160); 1327:Oliveira (2012).
Notes: The 3.7 coefficient for adjusting livestock tithe is taken fromHenriques (2013, p. 87).
Table A4. Portuguese population , c.1300
Diocese Population (in 1000 hab.) Density (hab./km2
) Change in population distribution (relative to 1527 – 32) (%) Braga (East)a 67.1 8.99 +0.1 Guarda 70.6 6.03 +2.3 Viseu 70.6 18.30 20.6 Porto 70.6 25.58 +0.9 Braga (West)a 120.0 44.41 26.7
Braga (Center)a 102.4 23.75 n.a.
Tuy 60.0 34.01 +2.6 Coimbra 98.8 11.52 +0.5 E´ vora 105.9 4.09 +3.7 Lisboa 155.3 15.62 +0.5 Lamego 56.5 16.57 +0.1 C. Rodrigo 7.1 4.47 +1.1 Silves 28.2 5.69 +0.7 (Continued )
Table A4. Continued
Diocese Population (in 1000 hab.) Density (hab./km2
) Change in population distribution (relative to 1527 – 32) (%)
Total 1,013.0 11.4
Portuguese population prior to the 1527-32 census, which indicates a population of 1.25 million (Dias, 1996), is a contentious topic. Marques and Dias stated that in the absence of any technological breakthrough the pre-Plague Portuguese population peak would be only recovered by 1600. As such, he ventured that population peaked at 1.5 million in 1348 (Marques and Dias 1994, p. 176). In contrast, the latest educated guess on Portuguese population (Rodrigues 2008, p. 519) claims that the population in 1340 was around 900,000 souls and that it was only 800,000 by 1320. These round figures are loosely extrapolated from the lower-bound estimates byMattoso (2001, pp. 14 – 18). The demographic trajectory advanced by Marques and Dias appears more consistent with the European evolution up to the Black Death (Pamuk 2007, p. 294;Malanima 2009), while revisionist by Mattoso estimates appear too low. Nonetheless, the notion that Portuguese population in 1527 – 32 was still below Pre-Plague levels is inconsistent with other data. Research (Marques 1988;Costa [1959] 1997 – 2000, p. 242) shows that in the rural parishes of the most densely populated part of the country (Entre Douro e Minho), the number of households changed little between 1258 and 1527. This stability seems to fit the structuraliste theory of Oliveira Marques. Yet, the comparison of the population distribution found by Mattoso with that of the 1527 – 32 census shows that the weight of this region in the overall population diminished from 25.7 to 19.6 percent. If this region kept its absolute population level but lost weight relative to other regions, it follows that the remaining regions were necessarily more populated in 1527 – 32 than that in 1300. Thus, in 1527 – 32 Portuguese population had to be greater than it in 1311 – 20. This is coherent with other evidence, namely the large-scale imports of wheat in Lisbon and other coastal cities in the fifteenth and sixteenth centuries. Thus, by 1300 population stood somewhere between Mattoso’s lowly 0.7 million and the excessive 1.25 million of 1527 – 32. This interval becomes shorter if we correct the calculations made by Mattoso. In fact, Mattoso made no attempt to make up for the flaws of the source neither the errors of its edition (Marques 1980). First, he did not take into account active notaries absent from the 1290 document (episcopal notaries from Porto and Braga, those from major towns like Beja, Setu´ bal or Tomar and those Algarve and Castelo Rodrigo). Second, the editor assigned five notaries to the wrong regions. Third, Mattoso assigned 120,000 souls to the whole of the Entre Douro e Lima (totaling 6,022 km2
) although Costa had estimated at c. 110,000 the population of the 2,580 km2
area between the rivers Lima and Ave-Vizela (Costa [1959] 1997 – 2000, p. 248), the country’s most populous region. This was a major flaw as it contributed to understating the density of the region for which A. J. da Costa had reconstructed the number of households and, indirectly, of the entire kingdom. These flaws are corrected here. Furthermore, in order to allow for the different demographic impli-cations of rural and urban notaries, notaries working in rural districts were counted as 1.25, whereas notaries working in towns were counted as 0.8. Notaries assigned to municipalities combining a town with a rural district were kept as 1. This is a crude way of compensating for the concentration of notaries public in cities and towns. The corrections resulted in adding 300,000 souls that had been lost by Mattoso.
Sources: Unless stated, data are obtained fromMarques et al. (1990),Marques (1980), andMattoso (2001). Notes: (a) The diocese of Braga was divided in order to separate the region studied by Costa (Braga West), the markedly different region of Tra´s-os-Montes (Braga East) and the core of the diocese (Braga Center).
Table A5. Urban population, c.1300a(in1000 hab.)
Cities Existing estimates Adopted estimate In the 1527 – 32 census
Lisbon 15.8 – 35.0 16 59 E´ vora 8,2 8 13 Porto 4.4 – 7.6 8 14 Santare´m 7.2 7 9 Coimbra 6.4 6 18 Elvas 4.8 5 11 Leiria 4.5 4 3 Guimara˜es 2.3 – 4.5 2 6 Braga 2.5 2 9 Guarda 1.6 2 2 Silves 1.6 2 7
Source: see table A6.
a
Unless stated, data are obtained fromMarques et al. (1990).
Table A6. Urban indicators Cities Built area (in hectares)a
(walled+ non-walled) Notaries In 1290b Parishes In 1320 Crossbowmen levied, c. 1300b Lisbon 98(60+ 38) 21 23 n.a. E´ vora .51 (51+?) 5 5 n.a. Porto 48(4+ 44) 6d 3 n.a. Santare´m 45(33+ 12) 15 15 60 Coimbra 40c(?+ ?) 5 6 31 Elvas .30 (30+?) 3 4 n.a. Leiria .28 (28+ 0) 3 5 40 Guimara˜es .20 (20+?) 7 3 40e Braga 16(16+ 0) 4d 5 n.a. Guarda 10(10+ 0) 5 8 n.a. Silves 11(10+ 0) 2d 1 n.a.
aWhen no estimate existed, we used the area coefficients applied by Oliveira Marques (160 hab./km2
) (Marques 1981).
bSources published inMarques (1980). cc. 1200,Gomes (1998).
dThe episcopal notaries of Porto (four) (Silva 2010, p. 329) and Braga (two) (Marques et al. 1990, p. 11) were included. eBefore 1348 (Ferreira 1988).
Table A7. Individual yearly allowances in kind (1318–65)
Rural Urban
1349Gulfar male pobre vergonc¸oso
1365Grijo´
45male and female workers (p.c.)
1318Vila do Conde Poor Clares
1328Coimbra 8male and 8 female pobres vergonc¸osos
Grain (liter) 471.6 278.3 386 515
Wine (liter) 199.9 139.3 467 467
Meat (kg) 100.4 (4 libras) 0 200