R. bras. Tecnol. Agroindustr., Ponta Grossa, v. 11, n. 2: p. 2397-2419, jul./dez. 2017. Página | 2397
https://periodicos.utfpr.edu.br/rbta
Mathematical modeling of drying the
pulped coffee (Coffea arabica l.) at different
air conditions
RESUMO
Paulo Carteri Coradi
paulocoradi@yahoo.com.br orcid.org/0000-0001-9150-2169
Universidade Federal de Santa Maria, Cachoeira do Sul, Rio Grande do Sul, Brasil
Flávio Meira Borém
flavioborem@deg.ufla.br
Universidade Federal de Lavras, Lavras, Minas Gerais, Brasil
Carlos Henrique Reinato
carlosreinato@bol.com.br
Escola Agrotécnica Federal de Machado, Machado, Minas Gerais, Brasil
The aim of the study was to describe the drying kinetics of washed coffee (Coffea arabica L.) and evaluate the best mathematical model to fit the experimental drying data conducted with different air humidity (40 %, 50 %, and 60 %) and temperatures (23 °C, 40 °C, and 60 °C). The fruit shakes were standardized washing, separation, and manual selection of green coffees, pass cane, and green buoy. Then, approx. 150 L of coffee cherries were pulped and taken directly to the yard. Drying the washed coffee was completed in a mechanical dryer and yard. The obtained results showed that the different conditions of the ambient air significantly influenced the processes of drying pulped coffee. The water content of the hygroscopic equilibrium of pulped coffee is directly proportional to the water activity and relative humidity, decreasing with increasing temperature, for the same value of equilibrium relative humidity. The Oswin model was best represented by the hygroscopicity of the pulped coffee, while the Midilli model shows the best fit to describe the drying curves of the washed coffee. The effective diffusion coefficient increases with increasing temperature of the drying air and reducing of relative humidity, being described by the Arrhenius equation
Página | 2398
INTRODUCTION
There are several factors that influence the final quality of the coffee, as soil and climate characteristics, cultivars, driving and crop management, harvesting, processing, drying, and storage. There are various forms of processing that result in major differences in the sensory attributes and there are common reports of superiority to coffee peeled and pulped and in relation to natural coffee. Drying is one of the most important stages in the processing of coffee, both from the standpoint of energy consumption and the influence this has on the operation quality of the final product. Given these problems, we seek greater control of the drying parameters (temperature of the drying air temperature of the grain mass, relative humidity, and air flow) in order to minimize adverse situations to the product. On the other hand, if the best drying techniques are not used, the quality may be impaired as a result of physical, chemical, and sensory (BORÉM et al., 2008; SAATH et al., 2010). The drying of agricultural products, thin layer, has the purpose of determining the rates of drying of the product using for data collection recording the mass loss occurred in a sample during water removal (RESENDE et al., 2009).
Thus, the drying curves, thin layer, vary with species, variety, environmental conditions, methods staging post-harvest, among other factors. Accordingly, various mathematical models have been used to describe the drying of agricultural produce, although in most cases, the semi-empirical relationships and empirical have been shown to predict the best options for the drying of grains and seeds, although its validity is restricted to the conditions under which the experimental data were obtained (RESENDE et al., 2009; CORADI et al., 2014). These models generally are based on variables external to the product, such as the temperature and relative humidity of the drying air. The semi-empirical equations are based on Newton's law of cooling heat transfer by convection, assuming that during the drying conditions are isothermal and that the water transfer is restricted to the surface of the product. Thus, the aim of the study was to describe the drying kinetics of washed coffee (Coffea arabica L.) and evaluate the best mathematical model to fit the experimental drying data conducted with different air humidity (40 %, 50 %, and 60 %) and temperatures (23 °C, 40 °C, and 60 °C).
Página | 2399
MATERIAL AND METHODS
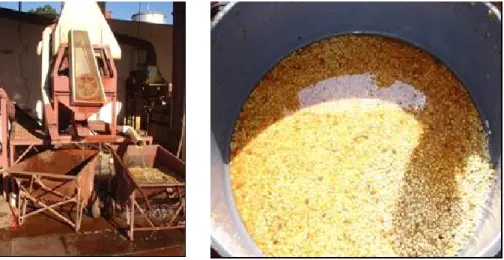
This work was conducted at the Department of Engineering and Technology Center of Post-Harvest Coffee, Federal University of Lavras. The coffee was harvested manually and selectively removing only the cherry fruit from the plant. For each repetition, 800 liters of the coffee variety Topazio were collected. All the raw materials were standardized by the washing, separation, and manual selection of green coffees; green cane passes, and buoy (Figure 1).
Figure 1 - Process of coffee stripping (left) and process of coffee pulping (right)
Fonte: Authors elaboration (2014)
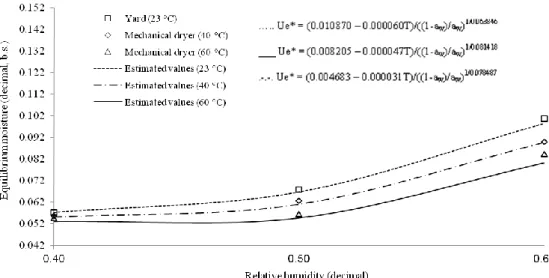
Then, about 150 liters of coffee cherries were pulped and taken directly to the yard. The pulped coffee was divided into distinct segments in the yard, remaining for two days, so that the beans were taken for mechanical drying (40 and 60 + 2 °C to 40, 50, and 60 + 5% RH) and complete drying in the yard (23 + 2 °C to 40, 50, and 60 + 5% RH) (Figure 2).
During the time that the coffee remained in the yard, turnings were made every half hour and monitoring the temperature and relative humidity of the ambient air using a term hygrograph. Mechanical drying was conducted on two prototypes of fixed layer.
Página | 2400
Figure 2 - Drying of natural and washed coffees in yard (left) and fixed bed dryers prototypes (right)
Fonte: Authors elaboration (2014)
To obtain the air flow diaphragm used a graduated opening in the fan inlet. The determination of the water content was performed by standard oven at 105 + 3 °C for 24 hours (BRASIL, 2009). The drying curves were fitted to the experimental data using thirteen different semi-empirical and empirical equations discriminated below.
Equation Models Number
k t
exp RU Newton (1)
k tn
exp RU Page (2)
n
t k exp RU Page Modified (3) RU = exp (- a- (a2 + 4 . b . t)1/2) / 2 . b Thompson (4) Eight Diffusion Terms (5)
k t
exp a RU Henderson and Pabis (6)
kt c aexp RU Logarithmic (7)
k t
b exp
k t
exp a RU o 1 Two Terms (8)
k t
1 a
exp
k a t
exp a RU Exponential Two Terms (9) 2RU 1 a t b t Wang and Singh (10)
k t
b exp
k t
c exp
k t
exp a RU o 1 Henderson and Pabis Modified (11)
k t
b t exp a RU n Midilli (12)
RU a exp k t 1 a exp k b t Diffusion
approximation (13)
Página | 2401
* * e * * i e U U RU U U ( (14) wherein,
U*: water content of product (% d.b.); Ui*:initial water content of the product (% d.b.); Ue*: equilibrium water content of the product (% d.b.).
It is usual to consider the value of the diffusion coefficient constant or linearly dependent on the temperature of the drying air.
exp E D A RT (15) wherein,
A: constant (m2 s-1); E: activation energy (kJ kmol-1); R: universal gas constant (8,314 kJ kmol-1 K-1); Tabs: absolute temperature (K).
The coefficients of the Arrhenius expression were linearized by applying the logarithm of the form: Ta RT E LnA 1 LnD (16)
To obtain the water content of the hygroscopic equilibrium of coffee the dynamic-gravimetric method was used. A desorption thin layer of the product was performed for different controlled conditions of temperature (23, 40, and 60 °C) and relative humidity of the drying air 40, 50, and 60 % until the product reached the equilibrium moisture content with air condition specified. Temperature and relative humidity were monitored by means of a psychrometer installed next to trays containing the samples. During the drying, the trays with the product were weighed periodically and the hygroscopic equilibrium was reached when the mass change of the containers to remain unchanged for three consecutive weightings. The experimental data of the equilibrium water content was adjusted mathematical models are frequently used to represent the hygroscopic agricultural products, whose expressions are shown below.
Página | 2402
Model designation Models Number
Sigma Copace U*e exp a (b T)
c exp(a ) w
(17)Sabbah U*e a a
wb Tc
(18) Oswin
w w 1 * c Ue a b T
1 a a
(19) Henderson
w 1 * b Ue ln (1 a ) ( a T + 273,16 ) (20) Henderson Modificado
w
1 * c Ue ln (1 a ) a (T b) (21) Halsey Modificado
w 1 * c Ue exp a b T ln a (22) GAB Ue*
a b c aw
1 c a w
1 c aw b c aw
(23) Copace U*e exp a (b T) (c a )
w
(24) Chung Pfost U*e a b ln
T c ln a
w
(25) BET U = 1 1-a*e
w
1 a b+ a-1 a b
(26) Fonte: Authors elaboration (2014)wherein,
* e
U : equilibrium water content, % d.b.; aw: water activity, decimal; T: temperature, °C; a, b, c: coefficients that depend on the product.
The experimental design was a completely randomized design (CRD) with three tests for each drying air velocity and drying temperatures. To adjust the mathematical models analysis were performed nonlinear regression, Quasi-Newton method, using the computer program Statistica 7.0®. To check the degree of fit of each model was considered the significance of the regression coefficient by t-test, adopting the 5% level of probability, the magnitude of the coefficient of determination (R2), the mean relative error values (P) and the average estimated error (SE) and verified the behavior of distribution of residuals. The relative average error and the average error estimated for each model were calculated according to the following expressions, respectively:
Y Yˆ Y n 100 P (27)
GLR Y Y SE
2 ˆ (28) wherein,Página | 2403
Y: experimentally observed value;
Y
ˆ
: value calculated by the model; n : number of experimental observations; DF: degrees of freedom of the model (the number of observations minus the number of model parameters).RESULTS AND DISCUSSION
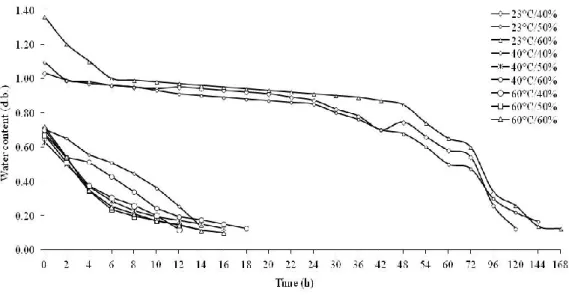
It can be seen in Table 1 that the mathematical models used to describe the fermented coffee hygroscopicity presented, for most of its coefficients, a regression significance level of 5% probability level by the t test and, in general, the models showed values of high coefficient of determination greater than 0.90 except for the models BET, GAB, Henderson, Modified Henderson, Chung, and Pfost that were below 80%. For further analysis, we used other statistical parameters to support the selection of the best model. Table 1 shows the summary of the mathematical models evaluated, with the parameters adjusted by nonlinear regression to the experimental data of the equilibrium moisture content of the washed coffee, obtained by desorption with the coefficients adjusted determination (R²) and average errors for (P) and estimated (SE). It is observed in Table 1 that the equations based on the models of Oswin, Sigma Copace, and Copace showed satisfactory adjustments to the experimental data of the equilibrium moisture content of the washed coffee, with better results for the Oswin model, since it had coefficients of determination set high and average relative errors and estimated very low, independent of the temperature and relative humidity of the drying air. Therefore, when comparing the values of the equilibrium moisture content of hygroscopic coffee that was not pulped, note that the values of equilibrium water content were higher for lower temperatures and higher relative humidity of the air. Table 1 - Parameter values estimated, mean relative error (P), standard deviation of the estimate (SE), coefficient of determination (R2) and residual distribution for mathematical models of drying relative humidity average of 40, 50 and 60% of washed coffee (Coffea arabica L.)
Mathematical models Estimation of parameters* R² (%) P (%) SE (decimal) Distribution of residue RH=40% Sigma copace a = -0.642501 b = 0.007091 99.45 0.35517 0.0017 A c = -1.00785 Sabbah a = 0.243954 b = 0.080254 97.18 0.78707 0.0039 A c = 0.261574
Página | 2404
Table 1 - Parameter values estimated, mean relative error (P), standard deviation of the estimate (SE), coefficient of determination (R2) and residual distribution for mathematical models of drying relative humidity average of 40, 50 and 60% of washed coffee (Coffea arabica L.)-c cont.
Mathematical models Estimation of parameters* R² (%) P (%) SE (decimal) Distribution of residue RH=40% Oswin a = 0.010870 b = -0.000060 99.77 0.22752 0.0011 A c = 0.063846 Henderson a = 0.348912 57.81 0.91484 0.0048 T b = 0.012984 Henderson Modified a = 5.860900 b = 102.1729 98.99 0.48011 0.0023 A c = 0.012553 Halsey Modified a = -0.005891 b = 1.358511 86.12 0.75809 0.0035 A c = -2.64225 GAB a = 0.518185 b = 0.508084 65.78 3.09819 0.0164 T c = 0.571646 Copace a = -1.87077 b = 0.007091 99.45 0.35509 0.0017 A c = -0.688173 Chung Pfost a = 0.02345 b = 0.34910 66.83 1.01079 0.0047 T c = 0.01925 BET a = 0.099957 68.37 3.09819 0.0164 T b = 18.95246 Corrêa a = 4.404755 b = 0.261799 97.18 0.78700 0.0039 T c = 5.118700 RH=50% Sigma copace a = -0.579038 b = 0.007495 99.97 0.08480 0.0004 A c = -1.01976 Sabbah a = 0.225061 b = 0.086620 98.77 0.54597 0.0024 A c = 0.279099 Oswin a = 0.008205 b = -0.000047 99.99 0.05610 0.0002 A c = 0.081418 Henderson a = -0.67298 60.34 0.86462 0.0035 T b = 0.082145 Henderson Modified a = 10.45824 b = 93.12367 99.80 0.23084 0.0010 A c = 0.006479 Halsey Modified a = -30.7154 b = 0.437228 88.23 0.71955 0.0030 A c = -0.007432
Página | 2405
Table 1 - Parameter values estimated, mean relative error (P), standard deviation of the estimate (SE), coefficient of determination (R2) and residual distribution for mathematical models of drying relative humidity average of 40, 50 and 60% of washed coffee (Coffea arabica L.)-c cont.
Mathematical models Estimation of parameters* R² (%) P (%) SE (decimal) Distribution of residue RH=50% GAB a = 0.452697 b = 0.447961 85.12 3.11689 0.0151 T c = 0.494803 Copace a = -1.82833 b = 0.007495 99.97 0.08483 0.0004 A c = -0.864013 Chung Pfost a = 0.065384 b = -0.23489 64.91 0.43173 0.0017 T c = 0.341839 BET a = 0.100045 67.29 3.11689 0.0151 T b = 25.90399 Corrêa a = 4.707968 b = 0.279407 98.77 0.54586 0.0024 A c = 6.202011 RH=60% Sigma Copace a = -0.511717 b = 0.009224 99.87 0.21767 0.0008 A c = -1.01499 Sabbah a = 0.237165 b = 0.085298 99.66 0.35028 0.0013 A c = 0.345157 Oswin a = .004683 b = -0.000031 99.99 0.00309 0.0008 A c = 0.078487 Henderson a = -0.28945 62.45 0.51089 0.0017 T b = 0.435612 Henderson Modified a = 1.194248 b = 68.75019 99.99 0.00720 0.0000261 A c = 0.109214 Halsey Modified a = -35.2389 b = 0.283401 67.84 0.68119 0.0024 T c = -0.007166 GAB a = 0.396879 b = 0.394938 53.12 3.85968 0.0156 T c = 0.432867 Copace a = -1.75386 b = 0.009224 99.87 0.21771 0.0008 A c = -1.01216 Oswin a = -0.83451 b = 0.341892 57.26 0.85149 0.0030 T c = 0.451280 Chung Pfost a = 0.008205 b = -0.000047 99.99 0.05610 0.0002 A c = 0.081418 BET a = 0.100031 68.29 3.85968 0.0156 T b = 38.31723 Corrêa a = 4.377243 b = 0.346115 99.66 0.34983 0.0013 A c = 6.261876
*All estimated coefficients were significant at 5% probability by t test. A – aleatory distribution
Página | 2406
The equations based on the models of Oswin, Sigma Copace, and Copace showed satisfactory adjustments to the experimental data of equilibrium moisture content of the washed coffee, with better results for the Oswin model (Table 1), since it had coefficients of determination set high and average relative errors and estimated very low, independent of temperature and relative humidity of the drying air. Therefore, when comparing the values of equilibrium moisture content of hygroscopic coffee that was not pulped, note that the values of equilibrium water content were higher for lower temperatures and higher relative humidity of the air. Figure 3 shows the experimental values of equilibrium water content of the fermented coffee obtained by desorption isotherms as well as estimated by the model Oswin. The constant water activity values of equilibrium water content of hygroscopic fermented coffee decreased with increasing temperature and with decreasing relative humidity.
Figure 3 - Observed and predicted values by Oswin model of water content equilibrium moisture content of the natural coffee obtained by desorption for different conditions of temperature and water activity. *Significant at 5% probability by the t test
Fonte: Authors elaboration (2014)
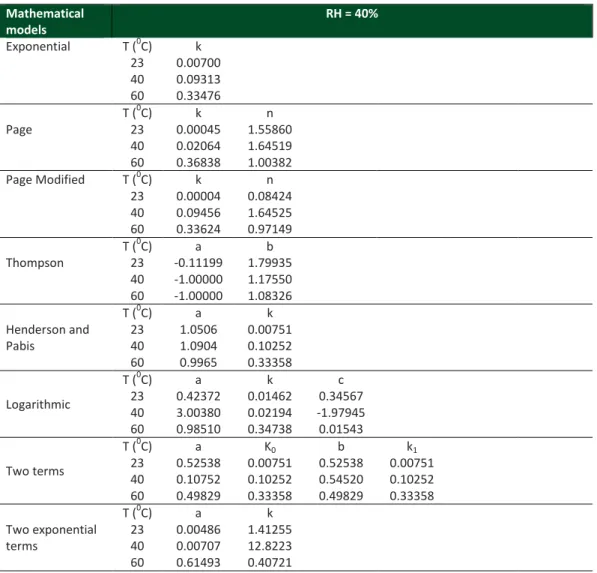
The isotherms calculated by the pulped coffee Oswin model can be classified as type III as verified for the seeds of radish by SOUSA et al. (2013) and for crambe (SOUZA et al., 2011). Nevertheless, for most agricultural products, isotherms showed a typical sigmoidal shape (type II). Figure 4 shows the mean values of the water content of the fermented coffee beans during drying in different conditions of temperature and relative humidity. Looking at Figure 4, it is found that the time required to reach the fermented coffee water content 0.11 (d.b. decimal) was 12 to 168 h, demonstrating the
Página | 2407
increased speed of withdrawal of water at 60°C and 40% relative humidity. As expected, the drying time is affected by air temperature, noting a greater difference between temperatures of 60 °C and 23 °C. It is also observed in Figure 4 that with increasing temperature of the drying air, there is a higher rate of removal of product water, as noted by many researchers for many agricultural products (PENA et al., 2010; REIS et al., 2011).
Figure 4 - Curves of drying coffee cherries processed naturally
Fonte: Authors elaboration (2014)
Table 2 shows the coefficients of the models adjusted for the coffee that was not pulped and that was analyzed during drying at different drying air temperatures and relative humidity conditions of the air. Among the models that gave good results, the Midilli model was selected to represent the phenomenon of drying coffee due to its simplicity compared to other models and selected to present a number of significant coefficients. It was observed that the magnitude of the drying constant (k) for the model Midilli, which represents the effect of external conditions drying increases linearly with the rise in temperature of the drying air (Table 2). The coefficient of determination was above 98% (Table 3), which according to MADAMBA et al. (1996), indicates a satisfactory representation of the phenomenon under study. According to this researcher, the use of the coefficient of determination as the only evaluation criterion for the selection of nonlinear models is not a good parameter to represent the drying phenomena.
Página | 2408
However, analyzing the estimated average error (SE), which describes the value of the standard deviation of the estimate, it was found that the models Wang and Singh, Page, and Logarithmic Approximation of Diffusion, Midilli, Exponential for Two terms showed lower values for drying performed in different temperatures and relative humidity of the air. It is noteworthy that the lower the value of the standard deviation of the estimate (SE) is the better the quality of fit of the model will be relative to the observed data. RESENDE et al. (2009) also observed that the models Page, Diffusion Approximation and Midilli showed a low average error estimated during the modeling of drying coffee clones of Coffea canephora. It appears that most of the models presented values mean relative error less than 10%, which according to MOHAPATRA and RAO (2005) indicates an adequate representation of the phenomenon, except for models Thompson, Newton, Henderson, and two terms and Pabis.
Table 2. Parameters obtained from models fitted to the data for drying of washed coffee processing in the different temperatures of air drying and relative humidity of 40, 50 and 60%
Mathematical models RH = 40% Exponential T (0C) k 23 0.00700 40 0.09313 60 0.33476 Page T (0C) k n 23 0.00045 1.55860 40 0.02064 1.64519 60 0.36838 1.00382 Page Modified T (0C) k n 23 0.00004 0.08424 40 0.09456 1.64525 60 0.33624 0.97149 Thompson T (0C) a b 23 -0.11199 1.79935 40 -1.00000 1.17550 60 -1.00000 1.08326 Henderson and Pabis T (0C) a k 23 1.0506 0.00751 40 1.0904 0.10252 60 0.9965 0.33358 Logarithmic T (0C) a k c 23 0.42372 0.01462 0.34567 40 3.00380 0.02194 -1.97945 60 0.98510 0.34738 0.01543 Two terms T (0C) a K0 b k1 23 0.52538 0.00751 0.52538 0.00751 40 0.10752 0.10252 0.54520 0.10252 60 0.49829 0.33358 0.49829 0.33358 Two exponential terms T (0C) a k 23 0.00486 1.41255 40 0.00707 12.8223 60 0.61493 0.40721
Página | 2409
Table 2. Parameters obtained from models fitted to the data for drying of washed coffee processing in the different temperatures of air drying and relative humidity of 40, 50 and 60%
Mathematical models
RH = 40%
Wang and Sing
T (0C) a b 23 -0.00371 -0.00001 40 -0.06070 0.00039 60 -0.26310 0.01890 Henderson and Modified Pabis T (0C) a k b k0 c k1 23 0.35016 0.00749 0.35016 0.00749 0.35016 0.00751 40 0.36346 0.10252 0.36346 0.10252 0.36346 0.10226 60 0.33219 0.35358 0.33219 0.33358 0.33219 0.33358 Midilli T (0C) a k n b 23 0.98137 -0.01081 0.63020 -0.00661 40 0.98716 0.02184 1.52303 -0.00597 60 1.00236 0.34825 0.97495 0.00042 Diffusion approximation T (0C) a k b 23 -3.36765 0.01787 0.78665 40 -6.59768 0.22287 0.86600 60 0.13864 0.62679 0.49026 Mathematical models RH = 50% Exponential T (0C) k 23 0.00494 40 0.12325 60 0.37000 Page T (0C) k N 23 0.03218 0.60118 40 0.10506 1.07325 60 0.36838 1.00382 Page Modified T (0C) k N 23 0.17355 0.00004 40 0.12254 1.07325 60 0.36979 1.00383 Thompson T (0C) a b 23 -0.11110 1.80077 40 -1.00000 1.18250 60 -1.00000 1.08307 Henderson and Pabis T (0C) a k 23 0.93002 0.00422 40 1.00754 0.12424 60 1.01004 0.37375 Logarithmic T (0C) a k c 23 0.52522 0.01373 0.45355 40 1.06942 0.10585 -0.07573 60 0.98503 0.41164 0.03466 Two terms T (0C) a K0 b k1 23 0.148278 0.29371 0.85166 0.00338 40 0.503771 0.12424 0.50377 0.12424 60 0.505020 0.37375 0.50502 0.37375 Two exponential terms T (0C) a k 23 0.10511 0.03784 40 0.01771 6.79073 60 0.59498 0.46148 Wang and Sing T (0C) a b 23 -0.00601 0.00001 40 -0.09930 0.00276 60 -0.28540 0.02194
Página | 2410
Table 2. Parameters obtained from models fitted to the data for drying of washed coffee processing in the different temperatures of air drying and relative humidity of 40, 50 and 60%
Mathematical models RH = 50% Henderson and Modified Pabis T (0C) a k b k0 c k1 23 -0.31756 -0.00161 1.13613 0.00142 0.18148 0.09728 40 0.33584 0.12424 0.33584 0.12424 0.33584 0.12424 60 0.33670 0.37375 0.33670 0.37375 0.33670 0.37375 Midilli T (0C) a k n b 23 1.00006 0.87784 0.25203 -0.00146 40 0.99235 0.10855 1.02298 -0.00214 60 1.00562 0.35236 1.16389 0.00885 Diffusion approximation T (0C) a k b 23 0.15002 0.15492 0.02165 40 -2.07456 0.19230 0.85655 60 0.07034 0.10727 3.80032 RH = 60% Exponential T (0C) k 23 0.00428 40 0.11165 60 0.36466 Page T (0C) k n 23 0.09325 0.34419 40 0.06506 1.24176 60 0.37145 0.98406 Page Modified T (0C) k n 23 0.17744 0.00003 40 0.11070 1.18175 60 0.36554 0.98406 Thompson T (0C) a b 23 -0.10908 1.80400 40 -1.00000 1.18175 60 -1.00000 1.08332 Henderson and Pabis T (0C) a K 23 0.88749 0.00310 40 1.03076 0.11535 60 1.00641 0.36704 Logarithmic T (0C) a K c 23 0.395289 0.22969 0.57938 40 1.239563 0.07663 -0.23818 60 0.980210 0.40651 0.03651 Two terms T (0C) a K0 b k1 23 0.21658 -0.01740 0.95959 0.00752 40 0.51537 0.11535 0.51537 0.11534 60 0.50321 0.36704 0.50321 0.36704 Two exponential terms T (0C) a k 23 0.11080 0.03008 40 1.77245 0.15702 60 0.55580 0.48030
Wang and Sing
T (0C) a b 23 -0.00745 0.00003 40 -0.08810 0.00209 60 -0.28150 0.02143 Henderson and Modified Pabis T (0C) a k b k0 c k1 23 1.49017 0.00898 -0.53230 0.01601 0.00166 -0.03273 40 0.34358 0.11534 0.34358 0.11534 0.34358 0.11534 60 0.33547 0.36704 0.33547 0.36704 0.33547 0.36704
Página | 2411
Table 2. Parameters obtained from models fitted to the data for drying of washed coffee processing in the different temperatures of air drying and relative humidity of 40, 50 and 60%
Mathematical models RH = 50% Midilli T (0C) a k n b 23 0.97188 0.00857 1.06740 0.00296 40 0.97144 0.05386 1.31332 0.00018 60 1.00690 0.36186 1.10794 0.00751 Diffusion approximation T (0C) a k b 23 0.22720 0.46930 0.00390 40 -4.03326 0.21346 0.86256 60 0.08348 0.11058 3.69000
Fonte: Authors elaboration (2014)
The models of Thompson and Diffusion of Eight Terms achieved, for modeling the drying of washed coffee, the biased distribution of waste, thus resulting in poor fits to the experimental data, while all other models corroborated with results verified by RESENDE et al. (2009) for the modeling of drying coffee clones. All the models that were evaluated attended satisfactory the P, SE, and distribution residue, but the Midilli model was better that other evaluated because presented higher R² for all.
Table 3. Coefficients of determination (R2), mean relative errors (P) and mean estimated errors (SE) for the models analyzed during drying of the washed coffee under various temperature conditions and relative humidity of 40, 50 and 60%
UR = 40% Mathematical Models 23 0C 50 0C 60 0C R2 (%) Exponential 93.86 96.45 99.81 Page 96.20 99.51 99.82 Page Modified 62.00 99.51 99.82 Thompson 55.10 55.67 48.70
Henderson and Pabis 94.25 97.19 99.81
Logarithmic 67.15 99.47 99.82
Two Terms 94.25 97.19 99.81
Two exponential terms 93.77 96.31 99.82
Wang and Singh 98.12 99.44 99.31
Henderson and Pabis Modified 94.25 97.19 99.81
Midilli 98.84 99.65 99.82 Diffusion approximation 96.36 99.23 99.82 P(%) Exponential 7.13 11.74 19.57 Page 0.04 11.62 19.36 Page Modified 10.47 11.62 19.37 Thompson 60.73 79.42 32.37
Henderson and Pabis 1.56 0.88 1.47
Logarithmic 90.02 0.54 0.89
Two Terms 1.62 0.88 1.47
Página | 2412
Table 3. Coefficients of determination (R2), mean relative errors (P) and mean estimated errors (SE) for the models analyzed during drying of the washed coffee under various temperature conditions and relative humidity of 40, 50 and 60%
UR = 40% Mathematical
Models
23 0C 50 0C 60 0C
P(%)
Wang and Singh 7.51 8.26 13.77
Henderson and Pabis Modified 1.25 0.88 1.47
Midilli 0.03 2.55 4.24 Diffusion approximation 9.42 12.60 21.00 SE (decimal) Exponential 0.0773 0.0880 0.0682 Page 0.0002 0.0347 0.0553 Page Modified 0.1837 0.0347 0.0553 Thompson 0.4777 0.5607 0.6809
Henderson and Pabis 0.0767 0.0767 0.0721
Logarithmic 0.1407 0.0352 0.0575
Two Terms 0.0848 0.0886 0.1020
Two exponential terms 0.0813 0.0951 0.0544
Wang and Singh 0.0451 0.0374 0.0720
Henderson and Pabis Modified 0.0962 0.1085 0.1442
Midilli 0.0535 0.0335 0.0727 Diffusion approximation 0.0656 0.0467 0.0618 Distribution of residue Exponential A A A Page A A A Page Modified A A A Thompson T T T
Henderson and Pabis A A A
Logarithmic T A A
Two Terms A A A
Two exponential terms A A A
Wang and Singh A A A
Henderson and Pabis Modified A A A
Midilli A A A Diffusion approximation A A A UR = 50% Mathematical Models 23 0C 50 0C 60 0C R2 (%) Exponential 91.52 99.69 99.62 Page 96.26 99.77 99.62 Page Modified 65.15 99.77 99.62 Thompson 55.68 62.81 19.38
Henderson and Pabis 93.79 99.70 99.63
Logarithmic 95.43 99.80 99.71
Two Terms 96.41 99.70 99.63
Two exponential terms 94.70 99.66 99.65
Wang and Singh 93.67 99.73 99.13
Henderson and Pabis Modified
96.46 99.70 99.63
Midilli 96.48 99.82 99.82
Página | 2413
Table 3. Coefficients of determination (R2), mean relative errors (P) and mean estimated errors (SE) for the models analyzed during drying of the washed coffee under various temperature conditions and relative humidity of 40, 50 and 60%
UR = 50% Mathematical Models 23 0C 50 0C 60 0C P (%) Exponential 16.23 3.66 6.11 Page 0.47 4.87 8.12 Page Modified 56.76 4.87 8.12 Thompson 25.88 58.28 63.80
Henderson and Pabis 9.38 4.12 6.87
Logarithmic 3.03 1.51 2.52
Two Terms 0.03 4.12 6.87
Two exponential terms 8.48 5.68 9.46
Wang and Singh 9.63 8.87 14.79
Henderson and Pabis
Modified 0.07 4.12 6.87 Midilli 0.01 1.95 3.25 Diffusion approximation 0.76 3.88 6.47 SE (decimal) Exponential 0.0533 0.0236 0.0317 Page 0.0375 0.0218 0.0309 Page Modified 0.2225 0.0218 0.0309 Thompson 0.5054 0.4424 0.6257
Henderson and Pabis 0.0431 0.0247 0.0349
Logarithmic 0.0408 0.0202 0.0286
Two Terms 0.0406 0.0285 0.0494
Two exponential terms 0.0485 0.0265 0.0375
Wang and Singh 0.0484 0.0234 0.0331
Henderson and Pabis Modified 0.0457 0.0349 0.0699
Midilli 0.0402 0.0235 0.0406 Diffusion approximation 0.0385 0.0220 0.0337 Distribution of residue Exponential A A A Page A A A Page Modified T A A Thompson T T T
Henderson and Pabis A A A
Logarithmic A A A
Two Terms A A A
Two exponential terms A A A
Wang and Singh A A A
Henderson and Pabis Modified A A A
Midilli A A A Diffusion approximation A A A UR = 60% R2 (%) Exponential 51.31 98.67 99.63 Page 65.68 99.30 99.64 Page Modified 52.10 99.30 99.64 Thompson 58.23 55.42 11.92
Henderson and Pabis 58.35 98.76 99.64
Página | 2414
Table 3. Coefficients of determination (R2), mean relative errors (P) and mean estimated errors (SE) for the models analyzed during drying of the washed coffee under various temperature conditions and relative humidity of 40, 50 and 60%
UR = 60% Mathematical Models 23 0C 50 0C 60 0C R2 (%) Two Terms 70.85 98.76 99.64
Two exponential terms 57.38 99.32 99.67
Wang and Singh 69.03 99.39 99.00
Henderson and Pabis Modified 74.37 98.76 99.64
Midilli 67.08 99.45 99.77 Diffusion approximation 65.36 99.34 99.69 P(%) Exponential 25.40 1.65 2.75 Page 0.09 7.87 13.12 Page Modified 74.32 7.87 13.12 Thompson 30.79 73.53 89.21
Henderson and Pabis 14.63 4.57 7.62
Logarithmic 3.51 0.23 0.39
Two Terms 5.41 4.57 7.62
Two exponential terms 17.35 7.93 13.22
Wang and Singh 53.79 54.76 91.27
Henderson and Pabis Modified 6.01 4.57 7.62
Midilli 4.75 6.57 10.95 Diffusion approximation 0.14 6.56 10.93 SE (decimal) Exponential 0.1357 0.0509 0.0682 Page 0.1245 0.0391 0.0553 Page Modified 0.2618 0.0391 0.0553 Thompson 0.5359 0.4815 0.6809
Henderson and Pabis 0.1297 0.0510 0.0721
Logarithmic 0.1248 0.0407 0.0575
Two Terms 0.1287 0.0589 0.1020
Two exponential terms 0.1352 0.0385 0.0544
Wang and Singh 0.1195 0.0509 0.0720
Henderson and Pabis Modified 0.1375 0.0721 0.1442
Midilli 0.1350 0.0420 0.0727 Diffusion approximation 0.1310 0.0405 0.0618 Distribution of residue Exponential A A A Page A A A Page Modified T A A Thompson T T T
Henderson and Pabis A A A
Logarithmic A A A
Two Terms A A A
Two exponential terms A A A
Wang and Singh A A A
Henderson and Pabis Modified A A A
Midilli A A A
Diffusion approximation A A A
A – aleatory distribution
Página | 2415
Figure 5 shows the values of the effective diffusion coefficient for the pulped coffee beans during different drying conditions. It appears that during the drying the effective diffusion coefficient increased significantly (p<0.05), with the rise of temperature and increase in relative humidity. ALMEIDA et al. (2009) found that during the drying of adzuki effective diffusion coefficients had magnitudes between 0.51x10⁻¹⁰ and 2.23x10⁻¹⁰ m2 s-1 for the temperature range from 30 °C to 70 °C. Their dependence on the temperature of the drying air is described by the Arrhenius equation as shown in Figure 6.
Figure 5 - Values for the effective diffusion coefficient (m2 s-1), due to different air temperatures drying of pulped coffee.
Fonte: Authors elaboration (2014)
Figure 6 - Representation Arrhenius relationship for the effective diffusivity and air temperature drying of natural coffee.
Página | 2416
The almost linear fit was obtained indicates that uniform variation of diffusivity with temperature, the value being the variation of diffusivity coefficient obtained at 60 °C, slightly higher than the temperatures of 23 °C and 40 °C, this may be explained due to the molecular vibration of water, because, according GONELI et al. (2011), the diffusion coefficient of variation effective occurs with increasing temperature, which increases the molecular vibration of water molecules and contributes to a faster diffusion. It can be said, therefore, that there was a greater diffusion at a temperature of 60°C. It is observed that the values of Ln (D) as a function of the inverse absolute temperature (1/Ta) show similar behavior to the ranges of temperature 23 °C to 40 °C and 40 °C to 60 °C. Therefore, it can be inferred that there was no interference of external conditions or drying temperatures.
CONCLUSIONS
The different conditions of the ambient air significantly influenced the processes of the drying pulped coffee. The water content of the hygroscopic equilibrium of pulped coffee is directly proportional to the water activity and relative humidity, decreasing with increasing temperature, for the same value of equilibrium relative humidity. The Oswin model was best represented with the hygroscopicity of the pulped coffee, while the Midilli model shows the best fit to describe the drying curves of the washed coffee. The effective diffusion coefficient increases with increasing temperature of the drying air and reducing relative humidity as described by the Arrhenius equation.
ACKNOWLEDGEMENTS
The authors would like to thank the CAPES and CNPq Foundations, the Federal University of Mato Grosso do Sul and Department of the Agricultural Engineering and Federal University of Viçosa, Brazil, for its financial support.
Página | 2417
Modelagem matemática da secagem do
café despolpado em diferentes condições
do ar
ABSTRACT
O objetivo do estudo foi descrever a cinética de secagem do café despolpado (Coffea arabica L.) e avaliar o melhor modelo matemático para ajuste dos dados experimentais de secagem, realizada com diferentes umidades relativas do ar (40, 50 e 60 %) e temperaturas (23, 40 e 60 °C). Os frutos de cafés foram padronizadas na lavagem, separação e seleção manual, dos cafés verdes, passa cana, verde e boia. Em seguida, cerca de 150L de café cereja foi despolpado e levado diretamente para o terreiro. A secagem do café despolpado foi completada em um secador mecânico e no terreiro. Os resultados obtidos mostraram que as diferentes condições do ar ambiente influenciou significativamente nos processos de secagem do café despolpado. O teor de água de equilíbrio higroscópico do café despolpado é proporcional à atividade de água e a umidade relativa, diminuindo com o aumento da temperatura, para o mesmo valor de umidade de equilíbrio higroscópico. O modelo Oswin foi o que melhor representou a higroscopicidade do café despolpado, enquanto o modelo Midilli apresentou o melhor ajuste das curvas de secagem do café. O coeficiente de difusão eficaz aumentou com o aumento da temperatura do ar de secagem e redução da umidade relativa, sendo descrito pela equação de Arrhenius.
Página | 2418
REFERÊNCIAS
ALMEIDA, Dieimisson Paulo et al. Cinética de secagem do feijão adzuki (Vigna
angularis). Global Science and Technology, v. 2, n. 1, 2009.
BORÉM, Flávio Meira et al. Qualidade do café natural e despolpado após secagem em terreiro e com altas temperaturas. Ciência e Agrotecnologia, p. 1609-1615, 2008.
BRASIL. Ministério da Agricultura e Reforma Agrária. Secretaria Nacional de defesa Agropecuária. Regras para análise de sementes. Secretaria Nacional de Defesa Agropecuária. Brasília: MAPA/ACS, 2009, 395p.
CORADI, Paulo Carteri; BORÉM, Flávio Meira; REINATO, Carlos Henrique. Coffee cherries drying process and the influence of environment relative humidity in the mathematical modeling, moisture content, and enthalpy of vaporization. Energia
na Agricultura, v. 29, n. 2, p. 148-157, 2014.
DUARTE GONELI, André Luís et al. Contração volumétrica e forma dos frutos de mamona durante a secagem. Acta Scientiarum. Agronomy, v. 33, n. 1, 2011.
MADAMBA, Ponciano S.; DRISCOLL, Robert H.; BUCKLE, Ken A. The thin-layer drying characteristics of garlic slices. Journal of food engineering, v. 29, n. 1, p. 75-97, 1996. https://doi.org/10.1016/0260-8774(95)00062-3
MOHAPATRA, Debabandya; RAO, P. Srinivasa. A thin layer drying model of parboiled wheat. Journal of food engineering, v. 66, n. 4, p. 513-518, 2005.
https://doi.org/10.1016/j.jfoodeng.2004.04.023
PENA, R. da S.; MENDONÇA, N. B.; ALMEIDA, MDC de. Comportamento
higroscópico do açaí em pó. Revista Brasileira de Produtos Agroindustriais, v. 12, p. 153-161, 2010. https://doi.org/10.15871/1517-8595/rbpa.v12n2p153-161
REIS, Renata C. et al. Modelagem matemática da secagem da pimenta Cumari do Pará. Revista Brasileira de Engenharia Agrícola e Ambiental, v. 15, n. 4, p. 347-353, 2011.
RESENDE, Osvaldo et al. Modelagem matemática para a secagem de clones de café (Coffea canephora Pierre) em terreiro de concreto. Acta Scientiarum.
Página | 2419
SAATH, Reni et al. Microscopia Eletrônica de Varredura do Endosperma de Café (Coffea arabica L.) durante o processo de secagem. Ciência e Agrotecnologia, p. 196-203, 2010.
SOUSA, Kelly Aparecida de et al. Cinética de secagem do nabo forrageiro (Raphanus sativus L.). Revista Ciência Agronômica, v. 42, n. 4, 2011.
SOUSA, Kelly A.; RESENDE, Osvaldo; COSTA, Lílian M. Isotermas de dessorção das sementes de nabo forrageiro obtidas pelos métodos dinâmico e estático. Revista
Brasileira de Engenharia Agricola e Ambiental-Agriambi, v. 17, n. 2, 2013.
Recebido: 26 ago. 2015.
Aprovado: 20 ago. 2017.
Publicado: 27 dez. 2017.
DOI:10.3895/rbta.v11n2.3166
Como citar:
CORADI, P. C.; BORÉM, F. M.; REINATO, C. H. Modelagem matemática da secagem do café despolpado em diferentes condições do ar. R. bras. Tecnol. Agroindustr., Ponta Grossa, v. 11, n. 2, p. 2397-2419, jul./dez. 2017. Disponível em: <https://periodicos.utfpr.edu.br/rbta>. Acesso em: XXX.
Correspondência:
Paulo Carteri Coradi
Avenida Presidente Vargas, 1958, Cachoeira do Sul, Rio Grande do Sul, Brasil
Direito autoral: Este artigo está licenciado sob os termos da Licença Creative Commons-Atribuição 4.0 Internacional.