UNIVERSIDADE DE LISBOA
FACULDADE DE CIÊNCIAS
DEPARTAMENTO DE BIOLOGIA VEGETAL
The IsomiR Window: the interface that bridges
the complexity of miRNAs and their functional impact
Beatriz Viamonte de Sousa Ferreira
Mestrado em Bioinformática e Biologia Computacional
Especialização em Bioinformática
Dissertação orientada por:
Professor Doutor António Manuel Silva Ferreira
Doutora Andreia de Jesus Amaral Gomes Barbosa Fonseca
Acknowledgements
First, I would like to thank my supervisors for all the time and patience dedicated to me. All your guidance was extremely important.
I also want to thank my boyfriend Diogo for supporting me at all times. Thank you for being some I can look after with admiration and to never make me think that quitting was even an option.
My parents have always supported me, and all their belief and strength truly helped me overcome this challenge.
I want to thank my friend Inês Viegas, for having accompanied me throughout my academic journey, and for always supporting me.
Thank you to all my friends, David, Nuno, Soraia, Luisa, Mariana A., Mariana G., João, Mameri, for all the patience.
Resumo
Os métodos de sequenciação de elevado débito, conhecidos como Next-Generation Sequencing (NGS), têm sido bastante usados nos últimos anos, permitindo obter, em paralelo, milhões de sequências de DNA ou de RNA. Estes métodos são muito aplicados no estudo de moléculas de RNA de pequenas dimensões, nas quais se incluem os microRNAs (miRNAs), sendo estes conhecidos como reguladores da expressão génica. Adicionalmente, estes métodos permitiram a descoberta de variantes dos miRNAs que exibem alterações na sua sequência. Estas variantes denominam-se isomiRs, podendo pertencer a três grupos: isomiRs 5’, isomiRs 3’, e isomiRs com mudanças internas.
Atualmente existem várias ferramentas de bioinformática que permitem a identificação sistemática de isomiRs. No entanto, apesar dos esforços destas ferramentas em fornecer plataformas computacionais especializadas para a análise de dados de sequenciação de RNAs de pequenas dimensões, estas têm em falta bastantes funcionalidades, não permitindo que o investigador receba todo o contexto dos dados, e, por consequência, a complexidade dos isomiRs na amostra não é devidamente explorada. Uma funcionalidade que está em falta nestas ferramentas é a possibilidade de o utilizador realizar de forma integrada a análise de anotação de sequências, incluindo a expressão diferencial, e a análise de impacto funcional dos isomiRs encontrados nas amostras. Outro aspeto importante é a maioria destas ferramentas não permitir analisar dados de NGS. As que permitem analisar estes dados, não permitem a análise em paralelo de vários ficheiros e apresentam limites de tamanho demasiado reduzidos para os ficheiros de dados NGS. Adicionalmente, muitas das ferramentas não disponibilizam uma interface gráfica, tornando a tarefa de analisar dados de sequenciação mais difícil para investigadores que não têm conhecimentos em bioinformática.
Desta forma, é importante a existência de uma ferramenta que integre todas as análises necessárias, nomeadamente a identificação de isomiRs num conjunto de dados, assim como a inferência do impacto funcional destas moléculas, e que possua uma interface gráfica fácil de usar. Assim, este projeto teve como objetivo contribuir para o desenvolvimento de uma ferramenta que permita a identificação rápida e eficiente de isomiRs e que integre diferentes funcionalidades de um modo automático, que vão desde a anotação de pequenos RNAs em dados de NGS à análise funcional para investigar o impacto biológico dos isomiRs identificados.
Como contribuição principal deste projeto foi criada uma aplicação web, que integra uma pipeline de bioinformática (fora do âmbito desta tese), e que suporta dois módulos de análise, de anotação e funcional, tendo sido considerada de raiz a transferência de informação entre os dois módulos de análise. Esta aplicação tem um conjunto mais completo de funcionalidades do que outras ferramentas existentes, apenas precisando de um browser web para poder ser usada. O funcionamento da aplicação foi testado utilizando dados de NGS disponíveis publicamente, tendo demonstrado a capacidade desta para processar vários ficheiros de uma forma integrada, produzindo gráficos e tabelas que demonstram os resultados deste processamento. Estes revelam uma complexidade das moléculas de pequenos RNAs não codificantes que não tinha sido previamente observada. Finalmente, foi criada uma máquina virtual com a aplicação desenvolvida, assim como todo o software da qual esta depende, de um modo pronto a usar, a qual está disponível no endereço http://isomir.fc.ul.pt.
Palavras-chave: IsomiRs; Análise de Anotação; Análise Funcional; Bioinformática; Aplicação
Abstract
Next-Generation Sequencing (NGS) methods have been widely used over the past years, allowing researchers to obtain, in parallel, millions of DNA and RNA sequences. These methods are extensively applied in the study of small RNA molecules, in which microRNAs (miRNAs) are included, which are known to act as regulators of gene expression. Additionally, NGS methods have permitted the discovery of variants of miRNAs, which exhibit changes in their sequence when compared to the canonical miRNA, and are called isomiRs. These molecules belong to one of three groups: 5’ isomiRs, 3’ isomiRs, and isomiRs with internal editings.
Nowadays, there are several bioinformatics tools that allow the systematic identification of isomiRs. However, they lack several key functionalities that prevent the user from understanding the entire complexity within the data, and consequently, the complexity of the isomiRs is not fully explored. One functionality that is absent in these tools, is an integrated workflow to sequentially, annotate sequences, infer differential expression, and assess the functional impact of isomiRs. Importantly, many of these tools do not accept NGS data as input. Regarding the ones that accept NGS data, they do not allow the analysis of several files in parallel and limit the size of the input in a way that excludes many NGS files. Furthermore, the lack of a graphical interface in these tools is also common, making the task of analyzing NGS data harder for researchers that are not familiar with bioinformatics concepts.
Thus, it is important to have a tool that integrates all the required analysis for isomiR identification and for inferring the functional impacts of those molecules, and that provides an easy to use graphical interface. Therefore, the main goal of this project was the development of a tool that allows a quick and efficient identification of isomiRs and that integrates different functionalities automatically, including the annotation of small non-coding RNAs in NGS data and the functional analysis so that the researcher can investigate the biological impact of the identified isomiRs.
The main contribution of this project was the development of a web application, which integrates a bioinformatics pipeline (outside the scope of this thesis), that allows the execution of two types of analyses, annotation and functional, having been built from scratch to support the sharing of data between the two analyses. This application presents a more complete set of functionalities, compared to other existing tools, and is available to the user through a web browser. The tool benchmarking was performed using publicly available NGS data, showing the ability to process multiple datasets in an integrated manner and producing reports of results in charts and table displays. These results show the complexity of small non-coding RNAs that had not been explored in the study. A virtual machine was created, in which the web application and pipeline are installed and configured as well as third-party software dependencies. The virtual machine is ready to use and it is available at http://isomir.fc.ul.pt.
Resumo alargado
Os métodos de sequenciação de elevado débito, conhecidos como Next-Generation Sequencing (NGS), têm sido bastante usados nos últimos anos, permitindo obter, em paralelo, milhões de sequências de DNA ou de RNA. Estes métodos produzem uma grande quantidade de informação num curto espaço de tempo, permitindo a sequenciação, de um modo rápido e de baixo custo, de um genoma ou de um transcriptoma.
Estes métodos são também muito aplicados no estudo de moléculas de RNA de pequenas dimensões (menores que 30 nucleótidos), nas quais se incluem os microRNAs (miRNAs). Os miRNAs ligam-se maioritariamente aos 3’UTR (three prime untranslated region) dos RNAs mensageiros, modelando a sua expressão, resultando na regulação da expressão génica por parte dos miRNAs. Adicionalmente, estes métodos permitiram a descoberta de variantes dos miRNAs que exibem alterações na sua sequência, e que se denominam isomiRs. Estes podem ser classificados em três grupos: isomiRs 5’ (clivagem de nucleótidos na região 5’ do miRNA), isomiRs 3’ (clivagem ou adição de nucleótidos na região 3’ do miRNA) e isomiRs com mudanças internas (substituição de nucleótidos na região interna do miRNA). Os isomiRs 5’, devido ao facto de possuírem alterações na sequência da seed, têm um grande efeito na alteração da expressão génica da célula. No que toca aos isomiRs 3’, apesar de não implicarem a existência de alterações na região seed, foi demonstrado que também causam impacto na regulação do programa de expressão génica em comparação com o respetivo miRNA canónico. Os isomiRs com mudanças internas, alterando a sequência nucleotídica, também podem ter afinidades de ligação para diferentes genes alvo em comparação com o miRNA canónico.
Atualmente existem várias ferramentas de bioinformática que permitem a identificação sistemática de isomiRs. No entanto, apesar dos esforços destas ferramentas em fornecer plataformas computacionais especializadas para a análise de dados de sequenciação de RNAs de pequenas dimensões, estas têm em falta bastantes funcionalidades, não permitindo ao investigador obter uma caraterização completa da complexidade dos pequenos RNAs presentes numa amostra.
Uma funcionalidade em falta nas ferramentas para a análise de dados de sequenciação de RNAs de pequena dimensão, é a possibilidade do utilizador poder, de um modo integrado, identificar todos os tipos de isomiRs e poder inferir qual o impacto destes no contexto experimental em estudo. Deste modo é necessário integrar a análise de anotação (que consiste na anotação de sequências) e que permite revelar a complexidade de pequenos RNAs não codificantes expressos (nomeadamente miRNAs, isomiRs e outros RNAs não codificantes); a análise de expressão diferencial, que permite identificar quais os miRNAs e isomiRs que estão diferencialmente expressos; e a análise funcional, na qual se efetua a previsão dos alvos dos isomiRs e se infere quais os processos biológicos mais afetados pelos isomiRs detetados. A falta de um fluxo de trabalho que integre todas estas funcionalidades obriga o investigador a realizar estas análises através do uso de múltiplas ferramentas, o que pode ser uma tarefa exaustiva e que, inclusivamente, está sujeita a mais erros.
A maioria das ferramentas disponíveis para a análise de isomiRs não disponibiliza uma interface gráfica, o que torna a tarefa de analisar dados de sequenciação mais difícil para investigadores que não tenham conhecimentos de bioinformática. Muitas das ferramentas existentes exigem ao utilizador conhecimentos de Linux e requerem a instalação de software através de linha de comandos, além da manipulação de ficheiros com milhões de dados, o que é uma barreira à utilização da ferramenta pela maioria dos potenciais utilizadores, como biólogos, investigadores biomédicos e clínicos. Atualmente, e que seja do nosso conhecimento, apenas duas ferramentas, CPSS e DeAnnIso, apresentam uma interface gráfica que permite a realização integrada das análises de anotação e de impacto funcional. No entanto, estas apresentam restrições que não permitem a análise expedita de dados NGS, nomeadamente devido ao limite de 50 MBytes para o ficheiro de dados NGS, que é bastante inferior ao tamanho habitual
de, pelo menos, 1 GByte. Acrescenta-se que resultados apresentados por estas ferramentas são, em alguns casos, pouco objetivos e apresentam falta de informação relativa à complexidade dos pequenos RNAs não codificantes. Desta forma, é importante a existência de uma ferramenta que permita realizar, de modo integrado, todas as análises necessárias à caraterização de pequenos RNAs não codificantes. Esta deve centralizar toda a informação relativa a isomiRs presentes nas amostras de estudo, e também ter uma interface gráfica que seja fácil de usar.
Assim, este projeto teve como objetivo contribuir para o desenvolvimento de uma ferramenta (IsomiR Window) que permita a identificação rápida e eficiente de isomiRs e que integre diferentes funcionalidades de um modo automático, que vão desde a anotação de pequenos RNAs em dados de NGS à análise funcional para investigar o impacto biológico dos isomiRs identificados. Esta ferramenta permite a análise paralela de vários ficheiros de dados NGS e não tem restrições quanto ao tamanho dos ficheiros. Esta providencia a visualização de resultados que caraterizam a complexidade das moléculas de RNA detetadas, com qualidade adequada à posterior disseminação de resultados. A visualização de resultados deverá possibilitar ao utilizador um nível de interatividade de modo a que o resultado final esteja de acordo com os seus objetivos. Este projeto foi desenvolvido tendo como base uma aplicação
web, que torna a análise dos dados de utilização fácil para investigadores com um nível de conhecimento
e experiência na utilização de ferramentas de bioinformática bastante incipiente e que integra uma
pipeline de bioinformática (fora do âmbito desta tese) que realiza o processamento de dados NGS.
A aplicação foi desenvolvida em várias fases. Na primeira fase foi efetuada uma revisão da literatura sobre a biologia dos isomiRs e das aplicações que permitem a análise destas moléculas, e também um estudo das metodologias e linguagens de programação para o desenvolvimento web. Na segunda fase foi feita a análise e design da aplicação web, que teve como um dos resultados um diagrama User
Environment Design, que define o fluxo de trabalho e funcionalidades suportadas pela aplicação. Na
terceira fase foi feita a implementação da aplicação, que está divida em três camadas, nomeadamente: camada de lógica aplicacional (backend); a camada de apresentação (frontend), e a camada do pipeline. Relativamente ao backend, foi criada uma base de dados que guarda as informações relativas às análises de anotação e funcional e respetivas interações. Foram também desenvolvidos serviços web, com o protocolo REST (Representational State Transfer), que permitem obter informações sobre as análises e para comunicar com a camada do pipeline, por exemplo para dar início a uma nova etapa de processamento ou para reportar erros. O frontend é responsável por oferecer uma interface gráfica ao utilizador num browser web, com o qual acede às funcionalidades da aplicação. Relativamente ao
pipeline, que consiste em vários scripts de Perl e R, este é usado para processar os dados inseridos pelo
utilizador, tendo colaborado na definição de mensagens de erro e de finalização das etapas. As duas primeiras camadas foram implementadas utilizando a framework de PHP, Laravel. Na última fase do projeto foi feita uma avaliação da aplicação. Dados humanos de sequenciação foram submetidos na aplicação e foi feita a apresentação dos resultados relativos a estes dados.
Desta forma, como uma das contribuições principais deste projeto, foi criada uma aplicação web que permite a realização de dois módulos de análise, de anotação e funcional, tendo sido considerada de raiz a transferência de informação entre os dois módulos. A aplicação desenvolvida, IsomiR Window, tem um conjunto mais completo de funcionalidades do que outras ferramentas existentes, permitindo que um utilizador, através de um web browser, tenha acesso às mesmas através do preenchimento de simples formulários. Foi criada uma máquina virtual com a aplicação, assim como todo o software da qual esta depende, de um modo pronto a usar, a qual está disponível no endereço http://isomir.fc.ul.pt. A informação sobre os requerimentos da ferramenta, e também erros encontrados ao longo das análises, é fornecida ao utilizador em todos os contextos das análises.
O funcionamento da aplicação foi testado utilizando dados de NGS disponíveis publicamente, tendo revelado uma complexidade das moléculas de pequenos RNAs não codificantes que não tinha sido previamente observada.
Table of contents
Acknowledgements ... iii Resumo ... v Abstract ... vii Resumo alargado ... ix Table of contents ... xiList of figures ... xiii
List of tables ... xv
Chapter 1 – Introduction... 1
1.1 Context and motivation ... 1
1.2 Goals ... 2
1.3 Methodology ... 3
1.4 Contributions ... 3
1.5 Document overview ... 3
Chapter 2 – Concepts and related work ... 5
2.1 MiRNA biology and complexity in NGS data ... 5
2.1.1 MicroRNA variants: isomiRs ... 5
2.1.2 Annotation and differential expression analysis ... 7
2.1.3 Functional analysis ... 8
2.2 Existing tools for isomiRs analysis ... 9
2.3 Web development ... 11
2.3.1 Client building blocks ... 12
2.3.2 Server building blocks ... 13
2.3.3 Model-view-controller frameworks... 13
2.4 Summary ... 17
Chapter 3 – Web application for the IsomiR Window tool ... 19
3.1 System architecture ... 19
3.2 Application design and structure ... 20
3.2.1 Application design ... 20
3.2.2 Application structure ... 22
3.3 Backend ... 26
3.3.1 Database ... 26
3.3.3 High-level system behaviour ... 31
3.3.4 Interactions with the pipeline ... 33
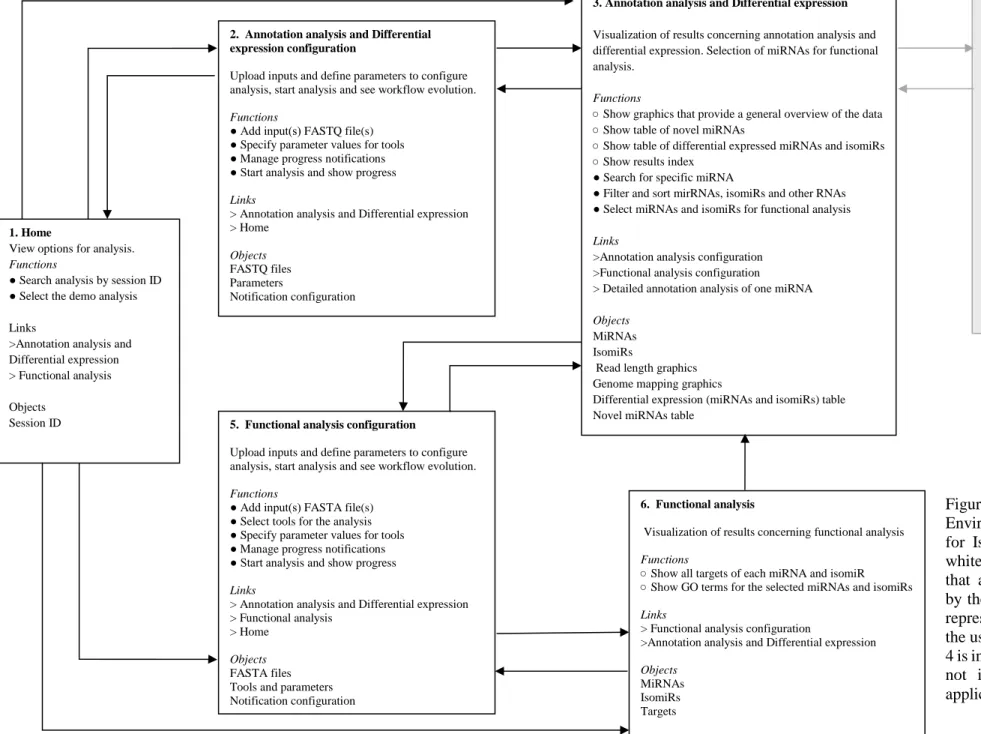
3.4 Frontend ... 42 3.4.1 Home ... 42 3.4.2 Annotation analysis ... 42 3.4.3 Functional analysis ... 45 3.4.4 Review analysis ... 46 3.5 Summary ... 47
Chapter 4 – Benchmarking the IsomiR Window tool ... 49
4.1 Methods ... 49
4.1.1 Datasets ... 49
4.1.2 Analysis settings ... 49
4.2 Results and discussion ... 50
4.2.1 Quality approval of datasets ... 50
4.2.2 Unravelling the miRNA complexity ... 52
4.2.3 Differential expression of isomiRs ... 53
4.2.4 IsomiRs functional impact ... 55
4.3 Summary ... 56 Chapter 5 – Conclusion ... 57 5.1 Main contributions ... 57 5.2 Acquired skills ... 58 5.3 Encountered challenges ... 58 5.4 Future work ... 58 References ... 59
Appendix A – User guide for the IsomiR Window tool ... 65
Appendix B – IsomiR Window virtual machine creation ... 67
List of figures
Figure 1.1. IsomiR Window tool components...2
Figure 2.1. The miRNA processing pathway ...6
Figure 2.2. FASTQ file format ...7
Figure 2.3. FASTA file format ...8
Figure 2.4. MVC architectural pattern ...14
Figure 3.1. Architecture of the IsomiR Window tool. ...20
Figure 3.2. The User Environment Design diagram for IsomiR Window tool ...21
Figure 3.3. Pipeline scripts for annotation and functional analysis ...23
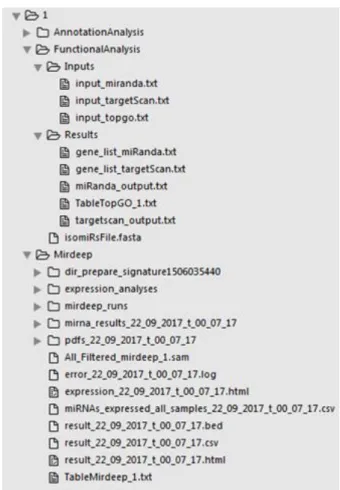
Figure 3.4. General folder organization for Session 1 ...24
Figure 3.5. Files and folders for session 1 ...25
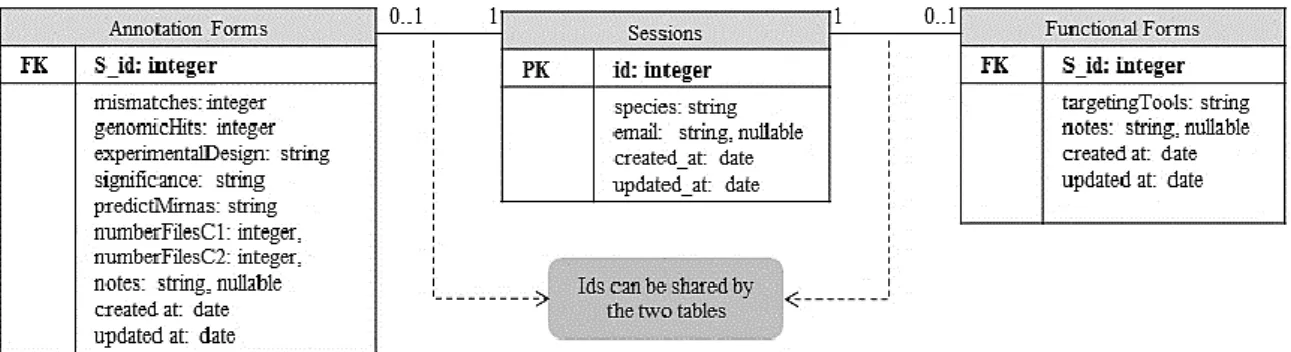
Figure 3.6. Relational database structure ...27
Figure 3.7. Annotation analysis sequence diagram ...32
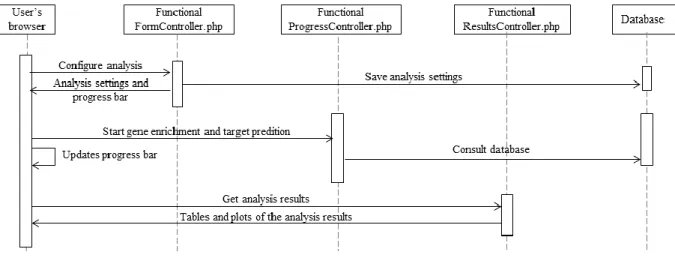
Figure 3.8. Functional analysis sequence diagram. ...33
Figure 3.9. Relation between the phases of the annotation analysis ...34
Figure 3.10. Relation between the phases of the functional analysis ...35
Figure 3.11. Activity diagrams for verification of the alignment and detection of sncRNAs phases of the annotation analysis module ...36
Figure 3.12. Activity diagram for the start of alignment and detection of sncRNAs phases for the annotation analysis module ...37
Figure 3.13. Activity diagram for the verification of the end of the prediction of novel miRNAs phase of the annotation analysis module ...38
Figure 3.14. Activity diagram for the start of the prediction of novel miRNAs phase for the annotation analysis module ...38
Figure 3.15. Activity diagram for the verification of end of the detection of isomiRs phase of the annotation analysis module ...39
Figure 3.16. Activity diagram for the start of the detection of isomiRs of the annotation analysis module ...39
Figure 3.17. Activity diagram for the verification of the end of differential expression analysis phase of the annotation analysis module ...40
Figure 3.18. Activity diagram for the start of differential expression analysis of the annotation analysis module ...40
Figure 3.19. Activity diagram for the verification of the end of target prediction and gene enrichment phases of the functional analysis module ...41
Figure 3.20. Activity diagram for the start of target prediction and gene enrichment of the functional analysis module ...41
Figure 3.21. IsomiR Window homepage ...42
Figure 3.22. Annotation analysis configuration webpage ...43
Figure 3.23. Annotation analysis progress webpage ...44
Figure 3.24. Error encountered during the alignment phase of the annotation analysis module...45
Figure 3.25. Functional analysis configuration with isomiRs found in annotation analysis ...45
Figure 3.26. Functional analysis configuration webpage ...46
Figure 3.27. Review Analysis section of Home webpage ...47
Figure 4.2. Distribution of reads across small non-coding RNAs types ...51
Figure 4.3. Frequency of miRNAs according to their biogenesis ...51
Figure 4.4. MiRNA raw counts ...52
Figure 4.5. Different types of isomiRs ...53
Figure 4.6. IsomiRs editing events ...53
Figure 4.7. Heatmap displaying the differentially expressed isomiRs. ...54
Figure 4.8. Partial table of differentially expressed isomiRs . ...55
Figure 4.9. Selected isomiRs for functional analysis. ...55
List of tables
Table 2.1. Comparison of functionalities between the isomiR analysis tools. ...11 Table 2.2. Comparison between MVC frameworks. ...17
Chapter 1 – Introduction
The IsomiR Window project aims to develop a user-friendly tool that enables biologists to perform the analysis of small-RNA-seq data, uncovering the complexity of miRNA biogenesis. The tool enables the discovery of all types of miRNA variants through a web interface that interacts with a Perl based pipeline. This thesis is focused on the development of a user-friendly analysis interface aiming to include enhanced visualization features, establishing a new bridge between small-RNA-seq data and the underlying biology of small non-coding RNAs with a clear focus on miRNAs.
This first chapter addresses the context and the motivation for the thesis, as well as its main goals. Additionally, the methodology applied and the document overview is also provided.
1.1 Context and motivation
Next-Generation Sequencing (NGS) has been greatly used in past years since it allows to sequence, in parallel, millions of sequencing reads, producing a great amount of data in a small period of time [1]. Specifically, small-RNA sequencing (small-RNA-seq), which uses NGS, allows to obtain the sequences of all types of small-non-coding RNAs (sncRNAs) existent in a sample, in which are included miRNAs, sncRNAs that are able to regulate gene expression [2]. Importantly small-RNA-seq data enabled to reveal the existence of frequent variations of miRNA canonical sequences, generating multiple variants: the isoforms of miRNAs (isomiRs) [2]–[6]. To extract the relevant biological information from this type of data, the development of bioinformatics tools that will enable developing integrative analysis in a user-friendly manner is in high demand.
Currently, that are several bioinformatics tools that allow the systematic identification of isomiRs [7]–[18]. However, despite the effort of these software tools to provide specialized computational frameworks to analyze small-RNA-seq data, they usually lack features, not allowing the researcher to capture the full complexity of isomiRs.
One feature that some of the tools lack is a complete analysis of small-RNA-seq data, in other words, they lack the possibility to perform annotation analysis and functional analysis in an integrative manner [7], [10], [12]–[14], [16], [19]. This means that in these cases, the researcher is forced to use multiple software tools to obtain the intended output. Additionally, in some of the tools that only provide annotation analysis, the results produced do not contain all the information the researcher needs. For example, the prediction of novel miRNAs, the detection of other non-coding RNAs, and the detection of miRNAs holding single nucleotide polymorphisms or editing events, are results that are not produced by the existing tools that perform annotation analysis [10], [12], [14], [16], [19], making them somewhat incomplete.
Another feature that the majority of these tools lack is a graphical-user interface (GUI) [9]–[15], [17], making them difficult to be used by researchers that do not have computational or bioinformatics knowledge. This can be very frustrating for the researcher because, without the proper knowledge, installing one or more technologies through the command line can become a difficult task to perform due to software dependencies and compatibility.
To our knowledge, only two tools, CPSS [8] and DeAnnIso [18], present a GUI and perform annotation and functional analysis. However, now focusing only on DeAnnIso (which is an updated version of CPSS), it only allows the analysis of one dataset at a time and displays restrictions in file size, which are not compatible with the expected size of NGS datasets (larger than 1Gb). Furthermore, the produced results do not allow capturing the complexity and the biological relevance of the identified
isomiRs in an objective and interactive manner. In other cases, such as the differential expression table, the results are too extensive, increasing the probability for user’s frustration.
Therefore, this project aimed to contribute to the development of a tool (IsomiR Window) that allows the integrative analysis of small-RNA-seq data, allowing to process several datasets in parallel, without file size restriction and with a GUI that is quick and easy to use. This user-friendly GUI enables the analysis of NGS data, allowing the characterization of sncRNAs, with a special focus in isomiRs and integrating all relevant functionalities in the same application, without the need for the researcher to use several applications and perform manual processing. It is also intended to provide the interactive visualization of results, characterizing objectively the complexity of sncRNAs found in the data.
The user-friendly interface was developed based on the web architecture, which enables a user with little or no experience to perform NGS data analysis, providing a real bridge between biology and informatics. The web application integrates a bioinformatics pipeline (developed in parallel by a colleague and outside the scope of this thesis), enabling to query small-RNA-seq datasets for all possible types of isomiRs and further allowing the investigation of their functional consequences at the cell level. In Figure 1.1 are shown the two main components of the IsomiR Window tool, web application and pipeline, both sharing responsibilities for enabling annotation and functional analysis.
Figure 1.1. IsomiR Window tool components.
1.2 Goals
The first goal of this project was to develop a graphical, user-friendly, interface (GUI) for a web application, which is one of the main components of the IsomiR Window tool, allowing a comprehensive analysis of sncRNAs with a focus on isomiR species by processing small-RNA-seq datasets.
The second goal of this thesis was to test the developed tool using publicly available small-RNA-seq data. The selected datasets came from a study [20] aiming to profile changes in miRNA expression occurring in human naive CD4 T cells, in response to T cell receptor (TCR) stimulation and to infection with the human immunodeficiency virus type I (HIV1). However, in that study the miRNA complexity at the isomiR level was not explored, therefore this data was used to benchmark the IsomiR Window tool.
1.3 Methodology
To accomplish the proposed goals, the project was organized in four different stages, namely familiarization, system analysis and design, development of a backend for handling domain logic and a frontend for providing the user interface, and tool benchmarking.
The familiarization stage consisted in a review of the state of the art literature regarding isomiR biology and available methods for analysis. The comparison between the existing tools for isomiR analysis was also performed.
For the system analysis, a study of tool requirements was performed, and for the system design, a User Environment Design (UED) [21] diagram was built to define the workflow and functions supported by the application. When building the diagram, the connection between the two types of analysis, annotation and functional, within the application, was always considered.
In the development of the backend and frontend, several technologies were used, such as the Laravel framework and PHP language, the MySQL database, HTML and CSS, JavaScript and AJAX, and Highcharts (library used to develop charts). Web services were developed, through REST (Representational State Transfer) protocol, to obtain information about the analyses and to communicate with the pipeline layer, for example to initiate a new phase within an analysis or to report errors.
For the tool benchmarking, a set of small-RNA-seq datasets derived from human T cells was used.
1.4 Contributions
This thesis contributed to the IsomiR Window project at two different levels. The first contribution was the development of a web application, built from scratch that allows a comprehensive analysis of sncRNAs with a focus on isomiRs. This web application invokes a pipeline for data analysis allowing, through the GUI interface, the utilization by users with few or no bioinformatics skills. A virtual machine featuring a free operating system, the web application and pipeline, and all software packages they depend upon to run was also built. This virtual machine is ready to use through a virtualization software, such as VirtualBox. IsomiR Window, integrates different functionalities crucial for the identification of isomiRs and the understanding of their biological impact that are lacking currently available tools.
The second contribution was the benchmarking of IsomiR Window tool using human small-RNA-seq datasets. Through this benchmarking it was proven that the results produced by IsomiR Window allow exploring miRNA complexity in human datasets, which has not been previously observed.
1.5 Document overview
The document is divided into five chapters and it is organized in the following order: ▪ Chapter 1 consists in a summarized description of the entire project.
▪ Chapter 2 presents the key concepts for the development of the project, concerning bioinformatics and web development. In addition, a critical analysis of competing applications is also presented.
▪ Chapter 3 describes the different steps in the design and development of the web application. ▪ Chapter 4 describes the different parts of an analysis of real datasets in the developed web application. Descriptions of the data, results of the analysis, and conclusions that can be drawn from them, are presented.
Chapter 2 – Concepts and related work
The current chapter has been divided into three sections. The first section consists in the description of the state of the art concerning microRNA biology. The second section describes several tools that perform isomiR analysis. In the third and last section, the concepts concerning web development are described.
2.1 MiRNA biology and complexity in NGS data
MicroRNAs (miRNAs) are small non-coding RNAs (sncRNAs), with the approximate size of 22 nucleotides. These small non-coding RNAs act as post-transcriptional central regulators of gene expression by the induction of transcript degradation or translational inhibition of their target messenger-RNAs (mmessenger-RNAs) [22], making them, also relevant disease biomarkers.
MiRNAs originate from double-stranded RNAs (dsRNAs), called primary miRNAs (pri-miRNAs) [23]–[25]. Pri-miRNAs are later processed into precursor miRNAs (pre-miRNAs) by the RNA endonucleases Drosha and Pasha [26]. After that, the pre-miRNAs are exported to the cytoplasm, where they are processed into a miRNA-miRNA duplex by two rounds of endoribonuclease cleavage, being Dicer the most relevant enzyme in this process [27]. Upon processing, one strand of the miRNA duplex (mature miRNA) will target mRNAs, mediating all RNA silencing pathways [28]. The miRNA biogenesis pathway is displayed in Figure 2.1 below.
The usage of high-throughput sequencing methods, also known as Next-Generation Sequencing (NGS), have the ability to sequence many different small RNAs at single-base resolution, on a genome-wide scale and in a single instrument run, at a very reduced cost when compared to traditional methods [1]. NGS has been broadly used to study the small RNA transcriptome [2], [29]. The only disadvantage of this technology it is the fact that each sequencing experiment produces up to 3 Gbp of sequence data, whose analysis represents an important bioinformatics challenge, even though a considerable number of user-friendly and efficient analysis software have been developed to fill the gaps.
2.1.1 MicroRNA variants: isomiRs
The use of NGS allowed researchers to observe modifications of the canonical miRNAs that comprise the addition or trimming of nucleotides at either end of the miRNA, and also nucleotide substitutions. All of these processes originate miRNA variants, that, when detected, became known as isomiRs [3]–[6], [30], [31].
IsomiRs can be classified into three different groups: 5’ isomiRs, 3’ isomiRs and internal isomiRs. The most predominant process that leads to the production of 5’ and 3’ isomiRs, is the imprecise and alternative cleavage, by Dicer or Drosha [4].After this cleavage, the isomiRs generated will match the genomic template but differ (having a smaller number of nucleotides) in their 5’ and/or 3’ end positions. 5’ isomiRs, in particular, can also arise from differential processing of paralogous pre-miRNAs.
Furthermore, there are other mechanisms by which 5’ and 3’ isomiRs can be generated. One of these processes is nucleotide addition at the 3’end of a miRNA, and is most commonly characterized by uridylation or adenylation events. One or more nucleotidyl transferase enzymes catalyze these events. If the isomiRs with the added nucleotides align perfectly with the pre-miRNA, they are then defined as a ‘templated’ isomiRs, otherwise they are defined as ‘non-templated’ isomiRs [32], [33]. A special case of nucleotide addition is the addition of non-templated nucleotides by terminal nucleotidyl transferases, giving rise to a special form of 3ʹ isomiRs. This process is mainly known as tailing.
Figure 2.1. The miRNA processing pathway [34].
Another post-transcriptional modification is exonuclease-mediated nucleotide trimming, and this process is another mechanism for the production of 3’ isomiRs [35]. The 3ʹ end trimming, that produces this type of isomiR, requires the 3ʹ-to-5ʹ exoribonuclease Nibbler [36].
It is important to refer that some isomiRs undergo changes at both 5’ and 3’, causing them to be mixed isomiRs.
MiRNA editing is another process that leads to the generation of isomiRs by post-transcriptional enzymatic editing of the miRNA sequence [4], [5]. The most dominant type of miRNA editing is adenosine deamination, which is frequently referred to as adenosine-to-inosine (A-to-I) editing, and occurs with highest frequency in noncoding regions [37]. This process occurs at frequencies that are similar to sequencing errors [34], and they are often found in isomiRs that originate from miRNA family members from different loci [35]. These variations must be distinguished from nucleotide variations detected in isomiRs derived from the existence of single nucleotide polymorphisms (SNPs) in miRNA genes [38].
In general, in a given miRNA family containing variants, the miRNA and its isomiRs often display the same 5’ end, while the 3’ ends are significantly more variable and often affect the length of the isomiRs [39]. Importantly, while being less frequent 5ʹ end changes of the miRNA have a stronger functional impact, since this region harbors the miRNA seed region. The seed region is located in nucleotides 2–7 [28], [40], and corresponds to the canonical site of target recognition. The complementarity between a miRNA and its target can be perfect involving the full sequence of the miRNA or it can be partial, involving solely the miRNA seed region, reason why a single miRNA can regulate the expression of thousands of different targets. [40]. Importantly, the 5ʹ ends of miRNAs are constrained because argonaute protein loading typically selects for miRNAs with distinct 5ʹ nucleotides [41], [42].
Given that the regulatory roles of miRNAs are mainly the result of sequence specific binding to their target RNAs, it is possible to consider that isomiRs might function redundantly. However, recent studies showed that small differences in miRNA sequences are sufficient to give unique functions to isomiRs through differential target selection [43].
Furthermore, since both miRNA and its isomiRs originate from the same pre-miRNA, it is assumed that the expression patterns of isomiRs are analogous to those of their representative miRNA. However, it has been shown that some isomiRs accumulate in different conditions when compared to their
corresponding mature miRNAs [44], which could mean that the processing or modification of these miRNAs may be differentially regulated, and that their regulation of target RNAs is more dynamic.
In summary, 5’ end isomiRs cause a major effect in animal systems because the miRNA seed region is located within 5’ end of the miRNA. These isomiRs will typically bear a different seed sequence in comparison with the canonical miRNA, which is indicative of their potential to target different transcripts. Additionally, variations at the 3’ end of isomiRs are mainly associated with different lengths of the miRNAs, but by changing the affinity between the miRNA and their targets may also impact their function. Finally, internal editing in miRNA family members may affect the binding affinity for a specific target. Since a miRNA frequently targets many genes in the same family, an isomiR may preferentially target transcripts that are not frequent targets of the canonical miRNA and the sum of their activities may result in the regulation of the expression of a gene family [30].
The upcoming sections approach the different types of analysis that can be performed to assess small-RNA-seq data, and more specifically, miRNAs and their isoforms present in that data.
2.1.2 Annotation and differential expression analysis
Annotation analysis allows a comprehensive analysis of the small RNA transcriptome entities contained in the studied dataset. More specifically, the annotation of sequences provides detailed information of each sncRNA found in each dataset, namely the detection of miRNAs, isomiRs and of other non-coding RNAs, along with the prediction of novel miRNAs. In summary, this analysis allows the researcher to investigate the complexity of sncRNA biology existent in the studied biological samples.
In addition to this analysis, the detection of differentially expressed miRNAs (including their isomiRs) is also very useful to the understanding of the impact of differential miRNA processing in the studied biological context.
Files used in annotation analysis
The file format normally used for this type of analysis is FASTQ and FASTA. The FASTQ file format uses four lines per sequence. This first line begins with a ‘@’ character followed by a sequence identifier and an optional description. The second line corresponds to the sequence, the third line begins with a ‘+’ character that can be followed by the sequence identifier. The final line contains the sequence quality scores in ASCII (American Standard Code for Information Interchange) format. This is displayed in Figure 2.2.
Figure 2.2. FASTQ file format.
The first line of a FASTA file starts with a ‘>’ symbol and it provides a name and/or a unique identifier of the sequence. The second line is the sequence. The sequences may be protein sequences or nucleotides. An example of a FASTA file format is presented in Figure 2.3.
FASTQ
@HWIEAS269_0001:5:1:1074:5581#NTACAG/1 GTGGGTTATCAGAAC
+HWIEAS269_0001:5:1:1074:5581#NTACAG/1 aaaa`aaaaX^VX]a
Figure 2.3. FASTA file format.
Detection of miRNAs, isomiRs and other sncRNAs
The first step to detect sncRNAs is to map the reads (in FASTQ or in FASTA format) in a reference genome using an appropriate NGS aligner algorithm. This results in a SAM file, which is a text-based format for storing biological sequences aligned to a reference sequence developed by Heng Li [45] .
The detection of known miRNAs and of isomiRs is usually performed by comparison with the information available at MiRBase [46], a repository that has curated information regarding miRNA and pre-miRNA sequences as well as regarding their respective positioning in the species genome. The detection of other sncRNAs is usually performed by comparison with the RNA central [47], a repository of sequences and genomic coordinates for all families and types of sncRNAs in different species. Most algorithms use comparison by genomic coordinates for sncRNA assignment of mapped reads [7], [18].
Prediction of novel miRNAs
Novel miRNA is performed for mapped reads that are still not assigned to any category of sncRNAs. This task is commonly performed using miRDeep2 software [48].
The hairpin structures of the un-annotated unique reads are analyzed using RNAfold software [49]. Those that formed proper secondary hairpin structures are considered to be the novel miRNAs. The results for the prediction of novel miRNAs are normally presented in the form of a table.
Differential expression
Differential expression analysis consists in taking the normalized read count data and performing statistical analysis to discover quantitative changes in expression levels between experimental groups. Finding genes that are differentially expressed between experimental groups is a vital part of understanding the molecular basis of phenotypic variation. A number of software packages such as edgeR [50], DESeq [51], baySeq [52], and EBSeq [53], have been developed for differential expression analysis of RNA-seq data. The choice of the analysis method has to take into account the experimental design of the experiment. The results for differential expression are normally presented in forms of tables and heatmaps.
2.1.3 Functional analysis
The study of the functional analysis is performed focusing on differentially expressed isomiRs, which implies the prediction of miRNA and isomiRs targets and the probability of the enrichment of biological processes. This allows the user to obtain a comprehensive view of the changes incurred in the cell genetic program.
Files used in functional analysis
FASTA files are common in functional analysis. The format of this file is described in Figure 2.3.
FASTA
>hsa-mir-155 MI0000681 CUGUUAAUGCUAAUCGUGAUAGGGGUUUUUGCCUCCAACUGACUCCUACAU AUUAGCAUUAACAG >hsa-mir-29a MI0000087 AUGACUGAUUUCUUUUGGUGUUCAGAGUCAAUAUAAUUUUCUAGCACCAUC UGAAAUCGGUUAUPrediction of miRNA and isomiRs targets
Identification of potential targets may allow unraveling the potential gene network regulated by the expressed miRNAs. To do this, different algorithms have been developed, such as RNAhybrid [54], miRanda [55], TargetScan [56], and Pita [57]. All, except RNAhydrid, have an executable to allow local installation. These algorithms use criteria such as sequence complementarity of the miRNA seed region, thermodynamic stability of mRNA:miRNA duplex, target site conservation among closely related species or other features, to identify the putative miRNA targets. The major use of this prediction tools is the identification of putative target genes for posterior experimental validation. The results concerning target prediction are normally presented in form of a table.
Gene set enrichment analysis
Gene set enrichment analysis is performed upon the list of miRNAs and/or isomiR mRNA targets, and identifies the physiological functions and biological processes that are potentially driven the gene network. The tools normally used to achieve this analysis are the Gene Ontology, Pathway and Protein Domain information (DAVID) [58], and several packages of Bioconductor [59] in R environment [60] such as topGO [61], and GOStats [62]. The pathways identified as significantly enriched are usually represented in diagrams and graphics, whereas gene ontologies are presented in form of a table.
2.2 Existing tools for isomiRs analysis
There are several open source tools for analyzing small-RNA-seq data for identifying isomiRs. Thirteen tools were evaluated, regarding if these included the three main following types of analysis: annotation of sequences, differential expression (DE) and functional impact (see Appendix C for details). The results of the evaluation show that only five of the tools, mirAnalyzer, CPSS, IsomiRex, miR-isomiRExp, and DeAnnIso, have an online server and are able analyze Next-Generation Sequencing (NGS) derived data. However as the miR-isomiRExp [16] website (http://mirisomirexp.aliapp.com/) is not currently working, researchers which have NGS data have only four available tools: mirAnalyzer [7], CPSS [8], IsomiRex [19] and DeAnnIso [18], for which an evaluation of their graphical user interface (GUI) was performed.
Having a GUI is a key property that each tool should possess, because it allows users to interact with the tool through graphical icons and visual indicators, as opposed to text-based interfaces, typed command labels or text navigation. This makes the user’s task to learn the functioning of the tool easier and reduces the amount of errors that derive from using multiple tools. GUI takes advantage of the computer's graphics capabilities, enabling (applied to the context of this study) scientists lacking bioinformatics skills to analyze NGS data.
In summary, providing a graphical display is an advantage for a tool, because it is directly related with its usability. Usability is the degree to which a software can be used by specified consumers to achieve quantified objectives [63]. Applied to this project, the tool has a higher usability if its pipeline, for data analysis, is embedded within a web application. If the user runs each step of a pipeline, by himself, directly in the command line, more errors are likely to be made and a bigger amount of time is spent writing the commands with all its arguments (such as folder’s names and data files). If there is a defined and automatic chain of events, the tool is much easier to use, and this can be easily achieved with a web application (that provides a GUI), that is organized in focus areas relative to the user’s workflow.
A total of 12 analysis features were identified as crucial to be available in a GUI tool for isomiR analysis (see also Table 2.1). Each relevant feature is numbered and accompanied with a small description, being the summary of this comparison.
1. Creates session ID.
A session ID is a unique code created at the start of every session that allows easy and fast access to the on-going, or completed, analysis and respective results.
2. Provides a notification system.
The user receives a notification when an analysis has started, when it is completed and when an error occurs.
3. Performs annotation and functional analysis.
The tool allows the user to perform these two types of analysis (annotation analysis including differential expression), allowing the user to obtain a variety of relevant results.
4. Annotation analysis and functional analysis can be performed independently.
The user is given the choice to perform each analysis module independently.
5. Each analysis is performed for two conditions.
The user submits two inputs (samples) concerning two experimental conditions.
6. All parameters necessary to repeat an experience must be known.
The tool groups the values of the parameters defined in the start of each analysis, so that the user knows this information when starting or repeating an analysis.
7. Default setting of analysis parameters.
The values of all parameters are pre-defined, allowing the user to quickly start the analysis.
8. Example files are available to run each analysis.
Example files are provided for each analysis (annotation and functional), allowing the user to assess the potential of tool performing quick start analysis.
9. Display of a progress bar that changes accordingly to evolution of the analysis.
The workflow allows the user to understand, after the start of an analysis, which step of it is being performed.
10. Clear and concise help about the annotation and functional analyses.
The tool must provide help and documentation to the user. This information must easy to search, be focused on the user’s current task, list concrete steps to be carried out, and not be too long.
11. Results can be downloaded independently or in a bundle.
The results can be downloaded independently, or they can be downloaded in a ZIP file. This ZIP file also has all the elements necessary for repeating the experience.
12. Provides a results index.
The results’ index groups the results present in each webpage, allowing an easy access to any result in the index.
After the comparison between the four tools, displayed in Table 2.1,it is possible to observe that both isomiRex and mirAnalyzer, in terms of functionalities, allow performing an incomplete set of analysis, not even performing annotation of sncRNAs and functional analysis. CPSS does not allow the user to analyze data from different experimental conditions, which is usually applied to any experimental design.
Table 2.1. Comparison of functionalities between the isomiR analysis tools.
Requirements isomiRex mirAnalyzer CPSS DeAnnIso
1. Creates session ID x x
2. Provides a notification system x x
3. Performs annotation and functional analysis x x
4. Annotation analysis and functional analysis can
be performed independently x
5. Each analysis is performed for two conditions x x x
6. All the parameters necessary to the repeat of the
analysis must known x x x
7. Default setting of analysis parameters x x x
8. Example files are available to run each analysis x x
9. Display of a progress bar that changes
accordingly to evolution of the analysis x x
10. Clear and concise help about the annotation
and functional analyses x
11. Results can be downloaded independently or in
a bundle x
12. Provides a results index x x
DeAnnIso is the tool that offers more functionalities. For this reason, it was attempted to measure the time taken by DeAnnIso to perform a single analysis, the equivalent to the annotation analysis module. This, however, could not be achieved, since the file format is different (FASTA format instead of FASTQ format used in IsomiR Window), the number of files for experimental condition is limited to one, and the size of the submitted files cannot exceed 50 MBytes, which is not compatible with the size of the data of an NGS library.
2.3 Web development
When discussing web development, it is important to highlight the two parts that, together, form a web application. In one part is the client, represented by the frontend that utilizes Uniform Resource Identifiers (URIs) to access information contained in the web server, located in the backend, though, in most cases, the Hyper Transfer Protocol (HTTP). The frontend supports the interaction with the user and it is built through the use of three different languages: HTML, which defines the document structure, CSS that establishes rules for the layout of the different document elements and JavaScript, which controls the behavior of those elements [64].
The second part is the backend, where the server and all its connections are based. The server’s function is to accept a request from the client and reply to this request, usually by presenting a requested web page [64]. Instead of replying with a web page, the server can pass information to the frontend though the use of web services. These are called by AJAX technology, in the frontend. Additionally, the
server has common gateway interface that can use several languages, such as PHP. The server is also responsible of establishing the connection with the database whenever there is a need to insert, update or delete data.
There are many building blocks that can be used in web development, which are introduced in the section below. In addition, the concept of frameworks, the base of the web application, is explained, as well as which frameworks are most commonly used nowadays.
2.3.1 Client building blocks
In this section, the building blocks used to produce the frontend are presented.
HTML
HTML5 [65] is a markup language used for defining the structure of web pages, making their contents interpretable by the browser. The new version, 5, introduces new changes that assist in the development of web applications. One of the most addressed changes in HTML5 is the functionality that allows browser native support for Scalable Vector Graphics (SVG) graphics.
Elements such as <table> and <form> are often used to enrich the semantic content of the documents. They allow the creation of tables and forms, respectively, within the document. Additionally, these two elements can interact, allowing the user to insert a table within a form to store any relevant information that this table might contain. Other elements such as <a> are also very useful, allowing the user to navigate to a different webpage or to download files available in the webpage.
CSS
CSS [66] is a language that describes the presentation of HTML documents. These rules can be applied to a single HTML element (with the id attribute), applied to a group of elements (with the class attribute) or to elements that share the same tag name.
The CSS should be in a separate file so that the rules defined can be applied to all the documents that compose the application, making the all pages visually coherent. Additionally, because the CSS file has a small size, it is possible to quickly load the defined rules and store the file in the browser’s cache, so it can be reused for all HTML pages that share that same CSS file, without contacting the web server.
JavaScript
Through the years, HTML developed the ability to support event handlers, which are usually small functions that are executed when a specific event occurs in the browser. Examples of these events are actions such as clicking on a button, stop pressing a key when typing in a field, or even the reloading of the webpage. The implementation of these events handlers requires a programming language such as JavaScript [67], that is capable of being executed in the client side of a web application. Therefore, JavaScript can read and change the contents of HTML elements, as well as the style of these elements, through the modification of CSS rules. JavaScript is also useful for data validation, controlling the user’s input data before this data is passed to the server.
AJAX
Web applications characterized by responsive user interfaces and by interactive features represent an easier and more functional mode for the development of these applications, improving the user’s experience. AJAX technology [68] stands for Asynchronous JavaScript and XML, although Extensible Markup Language (XML [69]) isn’t necessarily used. Using AJAX, an HTML page can perform asynchronous calls, through HTTP, to the server and loads the content of the response, which can be XML, HTML, simple text or JavaScript objects. This response can be used to alter the displayed document’s content without being necessary to reload the webpage.
An example for the use of AJAX is a progress bar, which is being updated as it receives information from the server, through different calls. Another example of AJAX is the auto-completion of words in a field that is being filled by the user.
2.3.2 Server building blocks
In this section, the building blocks used to produce the backend are presented.
Web Services
Web services are a group of methods that are accessed and invoked by other programs using web technologies. They are mainly used in system integration and in the communication between applications, allowing new systems to interact with the existent ones and also allowing compatibility of the developed systems in different platforms [70]. They are also used to transmit the data between the database and the frontend in a bi-directional path.
There are several ways to implement these services, however two can be highlighted: SOAP (Simple Object Access Protocol) and REST (Representational State Transfer) [71].
To access information of a web server it is necessary to know which type of desired request and information. There are several HTTP methods that can be used to perform requests, and this is achieved by URIs (Uniform Resource Identifier) [72]. Four HTTP requests are the most relevant and they are:
▪ GET – obtain information of a resource; ▪ POST – adds information to a resource; ▪ PUT – updates information of a resource; ▪ DELETE – deletes a resource.
PHP
PHP [73] is a server scripting language, and a powerful tool for developing dynamic and interactive web pages. It is widely-used, free, and supports different types of operating systems, being one of the first languages to be directly integrated with HTML. The PHP code is interpreted by the server, which generates a dynamic output - output that varies according to the interaction with the users and the data that is being manipulated.
PHP supports user sessions, database access, and is capable of invoking other programs that are installed in the server.
2.3.3 Model-view-controller frameworks
For the web application, desired for this project, there are several frameworks that can be used in its development. In this section is described the importance of using a framework, a brief introduction to the Model-View-Controller (MVC) architecture pattern, what elements to consider when choosing a framework, and a summary of the most popular frameworks used nowadays, such as Laravel [74], Symfony [75] and CodeIgniter [76].
Usage of a framework
PHP is a server scripting language that provides services for handling email, database interaction, and more. Because of its power and flexibility, coding in plain PHP to build a web application works, but there are several activities that can go wrong, such as developing meandering code that performs many functions in one place. This leads to disorganized code, which is a big maintenance problem, because the code it is not as easy to reuse and understand. Testing is another problem that arises when using plain PHP code. Because the code is not necessarily divided into fine units, it can be extremely
difficult to test this code. Additionally, when working in a team, in a regular PHP application, it can be very difficult to have multiple people operating on different aspects of the application at the same time. Frameworks offer solutions for many of these problems. The main advantage of using a framework is that it provides a guideline to be followed in the development of the application. This guideline mainly consists in dividing the code into several files that follow a documented organization, making it easy to reuse them throughout in the different parts of the application. This division also makes the task of changing a piece of the code much easier, which is a plus for updates of the application in the future. Another key advantage of using a framework is that it allows multiple people on a team to work on the application at the same time.
One thing to consider when using a framework is that it comes with a learning curve. Whereas a single PHP page can contain all the domain logic, database access, and the data presentation, in a framework, all the parts have to be separated into different components, which can take additional time. The developer has to learn how the code must be organized and what is offered by the framework, namely its Application Programming Interface (API). Despite the learning curve, frameworks lead to better organization of the code, making the development and maintenance of the application more productive.
Understanding MVC: Model-View-Controller
At the core of every framework is the concept of patterns or architectural patterns. MVC stands for Model-View-Controller, and this pattern represents the concept of dividing an application into three coherent aspects: the Model (Data layer), the View (User Interface layer), and the Controller (mediates user interface interactions and updates to the Model) [77]. In Figure 2.4 is shown a diagram representing the MVC pattern.
Figure 2.4. MVC architectural pattern [78].
Each framework implements the pattern in a specific way, defining which changes affect the different aspects and coding practices are embedded in the framework.
Framework programmatic concepts
There are some core development concepts that need to be understood for the evaluation of which framework to choose and for the learning of how to use the chosen framework.
The first concept is Pattern usage: whether the framework strictly enforces the usage of MVC and other patterns, or if it is more flexible in terms of how the code is organized and naming conventions. It is also important to analyze the classes that are included within a framework, and these mark the difference when developing an application. They provide shortcuts to building several functionalities, that otherwise would have to be built from scratch. Therefore, analyzing which classes are available in a specific framework and, whether the users are obliged to use them is a key part of the process.
Another concept to keep in mind is Modularity. It is important to assess if the framework accepts modules from other frameworks, allowing the developer to use these separate modules for the growth and better functioning of the application.
The final concept is Standards. The PHP Framework Interoperability Group (PHP-FIG) [79], a consortium of PHP developers, created in 2009, that come from all of the major MVC frameworks, has created the PHP Standards Recommendations (PSRs). An important standard is the Composer. Composer is a tool for managing dependencies in PHP applications, downloading them automatically. Frameworks that support it, make it much easier to use their elements, as well as install them in the development environment.
Understanding how a framework incorporates pattern usage, code organization, data handling mechanisms, availability of components, modularity, user interface helpers, and standards, helps in choosing a framework and using it.
Comparing concepts
In addition to the programmatic concepts, it is also important to evaluate other key elements when deciding which framework to use. They include licensing, whether the framework is light weight or heavy weight, documentation and community support, complexity and performance.
The type of license that the framework uses can be an important decision factor. Some make it easier to be bundled in software packages, others do not.
As for the weight, some frameworks are light weight and simply provide a basic structure for the developer to follow, whereas others provide many tools, making the application very tightly tied to that framework, and will also restricted by the framework's limitations for performance and features. In fact, the developer is not obliged to use these tools, but the community for this type of frameworks tends to use them, not only for the existent support but also because of the official documentation.
It is important to assess the documentation of the framework, verify if there are complementary books available, and if there are any online courses. This concept is relevant because, once a framework is chosen, it will determine how easy it will be for the developer to learn it.
Additionally, the community and how active developers are in that community should also be evaluated. A common quantifier of this element is how many Stack Overflow [80] questions exist, and are answered, for the framework of interest.
Scalability and performance are also elements to have into consideration. The weight of these considerations, however, depends on the type of application that is being built, and how many users it will have.
Relevant frameworks
Symfony framework
Symfony [75] has long been one of the most popular PHP frameworks for several reasons. It has a solid code base community and good documentation, it is flexible, has a toolbox for rapid application development features, and its learning curve is relatively slow. Symfony is backed by the company SensioLabs, is currently on version 3.2 and it has been distributed with the MIT license.
Previous versions of Symfony have leaned towards the full-stacked model. Currently it is possible to use the full-stack framework or just some of its modules separately, making it flexible. These modules
can be installed with the Composer PHP dependency manager, and be used in other frameworks such as Laravel, which is another is described later in this section. In addition, Symfony helps programmers create scalable applications that are flexible to changing business requirements. Symfony’s ability to use different Object-relational Mapping (ORM) systems, is one of the reasons why this framework is one of the top choices for programmers.
Even though Symfony has all these features, beginner level developers might find it complicated due to its complex structure.
In summary, Symfony excels because its modules are portable and the full-stack provides a lot of power as well as flexibility. However, it can be challenging to understand and learn at first.
CodeIgniter framework
CodeIgniter (CI) [76] is commonly used by PHP developers who prefer a lighter weight framework. In 2014, CI management changed to the British Columbia Institute of Technology. CI had a couple of different licenses, but starting in the 3.0 version, an MIT license was adopted.
This framework has a very small footprint and it is not strictly based on the MVC development pattern, but provides many components that help with rapid application development. Because of its light weight, it can be very flexible, which can help when working with hosted environments. It is also highly decoupled, which means a developer can use a much or as little of the framework as required. It is not strict in terms of enforcing usage or coding rules.
CI was a very popular framework at one point, but it stalled in development during a large period, and for that reason some aspects of the framework are somewhat behind some of the other frameworks. It was not until version number 3.1.5, released in June of 2017 that CI integrated Composer. Additionally, CI is not a member of the PHP-FIG and it doesn't use built-in namespaces.
In summary, CI is easier to begin using by someone unfamiliar with frameworks, supports object-oriented programming and structuring large applications. Its installation is easy and the framework itself is fast (because of its small size, when compared to modern giants like Symfony and Laravel). However, development stagnated for a long time. Lots of modern PHP practices were adopted during this time, leaving CodeIgniter behind. It lacks modern namespace and autoloader use.
Laravel framework
Laravel [74] is recent to the PHP Framework space, having been released in 2011. It has already moved to version 5 and acquired an active and productive user base. This framework is one of the top used PHP frameworks and one of the reasons developers are finding Laravel so compelling is that it leverages the latest generation of programming libraries. The version of Laravel, when developing the current project, uses a number of different components from Symfony. Interestingly, the flow goes both ways, being possible for Symfony users to work with Laravel components. The reason for this efficient development is the fact that Laravel supports Composer.
Database access and management are an important aspect of most web applications. Laravel’s database component is called Eloquent ORM. Eloquent was created by Laravel, but as it is a self-contained package, it can be used outside of the framework. Eloquent works with an ActiveRecord pattern, which allows easy inserting, updating and deleting of records.
Another benefit of using Laravel is its command line interface called Artisan. The framework is REST-friendly and uses many JavaScript constructs, which is why it is one of the best frameworks for developing AJAX applications. Laravel ships with its own template engine called Blade and uses a very intuitive routing mechanism. It also has an official website, Laracasts, that offers many video tutorials. A disadvantage of Laravel is that its core files are stored within its namespace and not all of these files use a namespace slash (a \) for calling another core file. This makes it difficult for the developers to extend some classes. This is, however, not a big issue for all the developers.

![Figure 2.1. The miRNA processing pathway [34].](https://thumb-eu.123doks.com/thumbv2/123dok_br/15599773.1051874/22.892.251.643.104.432/figure-the-mirna-processing-pathway.webp)
![Figure 2.4. MVC architectural pattern [78].](https://thumb-eu.123doks.com/thumbv2/123dok_br/15599773.1051874/30.892.161.736.624.955/figure-mvc-architectural-pattern.webp)