COMPARATIVE PERFORMANCE ANALYSIS OF PORTUGUESE BANK BRANCHES
Maria Conceição A. Silva Portela*Universidade Católica Portuguesa Porto, Portugal
Emmanuel Thanassoulis Aston Business School
Birmingham, U.K. [email protected]
Abstract: The advent of Internet banking and phone banking is changing the role of bank branches from a predominantly transaction-based one to a sales-oriented role. This paper reports on an assessment of the branches of a Portuguese bank in terms of their performance in their new roles in three different areas: Their effectiveness in fostering the use of new transaction channels such as the internet and the telephone, their effectiveness in increasing sales and their customer base, and their effectiveness in generating profits without compromising the quality of service. We have used Data Envelopment Analysis for the assessment, departing from the basic models to accommodate radial and non-oriented measures of performance.
Keywords: Performance measures, Efficiency, Banking
INTRODUCTION
The emergence of new forms of banking presents a challenge to the predominance of bank branches as the main avenue of providing financial services. These alternative ways of banking include, phone banking, Internet banking and automatic banking (through automatic teller machines - ATMs). The increasing use of alternative banking channels for basic transactions changes the traditional role of bank branches as transactional centres. The survival of bank branches depends, therefore, on a refocusing of their activities. This means placing less importance on the delivery of transactional services and more importance on exploiting the potential of branch networks as selling outlets for financial services (see e.g. [1], [2] and [3]).
Existing studies on bank branches efficiency do not in general account for the changing role of bank branches and still use as a main output of banking activities the number of transactions performed (e.g. [4], [5], [6], [7]). More recently some authors (e.g. [8], [9]) acknowledged the new role of bank branches distinguishing between sales related and transaction related activities that bank branches carry on. In this paper we also distinguish between these two types of activities, but we go further on identifying key performance dimensions of bank branches that go beyond the operational related activities of selling and performing transactions.
MEASURING THE PERFORMANCE OF A
SET OF PORTUGUESE BANK
BRANCHES
Many of the managers of the Portuguese bank under analysis believe that the growing use of new distribution channels does not constitute a threat to the survival of bank branches, at least not in the short run. This fact is, instead, taken as an opportunity since bank branches can move a number of time consuming activities to these new channels, leaving branches with more time to devote to value-added activities.
Traditional transactional activities (like withdrawals, deposits, general enquiries, money transfers, etc.) consume human resources’ time that is more expensive than ATM’ time or Internet and phone facilities' time. If this type of activity moves away from branches, then there is scope for increasing efficiency and profitability of bank branches as long as customers do not see these changes as a reduction in the quality of the service provided. Seeing these new means of distribution as an opportunity for increasing profits, banks, and particularly the bank under analysis, have charged their branches with the responsibility for motivating customers to use other channels and free their time for other activities that add more value to the bank as a whole. As a consequence, the main objectives that bank managers ask their branches to pursue are:
• To foster an effective use of new distribution channels so that branch personnel can use their time in value-added activities;
• To increase sales and the customer base of the branch, while serving the clients that visit the branch with high service quality levels; • To manage the product mix in a way that
generates high profitability, without reducing service quality associated with any product. Given these emerging objectives it is important to develop corresponding performance measures to assess the extent to which each of these objectives is being achieved by bank branches. For this purpose, we developed three performance measures: transactional, operational, and profit, corresponding to each of the objectives stated above. Performance is measured through Data Envelopment Analysis (DEA), a non-parametric technique suitable for use when homogeneous organisational units (like bank branches) are being compared (for details on this methodology see e.g. [10] and [11]).
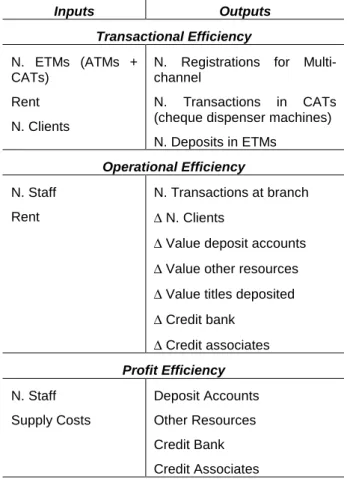
Different DEA models were developed to measure performance on each dimension. The set of variables used in each performance assessment is detailed in Table 1, where the symbol ∆ stands for ‘change in’.
Inputs Outputs Transactional Efficiency N. ETMs (ATMs + CATs) Rent N. Clients
N. Registrations for Multi-channel
N. Transactions in CATs (cheque dispenser machines) N. Deposits in ETMs Operational Efficiency N. Staff Rent N. Transactions at branch ∆ N. Clients
∆ Value deposit accounts
∆ Value other resources
∆ Value titles deposited
∆ Credit bank ∆ Credit associates Profit Efficiency N. Staff Supply Costs Deposit Accounts Other Resources Credit Bank Credit Associates
Table 1: Inputs and Outputs of the three efficiency
assessments
Given the set of inputs and outputs chosen to assess the three performance dimensions these can be defined as:
Transactional Efficiency – The extent to which a bank branch fosters the use of ATMs and CATs (cheque dispenser machines) at the bank branch, and also the use of the Internet (measured through the number of registrations for internet use each month), given the electronic resources at the disposal of the branch, its clients base, and its location (measured through the surrogate ‘rent’).
Operational Efficiency – The extent to which a bank branch serves its customers on general transactions, and increases its clients base and the value of a number of products (deposit accounts, other resources1, and credit), given the number of staff it has and its location. Thus it reflects the combined effect of attracting customers and serving customers.
Profit Efficiency – The extent to which a bank branch achieves a high value of revenue generating products (deposit accounts, other resources and credit) given the costs it faces with personnel and supplies.
The data we have to measure the performance of bank branches on the three dimensions pointed out above are monthly data. This means that in order to measure operational efficiency we consider the change in the value of a number of items from month to month rather than sales (we would prefer to use sales but sales values were not available). This results in some outputs being negative. In order to apply DEA to negative data we developed our own models that are based on the directional distance model developed in [12] and [13]. The output ‘number of transactions at the bank branch’ is considered non-discretionary, i.e., an output that the bank branch does not want to improve. This is consistent with the new role of bank branches that focus especially on selling and prefer transactions to be performed on alternative distribution channels. Note that we present in Table 1 a reduced set of variables that accounts for limitations in the data. Otherwise we would like to consider in the operational efficiency assessment inputs relating to the market potential the branch is in since this is a factor potentially affecting its ability to increase customers and the value of the various products it sells. The profit efficiency assessment uses non-oriented models so as to reflect the difference between revenues and costs as the
1
Other resources include term deposit accounts, investment funds, savings insurance, etc.
quantity to be maximised. We developed our own models to assess profit efficiency, which are based on a geometric distance function (see [14]). Operational and transactional efficiency assessments use output oriented measures, and the latter is based on the traditional BCC model of [15]. Note that in the operational assessment the outputs measure flows, whereas in the profit assessment the outputs measure stocks. For this reason, the operational and profit assessments complement each other as will be seen in the next section.
Main Results
Results were produced for each performance dimension. DEA results consist of an efficiency score that shows how far each bank branch is from 100% efficiency. These efficiency scores permit the ranking of branches in each dimension. Apart from efficiency scores, DEA also identifies for each bank branch input and output levels that should be achieved so that 100% efficiency is attained, and benchmark units that should be used by each inefficient bank branch as a role model. We will not detail here on specific results obtained for each branch for the sake of brevity.
An important result of our analysis is the cross comparison of bank branches on each performance dimension. As each dimension is intended to capture different aspects of bank branches’ activities, it is possible that some bank branches are good in terms of generating profit but not so good in terms of their operational objectives, or vice versa. Consider for example results obtained from the operational and profit efficiency assessments, which are shown in Figue 1. The values in this figure are average efficiency scores from March 2001 to September 2002. 0.8 0.9 1 0.0 0.1 0.2 0.3 0.4 0.5 0.6 0.7 0.8 0.9 1.0 Profit Efficiency O p er at io n a l E ff ici en cy B22 B40 B11 B55 B36 B45 B4 0.9000 1.0000 0.9 1.0 1.0 B16 B17 B53 B37 B12 B29 B34 B49 B50 B33 B60
Fig. 1. Profit Vs Operational Performance
We choose in Figure 1 a threshold of 90% for good performance and consider that below this value branches have poor performance. This threshold is arbitrary since the managerial implications of drawing such a graph do not really depend on the chosen threshold, but on the amount of units close to the ideal performance (1, 1). Units with superior performance both in profit and operational terms can be classified as ‘stars’ and they represent benchmarks to be emulated by all the other branches. Problematic branches are those that represent low operational and profit technical efficiency. Branches with high profit efficiency and low operational efficiency do not exist in our data set. The absence of units in this quadrant confirms a common sense feeling that units with low operating efficiency cannot be efficient in generating profits. The correlation coefficient between average profit and operational efficiency is 0.3 and this value is significant at the 5% level. This means that higher operational efficiency tends to be associated with high profit efficiency as expected from the variables included in our models.
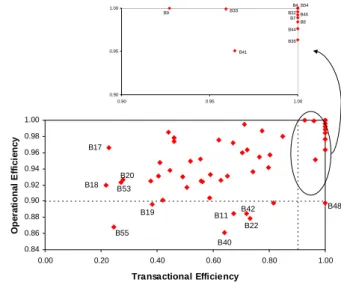
Comparing profit and operational efficiency with transactional efficiency shows a positive and statistically significant correlation between transactional efficiency and operational efficiency (coefficient of 0.46 significant at the 1% level), but a non-significant correlation between profit and transactional efficiency. In Figure 2 we show the matrix that cross compares operational and transactional efficiency. 0.90 0.95 1.00 0.90 0.95 1.00 B4, B54 B32 B7 B46 B8 B44 B36 B41 B33 B9 0.84 0.86 0.88 0.90 0.92 0.94 0.96 0.98 1.00 0.00 0.20 0.40 0.60 0.80 1.00 Transactional Efficiency O p er a ti o n a l E ff ic ien cy B55 B18 B17 B48 B20 B53 B19 B40 B22 B11 B42
Fig. 2. Operational Vs Transactional Efficiency
In the same way as before we can see some units in the ‘star’ quadrant, showing high
operational and transactional efficiency. There are no branches in the low operational-high transactional quadrant in Figure 2, meaning that branches that are good performers in moving transactions to other means of distribution are also in general good performers in operational activities that are not transactions related. This fact confirms our initial hypothesis that moving transactions to alternative means of distributions gives bank branch's staff more free time to dedicate to value-added activities that relate with increasing sales and the customer base of the bank branch. Since operational efficiency measures the extent to which the branch is able to perform well these value-added activities, the fact that no bank branches can be found in the low operational-high transactional quadrant means that those bank branches that have low transactional efficiency also have low operational efficiency.
There are factors not included in the analysis that may potentially affect performance. Such factors are the age of the bank branch, the level of competition it faces, location, and service quality. The age of a bank branch seems to affect especially its profit efficiency since this variable is not statistically significantly correlated with transactional or operational efficiency. The correlation coefficient between age and profit efficiency is 0.317 and this value is statistically significant at the 5% level. This means that younger bank branches tend to have inferior performance on profit terms. Indeed, younger bank branches experience a high growth in the first years of activity (being therefore expected to have a high operational efficiency) but they did not reach yet a volume of accounts that allows them to be considered efficient from the profit perspective. The youngest bank branches in our sample are B36, B54 and B45. All these branches are located in the quadrant of low profit efficiency and high operational efficiency in Figure 1. The low profit efficiency of these branches is, however, justified by their age meaning that these bank branches are potential ‘stars’ as they mature. Note that the average age of ‘stars’ is 8.8 years old, the average age of high operational low profit units is 8.4 years old, and the average of units in the low operational low profit quadrant is the highest and equal to 9.3 years old. The age of a bank branch seems therefore to be a factor affecting its performance. In that sense, low profit efficiency should be considered problematic only for cases of mature branches, where it might indicate some problems of the bank branches that consume too much resources for producing a given volume of accounts.
Results show that competition (measured by the number of bank branches in a ray of 1 km from the branch assessed) and location of the bank branch were not important factors in explaining performance differences. Correlation coefficients between competition and the three performance dimensions are in all cases negative, indicating that more competition tends to negatively influence performance, but non-statistically significant in most cases. As far as location is concerned bank branches may be in one out of 5 location types. We tested for differences in averages for the five locations and results pointed out for non-statistically significant differences between location types for the three performance measures. This does not mean that location is not important in determining performance, but that our efficiency measures accurately accounted for differences in locations through the surrogate ‘rent’.
Service quality is an important aspect to be accounted for in service organisations like bank branches. Excellent branches are those presenting superior performance in the three dimensions pointed out above while at the same time presenting good levels of service quality. We used a service quality index provided by the bank to analyse the relationship between service quality and the other dimensions of performance. Service quality is particularly related with operational efficiency and profit efficiency with a correlation coefficient of 0.43 for the former and 0.37 for the latter, both statistically significant at the 1% level. As far as transactional efficiency is concerned the correlation between service quality and transactional efficiency is negative (-0.09) but it is not statistically significant. This fact seems to suggest that the efficiency by which bank branches move transactions away from the bank branch does not affect service quality. This is an important finding since it means that customers do not associate the increasing use of alternative distribution channels with losses in terms of service quality (nor gains).
Consistency of Results with Prior Views
of the Bank
The results presented here were also presented to the manager of the branch network in order to ascertain the extent to which the bank branches identified as best performers in this study were in fact so from the perspective of the bank. This was an important part of the study since most of the variables used in the assessments differ from those we considered ideal. For this reason, it was important to ascertain if, despite our data limitations, the
models were capturing what they were supposed to.
Concerning transactional efficiency, the network manager agreed with our classifications for almost all branches. Some of the best transactional performers identified are located in rural areas, and the manager agreed that despite this fact some of these bank branches showed a very good performance in their transactional role.
Operational and profit performances were also showed to the network manager. In this case, certain confusion arose between profit efficiency and profit in absolute terms. When we said that a bank branch was efficient in terms of profit there was the tendency to associate this with high profits. It was, therefore, important to clarify concepts since high profit efficiency does not necessarily correspond to high profit. Having clarified concepts it was agreed that most of the bank branches that we identified as good performers in terms of profit efficiency, operational efficiency, and service quality were in fact considered best performers by the bank. These were the performance dimensions around which discussion was centred since transactional efficiency is not clearly associated with the other dimensions except with operational efficiency.
It is worth noting that in analysing performance on the three dimensions mentioned above there was more agreement on the identification of the worst performers rather than on the identification of the best performers. For example the network manager showed no doubts in considering branches B40, B22, and B55 as bad performers. Some reasons were pointed out for this, since problems at these bank branches were well known to management. For example, one of these bank branches is located in the centre of Oporto and it was recognised that technology at this branch was obsolete, and that it was experiencing some difficulties in motivating customers to use other distribution channels. This means that branch staff is mostly occupied with serving clients on general transactions and there is not much time left for selling. At the same time it was recognised that personnel at this bank branch was not pro-active in trying to sell and capturing new clients, remaining this as a bank branch from old times where transactions at the branch is still the main activity carried out by staff. For another bank branch in the worst performer group it was said that this bank branch received several clients from another bank branch that closed and clients were not satisfied with this change, which was clearly influencing the overall performance of that branch.
As far as best performers are concerned there was less agreement. In some cases branches identified as the best performers were located in small rural cities and it was not expected to see these bank branches appearing as best performers. This mainly arises due to the fact that the business volume at these branches is not very high and therefore this type of bank branches is not seen as contributing much to the profits of the bank as a whole. Nevertheless, most of the branches that were considered on the best performers group were accepted to be so by the network manager. One of the most important disagreements related with branch B11, which was seen by the network manager as a role model branch. In our case this branch was classified in the group of the worst performers since it exhibited low operational, low profit efficiency, and low service quality (note however that the values in these performance dimensions were not the lowest, neither were close to the lowest). In terms of transactional efficiency this bank branch is not amongst the best as well. The reasons for this disagreement were not completely sorted out, but one of the issues that came out related with the transactional load at this bank branch that was in the opinion of the network manager higher than our values showed. Our variable concerning number of transactions at the bank branch is a sum of the following transactions: cheque deposits, cash deposits, cash withdrawals, payment of bank cheques, and internal transfer. It might happen that other transactions, not considered here, are used by the bank to assess the transactional volume of a bank branch and therefore we are not considering all the transactional load of bank branches. Under this circumstance bank branches that present a high number of transactions that were not considered in our assessments might indeed appear as inefficient when they are not. This might have been the case of branch B11.
In a study like the one that was undertaken here it might happen that, in some cases, the information concealed from the analysis is more important than the information actually included in the analysis. It is impossible to consider all possible variables that explain differences in performance between bank branches. It is therefore important to keep in mind that our results only reflect differences between bank branches on the variables that were considered on the efficiency assessments. This means that many reasons might exist for explaining why some bank branches were considered less efficient than others. Such reasons should be looked at on the variables that were not considered in the assessment, which for some cases might be more important than those
considered. Apart from these limitations, which are inherent to any quantitative study, we believe that this study indeed captured important performance differences between bank branches and mostly classified them rightly. In addition, the relationship identified between the various performance dimensions confirmed our initial expectations regarding the link between these performance dimensions.
CONCLUSION
This paper considers a novel way to assess the performance of bank branches focusing on three dimensions of performance that were considered important by the bank under analysis: transactional, operational and profit. Performance comparisons on each dimension allowed the identification of benchmark units and also the identification of problematic units that need to be looked at carefully. Our results show some interesting links between performance dimensions. Namely, we conclude that transactional efficiency is positively related with operational efficiency and that operational efficiency is positively related with profit efficiency. Service quality is also positively related with profit and operational efficiency but seems to be unaffected by transactional efficiency. From the factors not accounted for in the analysis, age seems to be the one that mostly explains some differences in performance, especially as far as profit efficiency is concerned. Our results were discussed with the network manager and in general our classifications of best and worst performers were considered accurate.
References
[1] Drake, L. and Howcroft, J.B. (1995), Measuring
the relative efficiency of the selling function: An application of Data Envelopment Analysis to UK Bank Branches, Loughborough University
Banking Centre, Working Paper N. 89/95.
[2] Howcroft, J.B. and Beckett, A. (1993), Change in
the UK bank branch networks: A customer Perspective, The Service Industries Journal, 13/4,
267-288
[3] Howcroft, J.B. (1992), Contemporary issues in UK
bank delivery systems, International Journal of
Service Industry Management, 3/1, 39-56.
[4] Sherman HD and Gold F.(1985), Bank Branch Operating Efficiency: Evaluation with DEA, Journal of Banking and Finance, 9/2, 297-315. [5] Vassiloglou M. and Giokas D. (1990) A Study of
the Relative Efficiency of bank Branches: An Application of Data Envelopment Analysis,
Journal of Operational Research Society 41/7, 591-597.
[6] Drake L. and Howcroft B.(1994), Relative
Efficiency in the Branch Network of a UK Bank:
An Empirical Study, Omega, The International
Journal of Management Science 22/1, 83-90. [7] Athanassopoulos A. D. (1997), Service quality and
operating efficiency synergies for management control in the provision of financial services: Evidence from Greek bank branches, European
Journal of Operational Research 98, 300-313. [8] Cook, W. D., Hababou, M. and Tuenter, H. J. H.
(2000), Multicomponent Efficiency measurement
and shared inputs in data envelopment analysis: an application to sales and service performance in bank branches, Journal of Productivity Analysis
14, 209-224.
[9] Cook, W. D. and Hababou, M. (2001), Sales
performance measurement in bank branches,
Omega, The International Journal of Management Science 29, 299-307.
[10] Cooper, W.W. and Seiford, L.M. and Tone, K. (2000), Data Envelopment Analysis: A comprehensive text with models, applications, references and DEA-Solver software, Kluwer Academic Publishers, Boston.
[11] Thanassoulis, E. (2001), Introduction to the theory and application of Data Envelopment analysis: A foundation text with integrated software, Kluwer Academic Publishers, Boston.
[12] Chambers, R. G., Chung, Y. and Färe, R. (1996)
Benefit and distance functions, Journal of
Economic Theory, 70, 407-419.
[13] Chambers, R. G., Chung, Y. and Färe, R. (1998)
Profit, directional distance functions, and Nerlovian efficiency, Journal of Optimization
Theory and Applications, 98(2), 351-364.
[14] Portela, M. C. A. S. And Thanssoulis, Emmauel (2002), Profit Efficiency in DEA Aston Business School Research Paper RP 0206, ISBN 1 85449 502 X, University of Aston, Aston Triangle, Birmingham B4 7ET, UK.
[15] Banker R. D., Charnes A., and Cooper W. W. (1984), Some models for estimating technical and
scale inefficiencies in Data Envelopment Analysis,