A Work Project, presented as part of the requirements for the Award of a Master’s degree in Economics from the NOVA – School of Business and Economics.
IMMIGRANT WAGE ASSIMILATION PROFILES IN PORTUGAL: A LONGITUDINAL ANALYSIS FOR 2002-2017
BEATRIZ MARIA CORREIA GONÇALVES 25977
Work Project carried out under the supervision of: Professor Cátia Batista
1
Immigrant Wage Assimilation Profiles in Portugal: A
Longitudinal Analysis for 2002-2017
Beatriz Gonçalves, 25977
January 6, 2020
ABSTRACT
Using a longitudinal dataset matching workers and firms based in Portugal, this work project analyses the wage assimilation patterns between immigrant and native workers in the Portuguese labour market for the 2002-2017 period. Updating in part an existing study, the results dictate that the wage gaps between average immigrants and natives remain as experience in the Portuguese labour market increases. Within skill levels, the wage differences’ evolution depends on the levels of immigrants’ pre-immigration experience and their education level upon arrival. When decomposing immigrants by nationality groups, immigrants from the EU15, CEEC and China present the most contrasting results.
Keywords:Immigration, Longitudinal Dataset, Portugal, Wage assimilation JEL Codes: F15, F22, J31, J61
This work used infrastructure and resources funded by Fundação para a Ciência e a Tecnologia (UID/ECO/00124/2013, UID/ECO/00124/2019 and Social Sciences DataLab, Project 22209), POR Lisboa (LISBOA-01-0145-FEDER-007722 and Social Sciences DataLab, Project 22209) and POR Norte (Social Sciences DataLab, Project 22209).
I would like to thank professor Cátia Batista for her guidance, professor Pedro Brinca for the dispensed resources and professor João Pereira dos Santos for his advice and availability. Additionally, I would like to thank my dear friends Miguel Fonseca and José Coelho for all the suggestions and support, and also my colleagues Vitor Cavalcante and Piero De Dominicis for helping me overcome some technical issues with the database.
2
1. INTRODUCTION
According to the United Nations (2019), the increase in global number of international migrants continues to outpace growth of the world’s population. The number of international migrants reached an estimated 272 million in 2019, an increase of 51 million since 2010, comprising 3.5 per cent of the global population. Migration integration has therefore been a growing relevant topic on debates regarding countries’ immigration policies. Many natives worry that immigrants are competing for their jobs, with these tensions being aggravated due to the slowdown of job growth compared to population growth. On the one hand, immigrant populations positively shape and contribute to the economies of their new countries, while on the other hand, destination countries who fail to integrate immigrants suffer economic and societal consequences (OECD, 2014). Therefore, it seems imperative that the destination countries develop policies in order for immigrants to become more similar to natives in terms of skills and behaviour, increasing assimilation chances.
The wage assimilation concept describes how the wage difference upon arrival between immigrants and natives evolve over time in the destination country. Its study in the labour market plays an important role, informing immigrant workers if their wages will be similar over time to the ones of comparable natives, hinting if the destination country will be economically attractive in the long run. As an example, Bah (2018) found that due to overeducation, the high skilled are less likely to migrate to Portugal compared to the low skilled, because going into the destination country while being overeducated turns out to not compensate in the long run.
Regarding immigration in Portugal, it started to become a reality on a larger scale only in the late nineties. It has origin on the end of the dictatorship in 1974, which brought a mass return of Portuguese citizens from former African colonies, and the adhesion to the European Economic Community (EEC) in 1986. Until the mid-1990s, immigration occurred mainly from lusophone countries (the PALOP and Brazil), being relatively modest in international terms; In
3
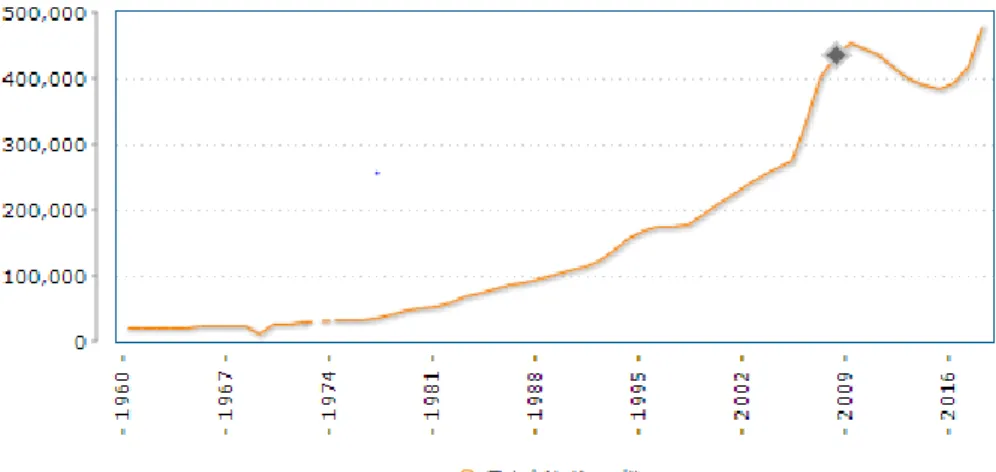
the late 1990s, a new wave of immigrants occurred mostly from eastern and south-eastern European countries, and more intensely from Brazil and China. According to PORDATA, there were 477,472 foreign individuals with legal resident status in Portugal by 2018, comparing to only 20,514 foreign individuals by 1960, translating into a 2227.54% increase in immigration over almost 60 years (see Figure 5 in Appendix A for this evolution of immigration).
Given the increase of both immigration and its heterogeneity in Portugal, do immigrants and natives earn the same with time spent in Portugal? This work project proposes to tackle the wage assimilation pattern: how years since migration influence the wage assimilation of immigrants, using a matched employer-employee longitudinal database – Quadros de Pessoal (QP) – from 2002 to 2017. It will update, in part, the study of Cabral and Duarte (2013), who used the QP dataset from 2002 to 2008. This work project contributes to the literature since it makes use of a larger time span than the aforementioned study, having a larger sample size. This increase of the time under analysis permits to follow workers over more years, increasing the accuracy of the simulated wage profiles specified below. Moreover, since the number of immigrants and its heterogeneity has changed during the years added to the analysis, it can modify some of the results to be tested, changing some conclusions possibly. Through simulated wage profiles over 50 years in the Portuguese labour market1, it will be analysed the
wage assimilation curve for the average native and immigrant worker and within certain nationalities (EU15, CEEC, PALOP, China and Brazil)2. The analysis will also be extended for the average worker within gender (male/female immigrants’ wages relative to wages of male/female natives) and between worker’s skill levels (low, medium and high skilled levels).
1 50 years were chosen in the analysis of the simulated wage profiles as a time span that can be considered a limit spent in the workforce, instead of 30 years as in Cabral and Duarte (2013), in an attempt to see how many years in the Portuguese labour market it would take for immigrants to reach wage parity. Also, with the help of the figures presented in section 5, one can still check what would be the wage difference after 30 or 40 years too, for example. 2 EU15 includes the initial 15 Member-States of the European Union, except Portugal. CEEC (Central and Eastern European countries) includes Slovakia, Poland, Czech Republic, Hungary, Estonia, Slovenia, Latvia, Lithuania, Romania, Russian Federation, Moldova, Ukraine and Serbia. PALOP (Países Africanos de Língua Oficial Portuguesa) refers to the former Portuguese colonies in Africa (Angola, Cape Verde, Guinea Bissau, Mozambique, and São Tomé and Príncipe).
4
Overall, it was found that the initial negative wage gap of the average (male) immigrant relative to natives is not fully mitigated as experience in the Portuguese labour market increases. For females, the relative wage gaps are smaller than the corresponding gapsfor males. When splitting immigrants by skill levels, the wage gaps depend on the levels of immigrants’ pre-immigration experience and their education level upon arrival. When considering the main nationality groups, immigrants from the EU15, CEEC and China assume the most contrasting cases, with immigrants from EU15 having positive wage gaps throughout the 50 years in Portugal, and immigrants from CEEC and China having the biggest disadvantage in wage gaps. The remainder of the paper is structured as follows: the next section presents previous literature on wage assimilation. Section 3 describes the dataset used and section 4 introduces the methodology. Section 5 presents the empirical results and section 6 concludes.
2. LITERATURE REVIEW
In order to assess wage assimilation, defined as the evolution of the wage gaps between immigrants and natives over time in the destination country, three methods have been discussed: the original cross-section methodology, the synthetic cohort method and longitudinal/ panel data analysis. The earliest literature on the effect of duration in the destination country used cross-sectional data,comparing at a point in time different cohorts of immigrants who arrived at the destination country in various time periods. Starting with the “positive assimilation” model by Chiswick (1978b) based on the United States Census, he assumed that the pre-migration skills are not perfectly transferable when immigrants move from a lower to a higher income country, resulting in a wage disadvantage upon arrival for immigrants, but with this penalty narrowing with time spent in the destination country3. Soon researchers noted that the effect of years since migration on the labour market outcomes observed in cross-sectional data
3 Chiswick (1978b) found an assimilation rate of 2% per year in the United States, meaning that an initial wage gap of 30% is completely vanished after 15 years in the destination country.
5
may give biased estimates, keeping in mind the longitudinal effect that individuals experience4. One solution is the use of longitudinal/ panel data that follows the same individuals over time and, hence, estimate the assimilation profile of immigrants that stayed in the country for a given period5. However, since longitudinal data on immigrants’ wages tend to be a scarce resource, Borjas (1985) proposed an alternative approach denominated as “synthetic cohort methodology” (SCM), which follows samples over time defined by year of immigration and age, advocating forsubstantial differences in earnings potential across immigrant cohorts. He found that cohort effects exist, documenting that newly arrived immigrant cohorts in the US had relatively lower entry earnings than earlier cohorts. Comparing with the cross-sectional results, accounting for these cohort effects in wage levels substantially reduces the rate of wage assimilation. Nevertheless, Borjas (1985) was aware that his estimates may be biased due to selective emigration, labour force withdrawal or mortality. This type of survivor bias is inexistence with panel data since it compares the same immigrants across time6.
Regarding more recent studies, Lubotsky (2007) found that over the first 20 years in the United States, immigrant earnings grow by 10-15 percent relative to the earnings of native workers when measured in longitudinal data, while with repeated cross sections of the census over the same time period, immigrant earnings grow twice as fast, by about 26 percent. Therefore, he found that selective out-migration by low-earning immigrants gives the misleading impression that the economic status of immigrants to the United States improves substantially faster as they assimilate into the US labour market. Moreover, it is proved that overall immigrants earn less upon arrival than comparable native workers. Focusing on studies based only on longitudinal data, some of the results are in line with Chiswick and Miller
4 The bias can result, for example, due to selectivity in the return migration of immigrants and if there are changes over time in the unmeasured dimensions of the quality of immigrants.
5 However, longitudinal data do not overcome the problem of structural change in immigrant absorption.
6 Survivor bias is the logical error of concentrating on the individuals that made it past some selection process and overlooking those that did not, typically because of their lack of visibility.
6
(2012). Immigrants’ wages tend to catch up to natives’ wages as they acquire country-specific human capital, and as experience in the destination country increases, the negative wage gap tends to diminish but at a decreasing rate. For Spain (Izquierdo et al., 2009), Italy (Dell’Aringa et al., 2015), Germany (Zibrowius, 2012) and even Sweden (Per Lundborg, 2007), it was found that a complete wage assimilation for immigrants is never achieved, meaning that immigrants’ wages lag behind natives’ wages in these destination countries.
For the case of Portugal, Cabral and Duarte (2013) were the pioneers in studying the relative wages of immigrants in the Portuguese labour market using a longitudinal dataset for the 2002-2008 period.They came to the conclusion that the wage gap upon arrival between natives and immigrants in Portugal was due to differences in the returns of their endowment’s characteristics and to the immigrant status effect, with education and foreign experience of the average immigrants being less valued in the Portuguese labour market. The authors also found that the wages of immigrants do not fully converge to those of comparable natives as experience in the Portuguese labour market increases, pointing that if there is a convergence of relative wages, the assimilation rates tend to be stronger in the first years since migration and for immigrants with higher levels of pre-immigration experience.
3. DATA
This section presents the used dataset, its pros and cons and the procedures used to refine it in a way that renders it useful for the analysis. The dataset used was retrieved from the database of personnel records in Portugal, Quadros de Pessoal (QP). It is an annual compulsory employment survey of all firms, covering virtually all wage earners in the Portuguese economy7. When an individual enters private employment, each worker is given an
7
identification number that is unique and remains constant over time. Thus, QP is characterized as a longitudinal dataset matching workers and firms based in Portugal.
Using the QP dataset, only the wage assimilation profile of employed immigrants that stayed in Portugal for a certain period of time can be estimated, and not employment assimilation since the QP database only covers individuals employed in the reference period. As well, the QP dataset does not cover domestic work, which is often linked to the informal economy, possibly leading to an underestimation of immigrants in the Portuguese labour market (especially of female immigrants, since many of them are linked to such sector).
The data started being collected in 1986, except 1990 and 2001, and continues to this day. Since nationality at the country level of the worker is the only information capable of identifying immigrant individuals and since the information on the nationality of the worker only became available from 2000 onwards, the analysis was thus restricted from the year 2002 to 2017. It is assumed that workers who declare at least once to be of foreign nationality are immigrants and maintain that same nationality throughout the whole period in analysis (see D’Amuri et al., 2008, for this assumption).
To eliminate inconsistent or missing reports, restrictions were imposed to the data. The analysis was restricted to workers for whom there was information available for a set of key variables (gender, age, nationality, sector of activity and tenure) and restricted to workers aged between 15 and 80 years. Since attracting full-time immigrant workers is a political and economic objective, the analysis is focused on full-time employees, therefore only being considered employees that reported a base wage of at least 80 per cent of the minimum legal wage8. Moreover, whenever a worker was present in more than one firm in a given year, it was kept the register corresponding to the maximum wage. To exclude potential outliers, the top and bottom one percent of observations with respect to real monthly wages were dropped.After
8 By law, workers formally classified as apprentices can receive a minimum wage that is, at least, 80 per cent of the full rate (Cabral and Duarte, 2013).
8
these adjustments, the sample consists of an unbalanced panel of 30,953,800 observations, of which 29,740,147 are natives and 1,213,653 are immigrants from varied nationalities.
Regarding the variables used, to identify the real monthly wage as the dependent variable9, it was used a regular wage measure including the base wage (monthly gross pay for normal hours of work) and the regular subsidies and premiums paid on a monthly basis. To identify formal education, the QP dataset has information on the highest level of education completed by each worker, but no information on the country where that level of education was attained. Therefore, foreign and domestic schooling cannot be differentiated. However, it is reasonable to assume that most of these immigrants completed their education in their country of origin, since recent immigrant flows in Portugal were linked with employment opportunities (Cabral and Duarte, 2013). Having as guide the International Standard Classification of Education (ISCED) 2011 classifications, 6 education variables were ultimately defined10. For
the traditional assimilation variable of the time spent in the destination country referred to as years since migration (𝑦𝑠𝑚𝑖𝑡), the QP database has no information on the date of arrival of
immigrants in Portugal, therefore 𝑦𝑠𝑚𝑖𝑡 cannot be attained directly. Thus, a proxy for 𝑦𝑠𝑚𝑖𝑡 was obtained, corresponding to the difference between the reference year t and the year an individual first entered the database. A proxy for work experience was also computed as the potential work experience (𝑝𝑤𝑒𝑥𝑝𝑖𝑡): age minus years of education minus 6 for both natives
and immigrants11. However, this proxy assumes each worker enters the labour market
immediately after finishing school and that the employment period is continuous with no episodes of unemployment or inactivity for both natives and immigrants. For the experience in the Portuguese labour market of natives, possible periods of employment abroad of native workers due to emigration are assumed to have the same wage returns as employment in
9 Cabral and Duarte (2013) chose real hourly wage as the dependent variable. 10 For a description of the education variables, see Table 3 in Appendix B.
9
Portugal. For immigrants, using the potential experience to measure the foreign experience of immigrant workers, it implicitly assumes that experience was uninterruptedly accumulated in their country of origin.
For a characterization of the final sample used, check Table 4 in Appendix C, which reports the sample means of some relevant variables for natives and immigrants, as well as for the main nationality groups of immigrant workers present in the Portuguese labour market for the years 2002-2017.
4. METHODOLOGY
Following the model by Chiswick (1978b) as a benchmark, and altered by Cabral and Duarte (2013) to support the restrictions and adjustments done to the database used, one can derive the following equation:
𝑙𝑜𝑔𝑊𝑖𝑡 = 𝛼 + 𝛽0𝑖𝑚𝑖𝑖+ 𝛽1𝑦𝑠𝑚𝑖𝑡+ 𝜑1𝑦𝑠𝑚𝑖𝑡2+ 𝛽2𝑝𝑤𝑒𝑥𝑝𝑖𝑡+ 𝜑2𝑝𝑤𝑒𝑥𝑝𝑖𝑡2+ 𝛾2𝑖𝑚𝑖𝑖∗ 𝑝𝑤𝑒𝑥𝑝𝑖𝑡+
𝜑3𝑖𝑚𝑖𝑖∗ 𝑝𝑤𝑒𝑥𝑝𝑖𝑡2+ ∑5𝑗=1𝛽3𝑗𝑒𝑑𝑢𝑐𝑗+ ∑5𝑗=1𝛾3𝑗𝑖𝑚𝑖𝑖∗ 𝑒𝑑𝑢𝑐𝑗+ 𝛿𝑋𝑖+ 𝜃𝑦𝑒𝑎𝑟𝑡+ 𝜀𝑖𝑡
where the dependent variable – 𝑙𝑜𝑔𝑊𝑖𝑡 – is the natural logarithm of the real monthly wage of
individual i at time t. As for explanatory variables, 𝑖𝑚𝑖𝑖 is a dummy variable for immigrant status (equals 1 if the worker is an immigrant), 𝑦𝑠𝑚𝑖𝑡 is the proxy for years since migration, 𝑝𝑤𝑒𝑥𝑝𝑖𝑡 is the potential work experience, 𝑒𝑑𝑢𝑐𝑗 are the education categories based on the ISCED 2011 classifications (illiterate or Early Childhood Education workers as the omitted category), and 𝜀𝑖𝑡 is a conventional stochastic error term. Quadratic terms were introduced on
𝑦𝑠𝑚𝑖𝑡 to account for the fact that wages tend to increase at a decreasing rate with years in the labour market, and as well for 𝑝𝑤𝑒𝑥𝑝𝑖𝑡 to allow non-linear growth in earnings with greater
experience. The vector 𝑋𝑖 contains other characteristics that potentially affect wages, including:
a dummy variable on the worker’s gender – 𝑔𝑒𝑛𝑑𝑒𝑟𝑖 – (the reference group being male); a (1)
10
dummy variable identifying fixed-term contracts – 𝑐𝑜𝑛𝑡𝑟𝑎𝑐𝑡𝑖 – being permanent contracts the reference group; controls for sectoral activity with dummies based on the variable 𝑎𝑐𝑡𝑖𝑣_𝑠𝑒𝑐𝑡𝑜𝑟𝑗 (manufacturing industry being the reference group); controls for geographical effects to account for regional cost-of-living differences with dummies based on the variable 𝑛𝑢𝑡2𝑖 (Lisboa as the reference group). Finally, 𝑦𝑒𝑎𝑟𝑡 corresponds to year-specific effects (time dummies with 2002 being the reference group), which at first are assumed to have a common impact on the wages of natives and immigrants. See Table 3 in Appendix B for a full description of all these variables.
The coefficient 𝛽0 measures the wage gap upon arrival between an immigrant and a comparable native (both illiterate or with Early childhood Education and without any work experience)12. Ignoring for now the higher order polynomials for the sake of simplicity, the
coefficient 𝛽1 measures the difference between the returns to domestic and foreign work experience of immigrant workers. As for the coefficient 𝛽2, it has a different interpretation for immigrants and natives: for natives it represents the return to one additional year of domestic experience, while for immigrants is the return to one additional year of foreign experience. However, 𝛽2 coefficient can be seen as a weighted average of these two (potentially) different effects given the two returns to experience are constrained to be the same in equation 1.
The returns on human capital of native and immigrant workers must be allowed to differ. Literature states that the imperfect transferability of education and experience acquired in the country of origin tends to result in lower returns to foreign human capital of immigrants in comparison to natives’ domestic human capital. Moreover, returns to experience and education obtained in the country of destination were also found to differ between natives and immigrants. But given the characteristics of the QP database, it is not possible to completely differentiate returns to education of natives and immigrants since there is no information on the place where
11
education was obtained. A solution is to allow for different returns to education for natives and immigrants irrespective of the place where the formal schooling grade was attained. Therefore, the 𝛾2 coefficient captures the difference between the returns to one year of work experience of an immigrant in his country of origin and one year of experience of a native worker in Portugal. If one wants to measure economic assimilation through the rate of wage convergence between immigrants and natives in the destination country, the sum of 𝛽1 and 𝛾2 corresponds to the assimilation rate, capturing the difference in the returns to experience of immigrants and natives in the Portuguese labour market.13
The 𝛽3𝑗 coefficients report the returns to the different education categories for natives, while the 𝛾3𝑗 coefficients measure the difference in the returns to education between immigrants
and natives for the other educational levels considered.
Allowing for the impact of other variables to vary between natives and immigrants (coefficients 𝛾 in equation 2), a more flexible version of the previous equation was also estimated:
𝑙𝑜𝑔𝑊𝑖𝑡 = 𝛼 + 𝛽0𝑖𝑚𝑖𝑖 + 𝛽1𝑦𝑠𝑚𝑖𝑡+ 𝜑1𝑦𝑠𝑚𝑖𝑡2+ 𝛽2𝑝𝑤𝑒𝑥𝑝𝑖𝑡+ 𝜑2𝑝𝑤𝑒𝑥𝑝𝑖𝑡2+ 𝛾2𝑖𝑚𝑖𝑖∗
𝑝𝑤𝑒𝑥𝑝𝑖𝑡+ 𝜑3𝑖𝑚𝑖𝑖 ∗ 𝑝𝑤𝑒𝑥𝑝𝑖𝑡2+ ∑𝑚𝑗=3𝛽𝑗𝑥𝑗 + ∑𝑚𝑗=3𝛾𝑗𝑖𝑚𝑖𝑖∗ 𝑥𝑗 + 𝜃𝑦𝑒𝑎𝑟𝑡+ 𝜀𝑖𝑡
where m denotes the total number of covariates included in the model. Including interactions between the immigrant dummy and the variables considered, it is equivalent to estimating separate regressions for native and immigrant workers.Note that the coefficients estimated from the fully interacted model and from separate regressions are equivalent, but in the separate regression’s framework the variance of natives and immigrants is allowed to differ. See Table 5 in Appendix D for the regression estimates, controlling for different sets of variables.
13 In section 5, the wage assimilation of immigrants is examined using simulated wage profiles of native and immigrant workers, fully taking into account the effect of the quadratic polynomials.
12
For further analysis on worker’s education, equation 2 was augmented by grouping the education dummies in skill dummies (see Table 6 in Appendix E for the new skill dummies’ description). Similarly, given that for the case of immigrants equation 2 assumes the effects to be homogeneous across different nationality groups, for further analysis of immigrant heterogeneity, equation 2 was also augmented by replacing the immigrant dummy variable with a set of indicators for the main immigrant groups present in Portugal: EU15, CEEC, PALOP, China and Brazil. Separate regressions were estimated for each immigrant group, hence allowing all variables to have a differentiated impact across all nationality groups.
Since the obtained dataset is a (longitudinal) unbalanced panel, all the regressions were estimated by pooled OLS, for the 2002-2017 period14. OLS assumes homoskedasticity and no correlation between unit i’s observations in different periods (or between different units in the same period). As each worker is observed multiple times throughout theyears in analysis, there is most likely a violation of the assumption of independence among observations. A solution is to impose robust standard errors clustered at the worker level, permitting to adjust the errors to the lack of independence without having to explicitly model the correlation among workers.
Furthermore, immigrants’ wage assimilation can be estimated by rewriting equation 2, isolating the wage difference between the wages of immigrants and natives in the left-hand side and realizing that immigrants’ potential work experience (𝑖𝑚𝑖𝑖∗ 𝑝𝑤𝑒𝑥𝑝𝑖𝑡) can be substituted by the sum of foreign potential work experience (𝑒𝑥𝑝𝑜𝑟𝑖𝑔𝑖𝑡, constant over time for each immigrant), and years since migration (𝑦𝑠𝑚𝑖𝑡). The evolution of the wage gap over the years
in the destination country, i.e., theassimilation rate, can be expressed ultimately as follows15:
𝜕(𝑙𝑜𝑔𝑊𝑖𝑡𝐼 − 𝑙𝑜𝑔𝑊𝑖𝑡𝑁) 𝜕𝑦𝑠𝑚𝑖𝑡
= 𝛽1+ 𝛾2+ 2(𝜑1+ 𝜑3)𝑦𝑠𝑚𝑖𝑡+ 2𝜑3𝑒𝑥𝑝𝑜𝑟𝑖𝑔𝑖𝑡
14 Using OLS also allows comparisons with the existing literature. 15 For the full derivation of equation 2 into equation 3, see Appendix F.
(3)
13
Equation 3 can be interpreted as the sum of 3 main blocks of coefficients: block A accounting for the linear impact of an additional year of domestic experience on the wage difference between immigrants and natives; block B expressing the quadratic effect of that additional year; and block C representing the interaction between the returns to domestic and foreign work experience of immigrants.When considering only the linear returns to experience, the wage assimilation rate is given by the sum of 𝛽1 and 𝛾2, i.e., block A.
5. EMPIRICAL RESULTS
To better analyse the wage assimilation, it will be performed simulated wage profiles over a 50 years’ time span for a representative immigrant and comparable native with the following characteristics: a male individual in Lisboa with 12 years of schooling, in the manufacturing industry, with a permanent contract (same reference individual as in Cabral and Duarte, 2013). Most of the simulated wage profiles will be evaluated comparing two starting points in terms of work experience: workers with no previous work experience when entering the Portuguese labour market, domestic nor foreign, and workers with 18 years of previous work experience (domestic for natives and foreign for immigrants)16.
Throughout both of the next subsections, consider the parameter estimates from equation 2 presented in Table 1 and the parameter estimates from equation 3 presented in Table 2.
5.1. Linear returns and simulated wage profiles for the average immigrant
Analysing the first column of Table 1, the coefficient of the immigrant dummy is 16.8 log points17, meaning that the wage upon arrival of an immigrant whose characteristics match the omitted categories is 16.8 log points higher than the wage of a comparable native: illiterate or with early childhood education male individual, in the manufacturing sector, in Lisboa with
16 18 years of work experience was chosen as one of the starting points of the simulated wage profiles since it was found that the average level of work experience of immigrants upon arrival in Portugal was 18 years (in Cabral and
Duarte, 2013, the average level of work experience of immigrants upon arrival in Portugal was found to be 15 years).
14
Note: p-values in brackets and implicit standard errors are worker-cluster robust. See the main text and Table 3 in Appendix Bfor a full description of all variables included.
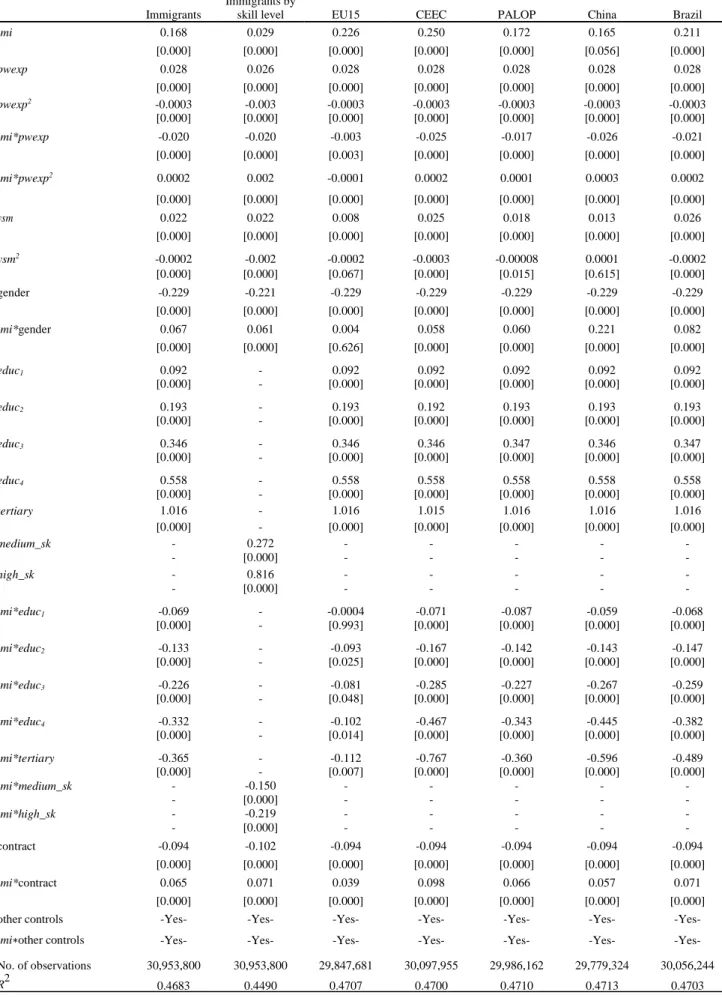
Immigrants
Immigrants by
skill level EU15 CEEC PALOP China Brazil
imi 0.168 0.029 0.226 0.250 0.172 0.165 0.211 [0.000] [0.000] [0.000] [0.000] [0.000] [0.056] [0.000] pwexp 0.028 0.026 0.028 0.028 0.028 0.028 0.028 [0.000] [0.000] [0.000] [0.000] [0.000] [0.000] [0.000] pwexp2 -0.0003 -0.003 -0.0003 -0.0003 -0.0003 -0.0003 -0.0003 [0.000] [0.000] [0.000] [0.000] [0.000] [0.000] [0.000] imi*pwexp -0.020 -0.020 -0.003 -0.025 -0.017 -0.026 -0.021 [0.000] [0.000] [0.003] [0.000] [0.000] [0.000] [0.000] imi*pwexp2 0.0002 0.002 -0.0001 0.0002 0.0001 0.0003 0.0002 [0.000] [0.000] [0.000] [0.000] [0.000] [0.000] [0.000] ysm 0.022 0.022 0.008 0.025 0.018 0.013 0.026 [0.000] [0.000] [0.000] [0.000] [0.000] [0.000] [0.000] ysm2 -0.0002 -0.002 -0.0002 -0.0003 -0.00008 0.0001 -0.0002 [0.000] [0.000] [0.067] [0.000] [0.015] [0.615] [0.000] gender -0.229 -0.221 -0.229 -0.229 -0.229 -0.229 -0.229 [0.000] [0.000] [0.000] [0.000] [0.000] [0.000] [0.000] imi*gender 0.067 0.061 0.004 0.058 0.060 0.221 0.082 [0.000] [0.000] [0.626] [0.000] [0.000] [0.000] [0.000] educ1 0.092 - 0.092 0.092 0.092 0.092 0.092 [0.000] - [0.000] [0.000] [0.000] [0.000] [0.000] educ2 0.193 - 0.193 0.192 0.193 0.193 0.193 [0.000] - [0.000] [0.000] [0.000] [0.000] [0.000] educ3 0.346 - 0.346 0.346 0.347 0.346 0.347 [0.000] - [0.000] [0.000] [0.000] [0.000] [0.000] educ4 0.558 - 0.558 0.558 0.558 0.558 0.558 [0.000] - [0.000] [0.000] [0.000] [0.000] [0.000] tertiary 1.016 - 1.016 1.015 1.016 1.016 1.016 [0.000] - [0.000] [0.000] [0.000] [0.000] [0.000] medium_sk - 0.272 - - - - - - [0.000] - - - - - high_sk - 0.816 - - - - - - [0.000] - - - - - imi*educ1 -0.069 - -0.0004 -0.071 -0.087 -0.059 -0.068 [0.000] - [0.993] [0.000] [0.000] [0.000] [0.000] imi*educ2 -0.133 - -0.093 -0.167 -0.142 -0.143 -0.147 [0.000] - [0.025] [0.000] [0.000] [0.000] [0.000] imi*educ3 -0.226 - -0.081 -0.285 -0.227 -0.267 -0.259 [0.000] - [0.048] [0.000] [0.000] [0.000] [0.000] imi*educ4 -0.332 - -0.102 -0.467 -0.343 -0.445 -0.382 [0.000] - [0.014] [0.000] [0.000] [0.000] [0.000] imi*tertiary -0.365 - -0.112 -0.767 -0.360 -0.596 -0.489 [0.000] - [0.007] [0.000] [0.000] [0.000] [0.000] imi*medium_sk - -0.150 - - - - - - [0.000] - - - - - imi*high_sk - -0.219 - - - - - - [0.000] - - - - - contract -0.094 -0.102 -0.094 -0.094 -0.094 -0.094 -0.094 [0.000] [0.000] [0.000] [0.000] [0.000] [0.000] [0.000] imi*contract 0.065 0.071 0.039 0.098 0.066 0.057 0.071 [0.000] [0.000] [0.000] [0.000] [0.000] [0.000] [0.000] other controls -Yes- -Yes- -Yes- -Yes- -Yes- -Yes- -Yes-
imi∗other controls -Yes- -Yes- -Yes- -Yes- -Yes- -Yes- -Yes- No. of observations 30,953,800 30,953,800 29,847,681 30,097,955 29,986,162 29,779,324 30,056,244
R2 0.4683 0.4490 0.4707 0.4700 0.4710 0.4713 0.4703
Table 1: Pooled OLS regression estimates for 2002-2017, dependent variable: log of real monthly wage - breakdown by skill level and nationality groups
15
a permanent contract and in 2002, both without any work experience. But since it was chosen an individual with 12 years of schooling instead of the reference group “illiterate or Early Childhood Education” to compute the simulated wage profiles, the wage difference will actually amount to -16.4 log points (16.8-33.2). This supports the idea of imperfect transferability of human capital skills, in this case, of formal education studied by Friedberg (2000) and Chiswick and Miller (2009), meaning that the wages of immigrants with more formal education are relatively more penalised upon arrival in the Portuguese labour market.
To actually analyse the wage assimilation between immigrants and natives over time, one needs to examine first the two coefficients that represent the linear returns to experience shown in the first column of Table 1 (other control variables that are constant for each worker only affect the wage gap upon arrival). The first coefficient to take into account is 𝛽1, that
representing the difference between the returns to domestic and foreign experience of immigrant workers, equals 2.2 log points, meaning that additional years of work experience in the Portuguese labour market have a greater impact in immigrants’ wages than additional years of experience in their home country. The other coefficient to take into account is 𝛾2, that capturing the difference between the returns of one year of work experience of an immigrant in his country of origin and one year of experience of a native worker in Portugal, equals -2 log points, meaning that returns to pre-immigration experience of immigrants are smaller than the returns to domestic experience of natives. Ultimately, considering only these linear returns to experience, the wage assimilation rate for immigrants is given by the sum of 𝛽1 and 𝛾2, which
according to block A in Table 2, is positive and significant, equalling 0.23 log points18. This
result infers that one year of work experience in the Portuguese labour market is better rewarded for immigrants than for comparable natives, but the extra gain is small. To contextualise at this point, in a case where large wage gaps upon arrival are verified, immigrant workers would be
16
unlikely to reach parity with the wages of comparable natives during their stay in Portugal. However, remember that this analysis of assimilation ignores the quadratic terms on years since migration and potential experience, which if taken into account, would difficult the direct interpretation of the coefficients analysed.
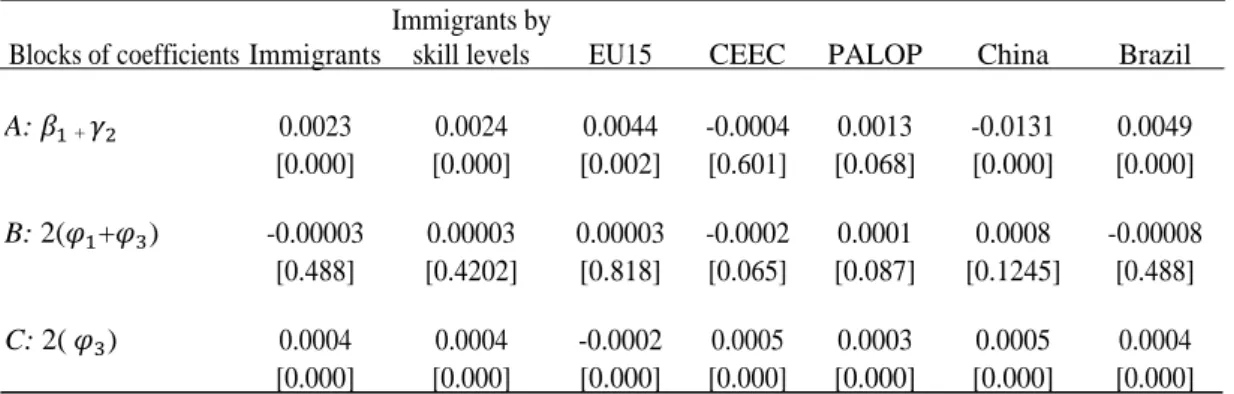
Table 2: Coefficients for assessing the evolution of the immigrant-native wage differences over time (wage assimilation rate), log points
Blocks of coefficients Immigrants
Immigrants by
skill levels EU15 CEEC PALOP China Brazil
A: 𝛽1 + 𝛾2 0.0023 0.0024 0.0044 -0.0004 0.0013 -0.0131 0.0049 [0.000] [0.000] [0.002] [0.601] [0.068] [0.000] [0.000] B: 2(𝜑1+𝜑3) -0.00003 0.00003 0.00003 -0.0002 0.0001 0.0008 -0.00008 [0.488] [0.4202] [0.818] [0.065] [0.087] [0.1245] [0.488] C: 2( 𝜑3) 0.0004 0.0004 -0.0002 0.0005 0.0003 0.0005 0.0004 [0.000] [0.000] [0.000] [0.000] [0.000] [0.000] [0.000]
Note: p-values in brackets and implicit standard errors are worker-cluster robust. The coefficients presented in this table are defined by equation 3. Block A accounts for the linear impact of an additional year of domestic experience; block B represents the quadratic effect of that additional year; and block C measures the interaction between returns to domestic and foreign experience of immigrants.
Furthermore, ceteris paribus, one additional year of experience in the Portuguese labour market (𝛽2) increases the average real monthly wage of native workers by 2.8 log points, but one additional year of foreign experience (the linear marginal return to foreign work experience) increases the real monthly wage of immigrants by only 0.8 log points (𝛽2− 𝛾2 = 2.8-2.0). This result means that pre-immigration work experience of immigrants is less valued than domestic experience of natives. Thus, it supports the theory of the limitation of international transferability of foreign experience to the destination country, where greater pre-immigration labour market experience is associated with poorer job matches when immigrants arrive in the destination country, implying that they may find that the human capital brought with them is not relevant to their adopted labour market (Chiswick and Miller, 2009). However, this penalty will be progressively smaller as total work experience increases (2𝜑3 = 0.04 log points and statistically significant – block C in Table 2).
17
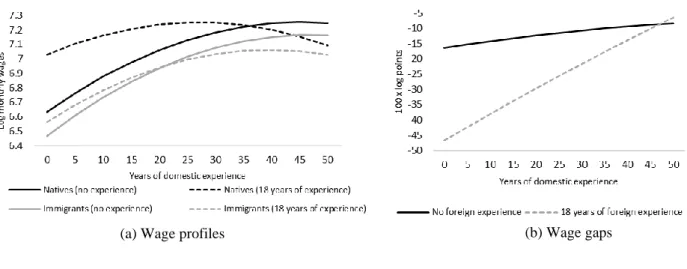
From the simulated wage profiles, Figure 1 (a) shows that with 18 years of previous work experience, the initial average wage of a native is 39.6 log points higher than the initial average wage of a native with no experience. After around 35 years, there will be no significant wage differential between the two types of natives. For the immigrant’s case, this difference is equal to 9.4 log points. One can interpret this outcome to be a good example of the limitation of international transferability of foreign experience to the destination country, since having more previous work experience before arrival seems to be not so relevant for the immigrants compared to natives. But after around 20 years in the Portuguese labour market, there will be no significant wage differential between these two average immigrants.
Going into more detail, looking at Figure 1 (b), immigrants with no previous work experience upon arrival in the Portuguese labour market will earn 16.4 log points less than an analogous native. After 50 years since arrival, the wage gap still exists, although immigrants then earning just 8.3 log points less than a comparable native. For the situation where workers have 18 years of previous work experience, the wage gap upon arrival is -46.6 log points, and after 50 years since arrival to the Portuguese labour market the wage gap falls to -6.5 log points. Hence, there is not a complete wage convergence between immigrants and natives, not even after 50 years in the labour market. The remaining gap is therefore still negative for both cases, but less negative for the case with a starting point of 18 years of previous work experience. One possible explanation for this result is in line with the immigrant human-capital investment model of Duleep and Regets (1999), stating that more experienced immigrant workers whose skills are not easily transferable upon arrival, will be better equipped to acquire country-specific human capital and have more incentives to make such investments in the first years in the destination country.
18
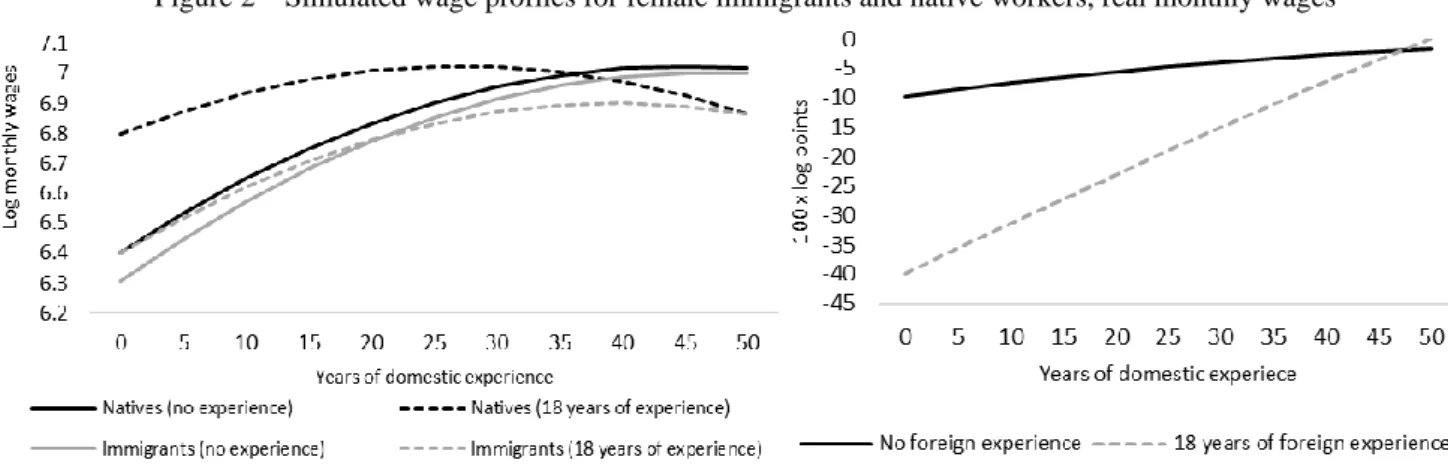
Now, if male (the reference group of the variable 𝑔𝑒𝑛𝑑𝑒𝑟𝑖) is changed to female, but keeping the remaining control variables constant over time, the wages at the starting point for females, either natives or immigrants, are always lower than wages of comparable males, for both cases of 0 and 18 years of previous work experience (first column of Table 1 shows that the coefficient of the variable 𝑔𝑒𝑛𝑑𝑒𝑟𝑖 is negative). But in terms of wage convergence, the
wage gaps between female immigrants and female natives, for both cases of 0 and 18 years of previous work experience, are smaller than the correspondent gapsfor males (first column of Table 1 provides evidence that the wage penalty associated with being a female worker is smaller in the case of immigrants since the coefficient of the variable 𝑖𝑚𝑖𝑖*𝑔𝑒𝑛𝑑𝑒𝑟𝑖>0). From Figure 2 (b), the wage gap upon arrival for females with 0 previous work experience is -9.7 log points and -39.9 log points for females with 18 years of previous work experience. One can check again the theory of limitation of international transferability of foreign experience to the destination country, which causes a stronger wage penalty for those with more foreign experience. After around 50 years in the Portuguese market, the wage gap between females with 0 years of previous work experience is still -1.6 log points, while female immigrants with 18 years of previous foreign experience are able to catch up in wages with female natives with 18 years of previous domestic experience. This result is again in line with the immigrant human-capital investment model mentioned above.
Figure 1 – Simulated wage profiles for male immigrants and native workers, real monthly wages
19
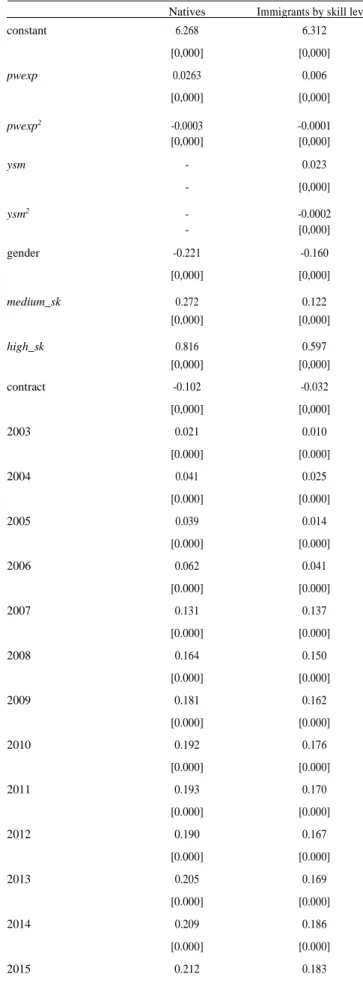
Next follows the analysis keeping the previous worker’s characteristics of equation 2 but considering the three dummies representing workers’ skilled level: low skilled, medium skilled and high skilled workers, being “low skilled” the reference group (see the second column of Table 1 for the regression estimates).
For the case where workers have 0 previous work experience (see Figure 3 (a)), the wage gap is positive upon arrival for the low skilled workers (2.9 log points) and even increases over time. For the medium skilled workers, the wage gap upon arrival is negative (-12.1 log points) but after around 40 years in the Portuguese labour market, the medium skilled immigrants are able to reach wage parity with comparable medium skilled natives. Finally, for the high skilled workers, the wage gap upon arrival is negative (-18.9 log points), the most negative out of the three scenarios, and even after 50 years in the Portuguese labour market, there is still no full convergence.These results corroborate the idea of imperfect transferability of formal education mentioned above, since the wages of immigrants with more formal education are relatively more penalised upon arrival in the Portuguese labour market.
For the remaining case where workers have 18 previous work experience (see Figure 3 (b)), for the low skilled workers, the wage gap is negative upon arrival (-26.6 log points) but those immigrant workers are able to catch up with their correspondent natives after around 26 years in Portugal. For the medium skilled workers, the wage gap upon arrival is also negative
Figure 2 – Simulated wage profiles for female immigrants and native workers, real monthly wages
20
(-41.6 log points) but after around 40 years in the Portuguese labour market, the medium skilled immigrants are able to catch up with the correspondent medium skilled natives. Lastly, for the high skilled workers, the wage gap upon arrival is negative (-48.5 log points), again the most negative out of the three scenarios, and wage convergence is verified only after around 45 years in Portugal, with these results being explained by the idea of imperfect transferability of formal education as in the previous case.
Comparing both cases of pre-immigration experience, the results are in line with the idea of limitation of transferability of immigrants’ foreign experience to the destination country, since one verifies that with 18 years of previous work experience, the wage gaps upon arrival for all scenarios of skill levels are negatively higher. However, the immigrant human-capital investment model helps to explain the results after 50 years, since wage parity is reached for all scenarios in Figure 3 (b), but not for all scenarios in Figure 3 (a).
5.2. Simulated wage profiles by immigrants’ nationality groups
In this subsection, it will be evaluated the wage assimilation between a reference immigrant and comparable native worker over 50 years in the Portuguese labour market,
Figure 3 – Wage difference between immigrants and natives by skill level, 100 x log points
(a) Wage gaps with no foreign experience
(b) Wage gaps with 18 years of foreign experience
21
varying the immigrant’s country of origin to assess their heterogeneity in terms of returns to work experience.
Beginning with EU15 immigrants, there is a higher positive linear impact of pre-immigration work experience on the relative wages of immigrants for each level of years since migration (2.8 – 0.3) comparing to the average immigrant (2.8 – 2). Furthermore, block A in Table 2 is positive (0.44 log points), statistically significant and higher than the one for the average immigrant, meaning that the linear returns to domestic experience of EU15 immigrants are higher than for similar native workers, entailing a positive wage gap upon arrival. For those workers with 18 years of previous work experience, the positive wage gap upon arrival continues over time, being less accentuated comparing to workers who didn’t brought any foreign work experience, reflecting the decreasing returns to high levels of foreign experience (negative and significant coefficient of block C). As mentioned above more than once, it resembles the theory of the limitation of international transferability of foreign experience to the destination country. As can be seen in Figure 4 (b), after 50 years in Portugal, the relative wage advantage even increases for both cases. Overall, compared to the average immigrant, the ones coming from the EU15 seem to have better endowments and earn better returns.
The Brazilian immigrant’s wage profile seems to be the closest in terms of shape to the one of the average immigrants. Block A gives a positive (0.5 log points) and significant first-order impact for an additional year of domestic experience. Since block B is negative but non-significant, one cannot say the wage gap of Brazilian immigrants will decrease over years of domestic experience. But since block C is positive and significant, as immigrants acquire more and more domestic experience, that return will be higher for workers with more foreign experience. This evidence is shown in Figure 4 (f), where those who had 18 years of previous work experience, see their wages converging to those of comparable natives after around 50 years in Portugal, resonating with the immigrant human-capital investment model.
22
Analysing next the case for the PALOP immigrants (see Figure 4 (d)), it looks similar to the Brazilian case, except the sign of block B, which changes the shape of the wage profile’s curves. Block A gives a positive (0.13 log points) and significant first-order impact for an additional year of domestic experience. Since block B is positive and significant, the negative wage gap upon arrival will be mitigated with time spent in Portugal19. And since block C is
positive and also significant, as immigrants acquire more and more domestic experience, both immigrants with 0 and 18 years of previous work experience see their wage converging to those of comparable natives after around 50 years in the Portuguese labour market.
Connecting both the results from the Brazilian and PALOP immigrants, it seems that speaking the language of the destination country (Portuguese in this case) might play a role on immigrant wage assimilation, as many studies reached this conclusion (see Chiswick and Miller, 2002). Indeed, for these two immigrant groups, wage parity was verified (in ¾ of the scenarios tested), even if only after 50 years in the destination country. Excluding the case of EU15 immigrants, wage parity was never verified for the remaining two nationality groups, as it will be seen next.
Finally, for the case of CEEC and Chinese immigrant groups, their wage adjustment profiles are similar, except for the sign of block B, which changes the shape of the wage profile’s curves, with neither of them reaching wage parity. For workers with no previous foreign experience the negative wage gap is even divergent over the years. For the case of CEEC immigrants, block A gives a negative (-0.04 log points) but non-significant first-order impact for an additional year of domestic experience. But with a negative block B, significant at 10% confidence level only, the negative wage differences upon arrival increase with domestic experience, which is stronger for immigrants without pre-immigration experience. Figure 4 (c) shows that, for those workers with 0 previous foreign experience, the negative wage gap continues to increase. For those with
23
18 years of previous work experience, the extremely negative wage gap upon arrival continues negative, even though a little less as more domestic experience is acquired. For the Chinese case, block A gives the highest penalty in the linear returns to domestic experience (-1.3 log points). Block B is positive and non-significant (contrary to CEEC case). But since block C is positive and significant, as immigrants acquire more and more domestic experience, the negative wage gap increases only for immigrants without pre-immigration experience. Figure 4 (e) displays for those workers with 0 previous foreign experience, that the wage gap disadvantage continues to increase. For those with 18 years of previous work experience, the extremely negative wage penalty upon arrival continues negative, having partially converged a little as more domestic experience was acquired. For both CEEC and China immigrants, these results can be explained by the immigrant human-capital investment model and by what seems to be a case of worse endowments and lower returns, with Chinese immigrants having it worse.
Figure 4 – Wage difference between immigrants and natives by region of origin, 100 x log points 2
(a) Total (b) EU15 (c) CEEC
24
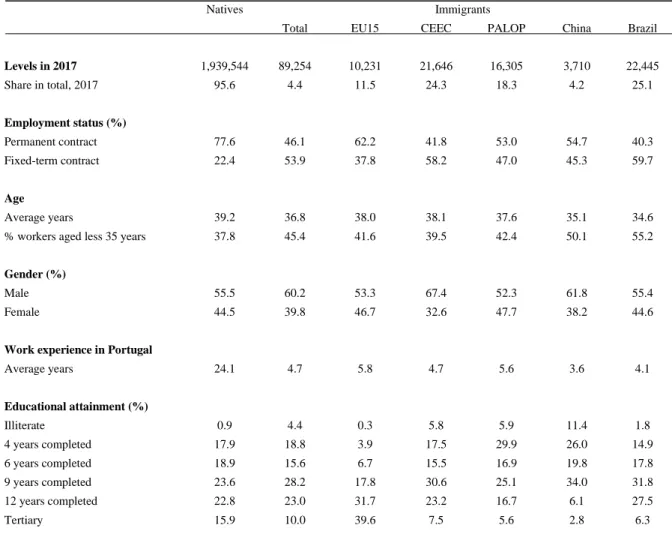
Additionally, it could be interesting to recur to Table 4 in Appendix C and analyse some of the characteristics of each immigrant group present in the Portuguese labour market and try to see how the differences in the characteristics between each immigrant group can support the findings above. As an example, for the Chinese immigrants, the services sector (especially the subsectors of wholesale and retail trade, and hotels and restaurants) represents around 97% of their jobs. Being these considered low-skill sectors, immigrants can expect not to progress that easily in terms of wages over time if continuing working in such sectors.
6. CONCLUSION
Various contributions to the economics literature showed that immigrants earn less than natives upon arrival, but with their wages growing with years spent in the destination countries. For example, Anderson and Huang (2019) state that, with time spent in the destination country, the wages of first-generation immigrants in high-income countries are close to native wages after 20−30 years, but some immigrant groups never achieve full wage convergence.
Using a longitudinal dataset matching workers and firms based in Portugal, this work project analyses the wage assimilation between immigrant and native workers in the Portuguese labour market for the years 2002-2017, recurring to simulated wage profiles over 50 years.
Overall, there is a negative wage gap upon arrival in the Portuguese labour market for a reference male worker with 12 years of education. The relative negative wage gap upon arrival is more intense if the average worker has 18 years of foreign experience, since foreign work experience was found to be reward less than domestic experience. It was also found that the more education an immigrant has relative to a comparable native, the lower the returns, being more penalised at entry in Portugal. After 50 years in the Portuguese labour market, a time span that can be considered a limit spent in the workforce, there is not a complete wage convergence between the average immigrants and comparable natives. Notwithstanding, the remaining gap
25
is less negative for the case with a starting point of 18 years of previous work experience, possibly explained by the immigrant human-capital investment model.
If one considers the reference worker to be female instead of male, the wages upon arrival are always lower for female natives and immigrants compared to the respective males. In terms of wage convergence, for both scenarios of 0 and 18 years of previous work experience, the relative wage gap are smaller than the correspondent gaps of males. For 18 years of previous work experience, females are able to reach parity after 50 years in the Portuguese labour market.
When splitting immigrants by skill levels, the results obtained for the various scenarios tested depend on the mix of effects from the levels of immigrants’ pre-immigration experience and their education level upon arrival.
For the analysis by main nationality groups, significant differences were found. The wage of workers from EU15 is higher than the wage of the average native due to positive wage gap assimilation, never fading and even increasing after 50 years in Portugal. For Brazilian immigrants, the relative wage gap upon arrival is negative but those who had 18 years of previous work experience, see their wages converging to those of comparable natives after around 50 years in Portugal, in line with the immigrant human-capital investment model. For the PALOP case, both immigrants with 0 and 18 years of previous work experience see their wage converging to those of comparable natives after around 50 years in Portugal. Speaking therefore portuguese, the language of the destination country, seems to play a role on immigrant wage assimilation. Lastly, the wage adjustment profiles of CEEC and China are similar in the sense that neither of them reaches wage parity, and for workers with no previous foreign experience, the negative wage gap continues to increase20.
20 Being this work project an attempt to update some of the analysis by Cabral and Duarte (2013), when comparing some of the results, keep in mind that this work project has differences regarding the analysis’ assumptions. But in general terms, the main theories are verified and for the average immigrant, wage parity is never reached in the Portuguese labour market too. The biggest differences are in terms of the shapes and rates of the wage gap profiles (seen in the figures displayed in section 5), given that the parameter estimates were obtained with more recent data from the QP dataset, therefore covering a higher time span, important for the accuracy of this type of studies.
26
From this work project, one can conclude that the outcomes on wage assimilation obtained depend on 3 major theories: the immigrant human-capital investment model, the imperfect transferability of education and the experience acquired in the country of origin, which influence the sign and magnitude of the wage assimilation rates21.
The conclusions of this work project reveal the importance for immigration policy in the destination countries to start focusing in obtaining a better picture of the size, composition and duration of the current immigration flows, in order to better adapt the framework for integration in a sustainable way to the needs of the immigrant population. The results entail that, for the average immigrant and mainly for immigrants coming from CEEC and China, more programs and support policies should be made available in order to speed their wage parity in the destination country.
REFERENCES
Anderson, K. H. and Huang, Z. 2019. “Can immigrants ever earn as much as native workers?”
IZA World of Labor, 159(2).
Bah, T. L. 2018. “Occupation-Skill Mismatch and Selection of Immigrants: Evidence from the Portuguese Labor Market.” NOVAFRICA Working Paper Series, 1804.
Borjas, G. S. 1985. “Assimilation, Changes in Cohort Quality, and the Earnings of Immigrants.” Journal of Labor Economics, 3(4): 463-489.
Cabral, S. and Duarte, C. 2013. “Mind the gap! The relative wages of immigrants in the Portuguese labour market.” Banco de Portugal Working Paper, 5.
Chiswick, B. R. 1978b. “The Effect of Americanization on the Earnings of Foreign-born Men.” Journal of Political Economy, 86(5): 897–921.
21 Cabral and Duarte (2013) analysed more in depth the patterns of post-arrival wage adjustment for immigrants in the Portuguese labour market, simulating wage gap profiles with panels by education level and by nationality group, with the immigrant-native wage difference (in log points) in the y-axis, different levels of pre-immigration experience in the z-axis and varying domestic experience (years since migration) in the x-axis. It would also be relevant in future research to update this part of their study with the parameter estimates obtained in this work project.
27
Chiswick, B. R. and Miller, P. W. 2002. “Immigrant earnings: Language skills, linguistic concentrations and the business cycle.” Journal of Population Economics, 15: 31-57. Chiswick, B. R. and Miller, P. W. 2009. “The international transferability of immigrants' human capital.” Economics of Education Review, 28(2): 162-169.
Chiswick, B. R. and Miller, P. W. 2012. “Negative and positive assimilation, skill transferability, and linguistic distance.” Journal of Human Capital, 6(1): 35-55. D’Amuri, F., Ottaviano, Gianmarco I.P. and Peri, G. 2008. “The Labor Market Impact of Immigration in Western Germany in the 1990's.” NBER Working Paper, 13851.
Dell’Aringa, C., Lucifora, C. and Pagani, L. 2015. “Earnings differentials between immigrants and natives: the role of occupational attainment.” IZA Journal of Migration, 4(8).
Duleep, H., and Regets, M. 1999. " Immigrants and Human-Capital Investment." The American
Economic Review, 89(2): 186-191.
Friedberg, R. M. 2000. “You Can’t Take It With You? Immigrant Assimilation and the Portability of Human Capital.” Journal of Labor Economics, 18(2):221-251.
Izquierdo, M., Lacuesta, A. and Vegas, R. 2009. “Assimilation of Immigrants in Spain: A Longitudinal Analysis.” Banco de España Documentos de Trabajo, 0904.
Lubotsky, D. 2007. “Chutes or Ladders? A Longitudinal Analysis of Immigrant Earnings.” Journal of Political Economy, 115(5).
Lundborg, P. 2007. “Assimilation in Sweden: Wages, Employment, and Work Income.” The
Stockholm University Linnaeus Center for Integration Studies (SULCIS), Working Paper 5.
OECD. 2014. “Is migration good for the economy?” Migration Policy Debates.
Pordata: Base De Dados Portugal Contemporâneo. Lisboa: Fundação Francisco Manuel dos
Santos, n.d.
United Nations, Department of Economic and Social Affairs, Population Division. 2019. “International Migrant Stock 2019.” (United Nations database,
POP/DB/MIG/Stock/Rev.2019).
Zibrowius, M. 2012. “Convergence or divergence? Immigrant wage assimilation patterns in Germany.” SOEPpapers on Multidisciplinary Panel Data Research, 479.
28
APPENDIX
Appendix A
Appendix B:
Table 3: Description of used variables
Dependent variable Description
logWit Natural logarithm of the real monthly wage of individual i at time t.
Explanatory variables Description
imi Dummy variable for immigrant status. Equals 1 if worker is immigrant.
pwexp Age - years of education - 6.
ysm Proxy of years since migration. Only for immigrant workers (equals zero for native workers). Using QP records, it is possible to trace back each worker to its first record in the database and also to obtain the first year of admission in a firm. This proxy corresponds to the difference between the reference year t and the minimum of these two dates.
Educational attainment These variables record total years of education reported by the worker.
The variables formulated are based on the International Standard Classification of Education of 2011 (ISCED).
educ0 ISCED 0: Illiterate or Early childhood education (no formal education)
educ1 ISCED 1: Primary education (up to 4 years of schooling completed).
educ2
ISCED 1: Second stage of basic education (up to 6 years of schooling completed).
educ3 ISCED 2: Lower secondary education (up to 9 years of schooling completed).
educ4 ISCED 3: Upper secondary education (up to 12 years of schooling completed).
tertiary ISCED 4/5/6/7/8: Post-secondary non-tertiary and tertiary education.
Source: INE | SEF/MAI, PORDATA
Figure 5 - Foreign population with legal resident status in Portugal: total and by certain nationalities 1960-1980
29
Appendix C: Descriptive statistics
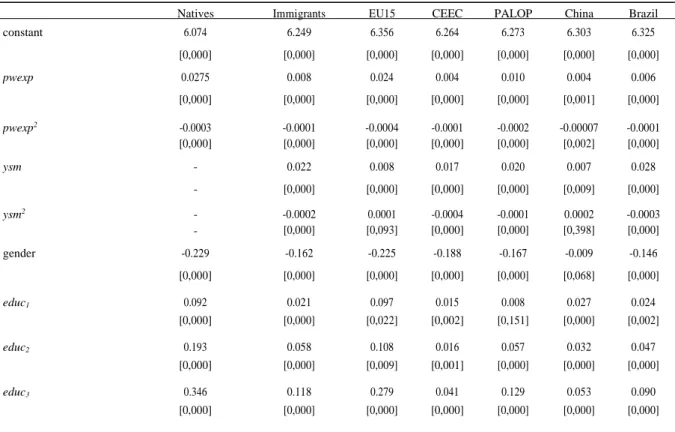
Table 4: Main characteristics of native and immigrant full-time workers in Portugal, average 2002-2017
Natives Immigrants
Total EU15 CEEC PALOP China Brazil
Levels in 2017 1,939,544 89,254 10,231 21,646 16,305 3,710 22,445 Share in total, 2017 95.6 4.4 11.5 24.3 18.3 4.2 25.1 Employment status (%) Permanent contract 77.6 46.1 62.2 41.8 53.0 54.7 40.3 Fixed-term contract 22.4 53.9 37.8 58.2 47.0 45.3 59.7 Age Average years 39.2 36.8 38.0 38.1 37.6 35.1 34.6 % workers aged less 35 years 37.8 45.4 41.6 39.5 42.4 50.1 55.2
Gender (%)
Male 55.5 60.2 53.3 67.4 52.3 61.8 55.4 Female 44.5 39.8 46.7 32.6 47.7 38.2 44.6
Work experience in Portugal
Average years 24.1 4.7 5.8 4.7 5.6 3.6 4.1 Educational attainment (%) Illiterate 0.9 4.4 0.3 5.8 5.9 11.4 1.8 4 years completed 17.9 18.8 3.9 17.5 29.9 26.0 14.9 6 years completed 18.9 15.6 6.7 15.5 16.9 19.8 17.8 9 years completed 23.6 28.2 17.8 30.6 25.1 34.0 31.8 12 years completed 22.8 23.0 31.7 23.2 16.7 6.1 27.5 Tertiary 15.9 10.0 39.6 7.5 5.6 2.8 6.3 Variables included in Xi
gender Dummy variable for gender. Equals 1 if worker is female.
contract Dummy variable for distinguishing permanent from fixed-term contracts.
Equals 1 in case of fixed-term contracts.
activ_sector Dummy variables for the different industries: agriculture, mining and quarrying,
manufacturing, electricity, water treatments, construction, wholesale and retail trade, hotels and restaurants, communication, transportation, financial services, real state, business services, administrative services, public administration, education, health, culture, other services and international services.
The reference group being manufacturing industry.
nut2 Dummy variables for the different geographical locations according to NUTII: Norte, Algarve, Centro, Lisboa, Alentejo, Açores e Madeira. The reference group being Lisboa.
Year-specific effects
year Year-specific fixed effects. The reference year being 2002.
30
Main sectors of activity (%)
Manufacturing industry 24.6 13.0 16.4 19.6 8.0 0.5 9.8 Construction 5.9 9.5 3.3 12.3 12.4 0.2 8.6 Services, of which: 40.1 51.4 39.9 45.4 51.2 96.6 56.4 Wholesale and retail trade 17.6 18.1 11.7 17.9 18.3 54.3 16.7 Transport and storage 10.1 7.5 7.5 9.6 5.2 5.7 7.8 Hotels and restaurants 6.7 21.2 13.3 14.5 21.1 36.0 27.8 Business services 5.7 4.6 7.4 3.4 6.6 0.6 4.1 Other sectors 29.4 26.1 40.4 22.7 28.4 2.7 25.2
Average real monthly wage (Euros) 1,057.3 868.7 1,521.5 808.9 794.8 584.4 804.0
Wage gap to natives (Euros) -188.6 464.2 -248.4 -262.5 -472.9 -253.3 Source: Quadros de Pessoal.
Notes: The shares of main immigrant groups are computed as a percentage of total immigrants. EU15 includes the initial 15 Member-States of European Union except Portugal. CEEC (Central and Eastern European countries) includes the countries Slovakia, Poland, Czech Republic, Hungary, Estonia, Slovenia, Latvia, Lithuania, Romania, Russian Federation, Moldova, Ukraine and Serbia. PALOP (Países Africanos de Língua Oficial Portuguesa) refers to the former Portuguese colonies in Africa (Angola, Cape Verde, Guinea Bissau, Mozambique, and São Tomé and Príncipe). Illiterate refers to no formal education or Early childhood education, 4 years completed (primary education) and 6 years completed (second stage of basic education), 9 years completed (lower secondary education), 12 years completed (upper-secondary education) and tertiary refers to post-secondary non-tertiary and tertiary education.
Appendix D:
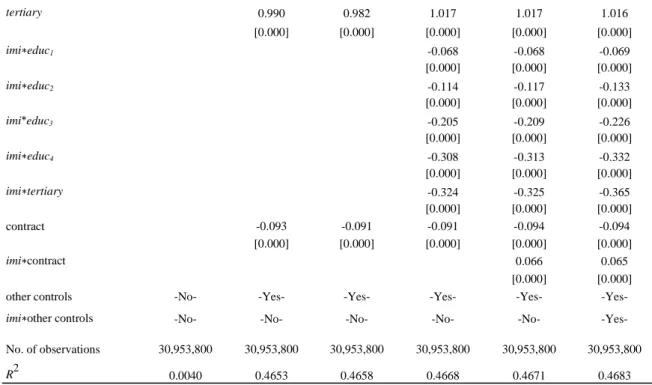
Table 5: Pooled OLS regression estimates by set of variables, 2002-2017, dependent variable: log of real monthly wage (1) (2) (3) (4) (5) (6) imi -0.174 -0.126 0.003 0.345 0.261 0.168 [0.000] [0.000] [0.000] [0.000] [0.000] [0.000] pwexp 0.027 0.028 0.028 0.028 0.028 [0.000] [0.000] [0.000] [0.000] [0.000] pwexp2 -0.0003 -0.0003 -0.0003 -0.0003 -0.0003 [0.000] [0.000] [0.000] [0.000] [0.000] imi∗pwexp -0.013 -0.020 -0.019 -0.020 [0.000] [0.000] [0.000] [0.000] imi∗pwexp2 0.0001 0.0002 0.0002 0.0002 [0.000] [0.000] [0.000] [0.000] ysm 0.0043 0.012 0.019 0.022 0.022 [0.000] [0.000] [0.000] [0.000] [0.000] ysm2 0.0001 0.00002 -0.0001 -0.0002 -0.0002 [0.000] [0.357] [0.000] [0.000] [0.000] gender -0.226 -0.226 -0.227 -0.229 -0.229 [0.000] [0.000] [0.000] [0.000] [0.000] imi∗gender 0.081 0.067 [0.000] [0.000] educ1 0.079 0.071 0.092 0.092 0.092 [0.000] [0.000] [0.000] [0.000] [0.000] educ2 0.176 0.167 0.193 0.193 0.193 [0.000] [0.000] [0.000] [0.000] [0.000] educ3 0.326 0.317 0.347 0.347 0.346 [0.000] [0.000] [0.000] [0.000] [0.000] educ4 0.533 0.524 0.559 0.559 0.558 [0.000] [0.000] [0.000] [0.000] [0.000] Table 4: (continuation)
31 tertiary 0.990 0.982 1.017 1.017 1.016 [0.000] [0.000] [0.000] [0.000] [0.000] imi∗educ1 -0.068 -0.068 -0.069 [0.000] [0.000] [0.000] imi∗educ2 -0.114 -0.117 -0.133 [0.000] [0.000] [0.000] imi*educ3 -0.205 -0.209 -0.226 [0.000] [0.000] [0.000] imi∗educ4 -0.308 -0.313 -0.332 [0.000] [0.000] [0.000] imi∗tertiary -0.324 -0.325 -0.365 [0.000] [0.000] [0.000] contract -0.093 -0.091 -0.091 -0.094 -0.094 [0.000] [0.000] [0.000] [0.000] [0.000] imi∗contract 0.066 0.065 [0.000] [0.000] other controls -No- -Yes- -Yes- -Yes- -Yes- -Yes-
imi∗other controls -No- -No- -No- -No- -No- -Yes- No. of observations 30,953,800 30,953,800 30,953,800 30,953,800 30,953,800 30,953,800
R2 0.0040 0.4653 0.4658 0.4668 0.4671 0.4683 Note: p-values in brackets and implicit standard errors are worker-cluster robust. See the main text and Table 3 in Appendix Bfor a full description of all variables included.
Appendix E
Table 6: Definition of skill dummy variables
Appendix F: Full derivation from equation 2 into equation 3 in the main text
Parting from equation 2, immigrants’ wage assimilation can be estimated by rewriting it, isolating the wage difference between the wages of immigrants and natives in the left-hand side of the equation: 𝑙𝑜𝑔𝑊𝑖𝑡𝐼 − 𝑙𝑜𝑔𝑊𝑖𝑡𝑁 = 𝛽0𝑖𝑚𝑖𝑖+ 𝛽1𝑦𝑠𝑚𝑖𝑡+ 𝜑1𝑦𝑠𝑚𝑖𝑡2+ 𝛾2𝑖𝑚𝑖𝑖 ∗ 𝑝𝑤𝑒𝑥𝑝𝑖𝑡+ 𝜑3𝑖𝑚𝑖𝑖 ∗ 𝑝𝑤𝑒𝑥𝑝𝑖𝑡2+ ∑ 𝛾 𝑗 𝑚 𝑗=3 𝑖𝑚𝑖𝑖∗ 𝑥𝑗+ 𝜇𝑖𝑡
Explanatory variables Description
Skill levels These variables are based on the previous educational attainment variables.
low_sk Sum of the variables educ0, educ1 and educ2.
medium_sk Sum of the variables educ3 and educ4.
high_sk Equal to the variable tertiary.
Table 5: (continuation)
![Table 5: Pooled OLS regression estimates by set of variables, 2002-2017, dependent variable: log of real monthly wage (1) (2) (3) (4) (5) (6) imi -0.174 -0.126 0.003 0.345 0.261 0.168 [0.000] [0.000] [0.000] [0.000] [0.000] [0.000] pwe](https://thumb-eu.123doks.com/thumbv2/123dok_br/15147657.1012527/31.892.123.792.130.364/table-pooled-regression-estimates-variables-dependent-variable-monthly.webp)