R E S E A R C H A R T I C L E
Open Access
Diabetes mellitus in HIV-infected patients:
fasting glucose, A1c, or oral glucose
tolerance test
– which method to choose
for the diagnosis?
Ana Rita Coelho
1*, Flávia Andreia Moreira
1, Ana Cristina Santos
2,3, André Silva-Pinto
4,5, António Sarmento
4,5,
Davide Carvalho
6and Paula Freitas
6Abstract
Background: Antiretroviral therapy dramatically reduced HIV-related morbidity and mortality, prolonging the lifespan of HIV-infected patients. Greater duration of infection and exposure to antiretroviral therapy makes these patients susceptible to traditional cardio-metabolic risk factors and pathologies. The optimal diagnostic protocol for Diabetes Mellitus in these patients is still controversial. Haemoglobin A1c (HbA1c) has been shown to underestimate glycaemia levels and the oral glucose tolerance test (OGTT) has been shown to reveal cases of glucose metabolism disturbances in patients with normal fasting glucose. Thus, this study aimed to determine the prevalence of prediabetes and diabetes in a population of HIV-infected patients undergoing combined antiretroviral therapy, using three different diagnostic methods (fasting glucose, OGTT and HbA1c), to determine the agreement between the different methods and the characteristics associated with each one.
Methods: This study analyzed 220 HIV-infected patients on antiretroviral therapy. Patient characteristics were collected using a standardized protocol. Disturbances of glucose homeostasis were defined by the ADA 2017 criteria. Patients were characterized according to the presence or absence of clinical lipodystrophy, and distributed into four different categories, according to the presence, or absence of either clinical lipoatrophy, or abdominal prominence. Insulin resistance was assessed by HOMA-IR and QUICKI indexes. Agreement between the diagnostic methods was assessed by Cohen’s kappa coefficient.
Results: There were no patients diagnosed with diabetes with HbA1c. 5.9% prevalence was obtained when OGTT was used, and 3.2% prevalence when fasting glucose was used. Prediabetes had a prevalence of 14.1% when using HbA1c, 24.1% when using OGTT, and 20% when using fasting glucose. In all three methods, glucose homeostasis disturbances were associated with older age and higher resistance to insulin. Regarding other characteristics, associations varied between the three methods. The agreement between them was fair, or slight.
Conclusions: We observed that HbA1c was the method that diagnosed the least amount of cases and that OGTT was the one that diagnosed the most cases. Accordingly, our results indicate that HbA1c underestimated glycaemia levels in this population and that the use of OGTT might allow an earlier diagnosis of glucose homeostasis disturbances, potentially making it possible to avoid severe complications of DM.
Keywords: HIV infection, Diabetes mellitus diagnosis, Fasting glucose, Oral glucose tolerance test, HbA1c
* Correspondence:mimed11090@med.up.pt
1Medical Student. Faculty of Medicine, University of Porto. Alameda Prof. Hernâni Monteiro, 4200-319 Porto, Portugal
Full list of author information is available at the end of the article
© The Author(s). 2018 Open Access This article is distributed under the terms of the Creative Commons Attribution 4.0 International License (http://creativecommons.org/licenses/by/4.0/), which permits unrestricted use, distribution, and reproduction in any medium, provided you give appropriate credit to the original author(s) and the source, provide a link to the Creative Commons license, and indicate if changes were made. The Creative Commons Public Domain Dedication waiver (http://creativecommons.org/publicdomain/zero/1.0/) applies to the data made available in this article, unless otherwise stated.
Background
Antiretroviral therapy (ART) dramatically reduces
HIV-related morbidity and mortality and prolongs the lifespan of this infected population [1]. The greater sur-vival of patients living with the infection makes them more susceptible to exposure to the same traditional cardio-metabolic risk factors and pathologies as the gen-eral population. These complications are likely not only correlated with age, but also with the cumulative expos-ure to ART [1–5].
Cardio-metabolic pathology is, in fact, becoming an increasing problem associated with HIV infection under ART [2, 5,6]. In a large-scale HIV population study, De Wit et al. found that the incidence of new-onset diabetes mellitus (DM) increased with cumulative exposure to ART [5]. In fact, it has been shown that HIV populations can have up to a two-fold higher risk of DM when com-pared to the general population [4]. Besides ART, trad-itional risk factors have also been associated with the development of DM in this population, such as family history, obesity, older age, race, abdominal prominence (e.g. waist circumference) and statin use [4,7,8].
In the general population, DM has been identified as a high-risk, and very high-risk factor for the development of cardiovascular disease [9]. This was also demonstrated in the HIV population, where it was revealed that DM is a risk factor that substantially increases the chance of developing coronary heart disease, especially in cases of prolonged infection [6]. Thus, it is essential to regularly screen for this condition in this population, in order to prevent these kinds of complications.
The optimal diagnostic methodology for DM in HIV patients is still a controversial topic. The current European AIDS Clinical Society guidelines recommend the evaluation of fasting glucose as an initial assessment of glucose metabolism in patients with new HIV diag-nostic and also prior to starting ART. An oral glucose tolerance test (OGTT), or haemoglobin A1c (HbA1c) measurement is only recommended if fasting glucose levels reveal prediabetes [10].
Accordingly, this study aims to determine the preva-lence of prediabetes and DM using three differences diagnostic methods (fasting glucose, OGTT and HbA1c) in a population of HIV-infected patients under com-bined antiretroviral therapy. Additionally, it is our aim to investigate which characteristics differ in each diag-nostic method between the different groups, and what is the agreement between the different methods.
Methods
Participants
As part of a cross-sectional study, between 2005 and 2016, 220 non-institutionalized HIV-infected adults, consecutively referred from the Infectious Diseases
Department, were evaluated at the Endocrinology
Outpatient Clinic of São João Hospital. Patients were in-cluded in the study on their first visit, and only patients on combined antiretroviral therapy were included. A his-tory of previously-diagnosed DM and use of anti-diabetic therapy excluded patients from our study. The Ethics Committee for Health of Hospital São João approved this study and each patient provided written informed consent.
Clinical assessment
For each patient the following information was collected using a standardized protocol: age, known duration of HIV infection and of combined antiretroviral therapy ex-posure, current type of ART, HIV infection risk factors and characterization of the infection, smoking history (past, current, or never), history of diabetes and hyper-tension, and use of anti-diabetic, anti-hypertensive, and lipid lowering drugs. We used the Centers for Disease Control and Prevention (CDC) criteria for classifying the degree of infection [11].
Weight, height and waist circumference were mea-sured, and Body Mass Index (BMI) was also calculated. Body weight was measured using TANITA (Tanita®, model TBF 300), and scale and height was measured to the nearest centimeter in the standing position using a wall stadiometer (Holtain Limited Crymych, Dyfed®). BMI was calculated as weight divided by height squared (kg/m2). The waist circumference was measured midway between the lowest rib and iliac crest, at the end of a gentle expiration, with the patient standing upright, face directed forward and shoulders relaxed.
Clinical lipodystrophy was defined as peripheral lipoa-trophy with or without central fat accumulation assessed by both patient and practitioner [12]. Patients with at least one light, moderate, or severe subjective lipoa-trophic feature (identified by lipoatrophy-specific phys-ical examination) were asked to report whether he/she had any change in fat in their cheeks, the side of their face, legs, arms, or buttocks. Patients were classified as being without peripheral lipoatrophy when none of the previously described features were present [13]. Presence of central fat accumulation or abdominal prominence was defined by the measurement of waist circumference using the International Diabetes Federation criteria for
metabolic syndrome (waist circumference≥ 94 cm for
Europid men and≥ 80 cm for Europid women). Patients
were classified into four different categories, according to the presence or absence of either clinical lipoatrophy
or abdominal prominence: 1) no lipodystrophy –
pa-tients without lipoatrophy and without abdominal prom-inence; 2) isolated central fat accumulation – patients without lipoatrophy and with abdominal prominence; 3)
abdominal prominence; 4) mixed forms of lipodystrophy – patients with lipoatrophy and with abdominal promin-ence [13]. The clinical assessment was performed by the same practitioner (PF).
Laboratory analysis
A venous blood sample was taken after a 12-h overnight fast. The 12-h overnight fast was confirmed with the par-ticipants prior to the collection of the blood sample. If the 12-h fasting period was not observed the blood sample col-lection was rescheduled. All the samples were analyzed at the central laboratory of our hospital. The measurements of total cholesterol, low-density lipoprotein cholesterol, high-density lipoprotein cholesterol, triglycerides, plasma glucose and HbA1c serum levels were determined using commercial kits. Hepatitis C was diagnosed by serological assays that detect antibody to hepatitis C virus (anti-HCV). All patients without a previous diagnosis of diabetes were submitted to an OGTT. The OGTT was performed as described by the World Health Organization, using a glucose load containing the equivalent of 75 g anhydrous glucose dissolved in water.
The CD4 cell count was determined by flow cytometry and plasma HIV-1 RNA loads were measured by a quan-titative reverse transcriptase polymerase chain reaction (Roche Diagnostic Systems, Inc., Branchburg, NJ, USA), which has a lower limit of detection of 50 copies/mL.
Criteria for the definition of disturbances of glucose homeostasis
Disturbances of glucose homeostasis were defined by the
American Diabetes Association 2017 criteria [14].
Patients were divided into three groups: no diabetes (No DM), prediabetes and diabetes (DM). No DM was de-fined as fasting glucose <100 mg/dL, HbA1c <5.7% or 120 min plasma glucose <140 mg/dL during the OGTT. Prediabetes was defined as fasting glucose between 100 and 126 mg/dL, HbA1c between 5.7 and 6.5% or 120 min plasma glucose between 140 and 200 mg/dL during the OGTT. DM was defined as fasting glucose ≥126 mg/dL, HbA1c ≥6.5% or 120 min plasma glucose ≥200 mg/dL during the OGTT.
Measurements of insulin resistance
Insulin resistance was defined by the homeostasis model assessment of insulin resistance (HOMA), and insulin sensitivity by the quantitative insulin sensitivity check index (QUICKI). These indexes were calculated by the following formulas: HOMA-IR index = (fasting plasma insulin × fasting plasma glucose)/22.5 [15] and QUICKI = 1/[log (fasting insulin in mU/l) + log (fasting plasma
glucose in mg/dL)] [16]. Glucose was expressed in
mmol/L and insulin in μUI/mL. Insulin resistance was
defined when the value of HOMA >4 [8].
Statistical analysis
Quantitative variables were described as mean and standard deviation (SD), or median and interquartile range (IQR), and were compared using Student-t and ANOVA or Mann–Whitney and Kruskal-Wallis tests, as appropriate.
Categorical variables were described as counts and proportions, and compared using the chi-square or Fisher’s exact test. The kappa coefficient was computed to analyze statistical agreement between the three differ-ent diagnostic methods used for defining prediabetes and DM. Statistical analysis was performed using SPSS version 24.0 software (SPSS Inc., Chicago, Illinois, USA). All probabilities were two tailed, and p values of <0.05 were regarded as significant.
Results
Baseline characteristics
A total of 220 HIV-infected patients under ART were evaluated. The mean age of patients included was 45.8 ± 11.5 years, and 60.5% of them were males. All the demo-graphic and clinical characteristics accessed in this study are presented in Table 1, according to the presence or absence of clinical lipodystrophy.
Patients with clinical lipodystrophy were older [47.5 (11.29) vs 43.82 (11.49) years; P = 0.017], had longer duration of the HIV infection [9.0 (5.0) vs 6.0 (6.0) years; p = 0.001] and of ART use [8.0 (5.0) vs 5.0 (5.5) years; p < 0.001]. Regarding anthropometric measures, patients with clinical lipodystrophy had lower weight (p < 0.001), BMI ((p < 0.001), and waist circumference mean values (p < 0.001). Hypertension was more fre-quent in patients with clinical lipodystrophy [45 (39.1) vs 23 (21.9) %; p = 0.009], as were current smokers [56 (49.1) vs 36 (34.3) %; p = 0.032], and triglycerides me-dian values were significantly higher than those of pa-tients without clinical lipodystrophy [215.5 (214.5) vs
171 (154) mg/dL; p = 0.007]. With regards to
pharma-ceutical therapy, the use of statins (p = 0.005) and fibrates (p = 0.054) was more frequent in patients with clinical lipodystrophy.
No differences were found between patients with or without clinical lipodystrophy in terms of gender, CD4+ cell count, percentage of viral suppression, prevalence of co-infection with Hepatitis C, type of risk factor for the HIV transmission, CDC clinical categories, type of ART used, and lipid profile.
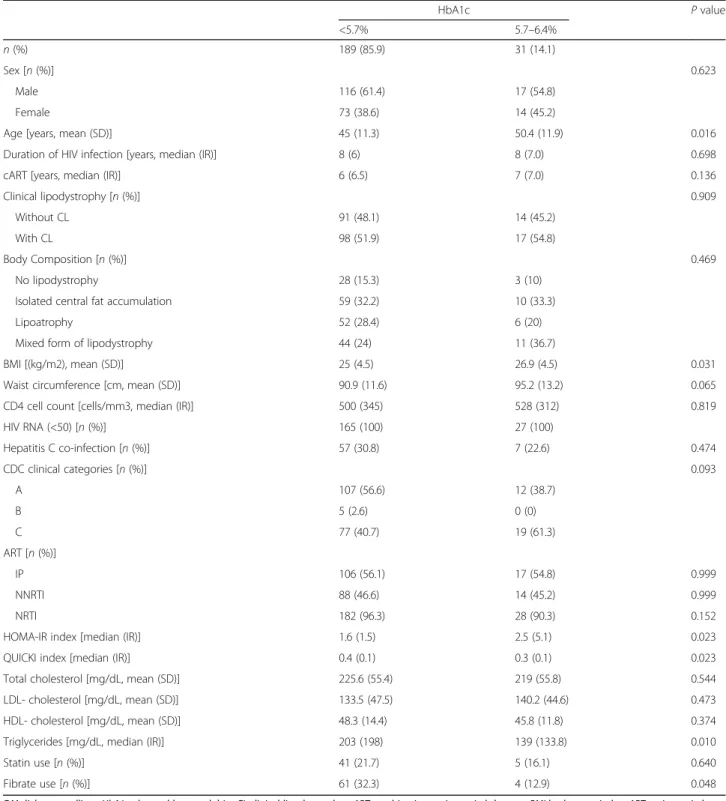
Hemoglobin A1c
No patients were diagnosed with DM using this method (HbA1c≥ 6.5%). Therefore, in Table 2, the results
re-garding two groups: no DM (HbA1c≤ 5.7%) and
In our population, 31 patients (14.1%) were diagnosed with prediabetes. These patients were older [50.35 (11.89) vs 44.99 (11.30) years; p = 0.016], and had a higher BMI
[26.90 (4.46) vs 25.01 (4.49) kg/m2; p = 0.031],
compared to the no DM patients, but had lower me-dian level of triglycerides [139 (133.8) vs 203 (198.0)
mg/dL, p = 0.010], and less frequently used fibrate
[4(12.9) vs 61 (32.3)%; p = 0.048]. The values obtained
Table 1 Sample’s baseline characteristics, according to the presence of Clinical Lipodystrophy (CL)
With CL Without CL P value
n (%) 115 (52.3) 105 (47.7)
Sex [n (%)] 0.099
Male 76 (66.1) 57 (54.3)
Female 39 (33.9) 48 (45.7)
Age [years, mean (SD)] 47.5 (11.3) 43.8 (11.5) 0.017
Duration of HIV infection [years, median (IR)] 9 (5) 6 (6) 0.001
cART [years, median (IR)] 8 (5) 5 (5.5) < 0.001
Weight [Kg, mean (SD)] 64.1 (12.8) 73.9 (12.6) < 0.001
Height [m, mean (SD)] 1.7 (0.1) 1.7 (0.1) 0.765
BMI [(kg/m2), mean (SD)] 23.6 (3.8) 27.2 (4.5) < 0.001
Waist circumference [cm, mean (SD)] 88.4 (10.8) 95.1 (12.1) < 0.001
CD4 cell count [cells/mm3, median (IR)] 554 (385) 479 (300) 0.238
HIV RNA (<50) [n (%)] 100 (100) 92 (100)
Hepatitis C co-infection [n (%)] 34 (29.8) 30 (29.4) 0.999
Hypertension [n (%)] 45 (39.1) 23 (21.9) 0.009
HIV risk factor [n (%)] 0.162
Intravenous drug user 1 (25) 3 (15.8)
Homosexual contact 0 (0) 2 (10.5) Heterosexual contact 2 (50) 14 (73.7) Others 1 (25) 0 (0) CDC clinical categories [n (%)] 0.389 A 63 (54.8) 56 (53.3) B 1 (0.9) 4 (3.8) C 51 (44.3) 45 (42.9) ART [n (%)] IP 61 (53) 62 (59) 0.447 NNRTI 55 (47.8) 47 (44.8) 0.749 NRTI 113 (98.3) 97 (92.4) 0.051 Smoking history [n (%)] 0.032 Never 38 (33.3) 53 (50.5) Current 56 (49.1) 36 (34.3) Former 20 (17.5) 16 (15.2)
Total cholesterol [mg/dL, mean (SD)] 221.9 (53.2) 227.8 (57.8) 0.433
LDL- cholesterol [mg/dL, mean (SD)] 129.4 (48.1) 140 (45.4) 0.097
HDL- cholesterol [mg/dL, mean (SD)] 46.5 (14.8) 49.5 (13.3) 0.123
Triglycerides [mg/dL, median (IR)] 215.5 (214.5) 171 (154) 0.007
Statin use [n (%)] 33 (28.7) 13 (12.4) 0.005
Fibrate use [n (%)] 41 (35.7) 24 (22.9) 0.054
CL clinical lipodystrophy, cART combination antiretroviral therapy, BMI body mass index, ART antiretroviral therapy, PI protease inhibitor, NNRTI non-nucleoside reverse transcriptase inhibitor,NRTI nucleoside reverse transcriptase inhibitor, HOMA homeostatic model assessment, QUICKI quantitative insulin sensitivity check index,SD standard deviation, IR interquartile range
for HOMA-IR were higher among patients with predia-betes, and the difference between the groups was statis-tically significant [2.51 (5.13) vs 1.62 (1.46);p = 0.023].
There were no differences between the diagnostic groups with regards to sex, duration of HIV infection or
ART use, presence or absence of clinical lipodystrophy, body composition types, waist circumference, CD4 cell count, percentage of viral suppression, prevalence of hepatitis C coinfection, CDC clinical category, type of ART used, lipid profile, and frequency of use of statins.
Table 2 Sample’s characteristics, according to the presence of no DM or prediabetes, accessed by HbA1c
HbA1c P value <5.7% 5.7–6.4% n (%) 189 (85.9) 31 (14.1) Sex [n (%)] 0.623 Male 116 (61.4) 17 (54.8) Female 73 (38.6) 14 (45.2)
Age [years, mean (SD)] 45 (11.3) 50.4 (11.9) 0.016
Duration of HIV infection [years, median (IR)] 8 (6) 8 (7.0) 0.698
cART [years, median (IR)] 6 (6.5) 7 (7.0) 0.136
Clinical lipodystrophy [n (%)] 0.909
Without CL 91 (48.1) 14 (45.2)
With CL 98 (51.9) 17 (54.8)
Body Composition [n (%)] 0.469
No lipodystrophy 28 (15.3) 3 (10)
Isolated central fat accumulation 59 (32.2) 10 (33.3)
Lipoatrophy 52 (28.4) 6 (20)
Mixed form of lipodystrophy 44 (24) 11 (36.7)
BMI [(kg/m2), mean (SD)] 25 (4.5) 26.9 (4.5) 0.031
Waist circumference [cm, mean (SD)] 90.9 (11.6) 95.2 (13.2) 0.065
CD4 cell count [cells/mm3, median (IR)] 500 (345) 528 (312) 0.819
HIV RNA (<50) [n (%)] 165 (100) 27 (100) Hepatitis C co-infection [n (%)] 57 (30.8) 7 (22.6) 0.474 CDC clinical categories [n (%)] 0.093 A 107 (56.6) 12 (38.7) B 5 (2.6) 0 (0) C 77 (40.7) 19 (61.3) ART [n (%)] IP 106 (56.1) 17 (54.8) 0.999 NNRTI 88 (46.6) 14 (45.2) 0.999 NRTI 182 (96.3) 28 (90.3) 0.152
HOMA-IR index [median (IR)] 1.6 (1.5) 2.5 (5.1) 0.023
QUICKI index [median (IR)] 0.4 (0.1) 0.3 (0.1) 0.023
Total cholesterol [mg/dL, mean (SD)] 225.6 (55.4) 219 (55.8) 0.544
LDL- cholesterol [mg/dL, mean (SD)] 133.5 (47.5) 140.2 (44.6) 0.473
HDL- cholesterol [mg/dL, mean (SD)] 48.3 (14.4) 45.8 (11.8) 0.374
Triglycerides [mg/dL, median (IR)] 203 (198) 139 (133.8) 0.010
Statin use [n (%)] 41 (21.7) 5 (16.1) 0.640
Fibrate use [n (%)] 61 (32.3) 4 (12.9) 0.048
DM diabetes mellitus, HbA1c glycated haemoglobin, CL clinical lipodystrophy, cART combination antiretroviral therapy, BMI body mass index, ART antiretroviral therapy,PI protease inhibitor, NNRTI non-nucleoside reverse transcriptase inhibitor, NRTI nucleoside reverse transcriptase inhibitor, HOMA homeostatic model assessment index,QUICKI quantitative insulin sensitivity check index, SD standard deviation, IR interquartile range
Oral glucose tolerance test
With regards to OGTT, 53 patients (24.1%) were diagnosed with prediabetes (140 mg/dL < glucose at 120 min < 200 mg/dL), and 13 patients (5.9%) with DM (glucose at 120 min≥ 200 mg/dL). In Table3, the results regarding the three categories of glucose homeostasis are presented.
Patients diagnosed with DM were older than those with prediabetes, and these, in turn, were older than those without DM [55.00 (13.55) vs 50.36 (12.13) vs 43.38 (10.24) years; p < 0.001]. A progressive stage of glucose metabolism disorder appears related to the use of protease inhibitors [76.9% vs 67.9% vs 50%;p = 0.023],
and the opposite is observed with the use of
non-nucleoside reverse transcriptase inhibitors [23.1% vs 32.1% vs 53.2%;p = 0.005).
The HOMA-IR index was highest among the predia-betes group, and lowest among the no DM group [2.37 (2.49) vs 1.94(3.17) vs 1.41 (1.54);p < 0.001].
There were no differences between the diagnostic groups regarding sex, duration of HIV infection or ART use, presence or absence of clinical lipodystrophy, body composition types, BMI, waist circumference, CD4 cell count, percentage of viral suppression, prevalence of hepatitis C coinfection, CDC clinical category, lipid pro-file, and frequency of use of statins or fibrates.
Fasting glucose
Forty four patients (20%) were diagnosed with prediabe-tes (100 mg/dL < fasting glucose< 126 mg/dL), and seven patients (3.2%) were diagnosed with DM (fasting glu-cose≥126 mg/dL). In Table4, we present our results re-garding the three categories of glucose homeostasis.
We observed that there was a significant difference re-garding sex between the diagnostic groups, as all the pa-tients diagnosed with DM were men. In the prediabetes group, 47.7% of the patients were woman. The differ-ences in age were also statistically significant, with the oldest patients being in the prediabetes group, and the youngest patients being in the no DM group [no DM 43.00 (15) vs prediabetes 51.50 (15) vs DM 45.00 (14) years; p = 0.027]. Regarding the different categories of body composition, we observe that patients without DM diagnosis had the highest proportions of patients in the categories“No lipodystrophy” (15.8%) and “Lipoatrophy” (31.5%), the prediabetes group had the highest percent-age of patients in the“Isolated central fat accumulation” (53.7%) category, and the DM group had the highest
percentage of patients in the category “Mixed form of
lipodystrophy” (71.4%). Waist circumference was signifi-cantly lower in the no DM group [noDM 88.0 (16.5) vs prediabetes 95.0 (13.5) vs DM 95.0 (15.0); p = 0.005].
Patients with hepatitis C coinfection were more
frequently classified as no DM group (33.5%), and less
frequently in the prediabetes group (14.3%). The HOMA-IR index was highest among the DM group and lowest among the no DM group [no DM 1.45 (1.31) vs prediabetes 3.18 (2.57) vs DM 9.27 (6.79);p < 0.001].
There were no differences between the diagnostic groups regarding duration of HIV infection or ART use, presence or absence of clinical lipodystrophy, BMI, CD4 cell count, percentage of viral suppression, CDC clinical category, type of ART used, lipid profile, and frequency of use of statins or fibrates.
Agreement analyses
Kappa coefficients were computed to estimate the agreement between the three diagnostic definitions.
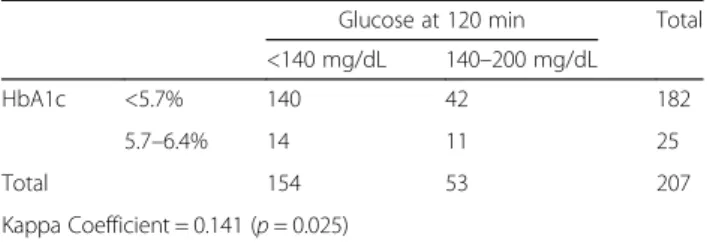
In Table 5 we present the results from the analyses
between OGTT and HbA1c. The kappa coefficient value was 0.141 (p = 0.025), which corresponds to only a slight agreement. In Table 6, results from the agreement between fasting glucose and HbA1c are presented, and the kappa coefficient was 0.013 (p = 0.848). In Table7, we present the results from the analyses between OGTT and fasting glucose. In this pair the kappa value was 0.206 (p < 0.001), which is considered to be a fair agreement.
Discussion
To our knowledge, this is the first study that has been carried out with HIV-infected patients, that combines the use of fasting glucose, OGTT and HbA1c, to estab-lish the diagnosis of glucose homeostasis disturbances.
Analyzing the prevalence of DM and prediabetes throughout these different methods, we observe that the results varied considerably. Regarding the diagnosis of DM, no patients were identified when HbA1c was used, 13 patients (5.9% prevalence) when OGTT was used, and seven patients (3.2% prevalence) when fasting glu-cose was used. Prediabetes had a prevalence of 14.1% (31 patients) when using HbA1c, 24.1% (53 patients) when using OGTT, and 20% (44 patients) when using fasting glucose. Thus, we can conclude that HbA1c was the method that least diagnosed cases, and that OGTT was the one that diagnosed the most cases.
In accordance with our findings, HbA1c has been found to underestimate glycemic levels in HIV-infected patients when compared with other types of diagnostic methods, in several studies [4,17–22]. Possible explana-tions for the lower than expected HbA1c values in these patients have been hypothesized. For example, low
hemoglobin values [19], and situations that shorten
erythrocyte lifespan, such as hemolysis or some hemo-globinopathies, have been associated with lower HbA1c values [18]. Diop et al. have found that the discordance HbA1c-fasting glucose was positively correlated with the mean cell volume, and that hemolysis, diagnosed by a
very low haptoglobin level, had a higher prevalence in the HIV-infected patients [18]. In fact, this relation-ship between mean cell volume and HbA1c-fasting glucose discordance has been observed by several au-thors [17, 18, 21–23], and Glesby et al. validated it
when they observed that higher mean cell volume values emerged as the single most important factor associated with a lower HbA1c than predicted by fasting glucose. High mean cell volume, as a marker of a greater propor-tion of younger erythrocytes that had a shorter time to
Table 3 Sample’s characteristics according to the presence of no DM, prediabetes and DM, accessed by OGTT
Glucose at 120 min P value
<140 mg/dL 140–200 mg/dL ≥200 mg/dL
n (%) 154 (70) 53 (24.1) 13 (5.9)
Sex [n (%)] 0.061
Male 101 (65.6) 26 (49.1) 6 (46.2)
Female 53 (34.4) 27 (50.9) 7 (53.8)
Age [years, mean (SD)] 43.4 (10.2) 50.4 (12.1) 55 (13.6) < 0.001
Duration of HIV infection [years, median (IR)] 8 (6) 7 (6) 10 (8) 0.980
cART [years, [median (IR)] 6 (5.3) 6 (7) 9 (9) 0.566
Clinical lipodystrophy [n (%)] 0.148
Without CL 78 (50.6) 24 (45.3) 3 (23.1)
With CL 76 (49.4) 29 (54.7) 10 (76.9)
Body Composition [n (%)] 0.078
No lipodystrophy 23 (15.5) 7 (13.5) 1 (7.7)
Isolated central fat accumulation 50 (33.8) 17 (32.7) 2 (15.4)
Lipoatrophy 45 (30.4) 11 (21.2) 2 (15.4)
Mixed form of lipodystrophy 30 (20.3) 17 (32.7) 8 (61.5)
BMI [(kg/m2), [median (IR)] 24.5 (5.8) 25.4 (6.4) 25.5 (3.3)
Waist circumference [cm, median (IR)] 90.5 (16) 91 (17.8) 95 (8.5) 0.687
CD4 cell count [cells/mm3, [median (IR)] 512.5 (336) 500 (311) 456 (509) 0.569
HIV RNA (<50) [n (%)] 138 (100) 44 (100) 10 (100) Hepatitis C co-infection [n (%)] 47 (30.9) 15 (28.8) 2 (16.7) 0.655 CDC clinical categories [n (%)] 0.252 A 90 (58.4) 24 (45.3) 5 (38.5) B 4 (2.6) 1 (1.9) 0 (0) C 60 (39) 28 (52.8) 8 (61.5) ART [n (%)] IP 77 (50) 36 (67.9) 10 (76.9) 0.023 NNRTI 82 (53.2) 17 (32.1) 3 (23.1) 0.005 NRTI 148 (96.1) 51 (96.2) 11 (84.6) 0.188
HOMA-IR index [median (IR)] 1.4 (1.5) 2.4 (2.5) 1.9 (3.2) < 0.001
QUICKI index [median (IR)] 0.4 (0.1) 0.3 (0.1) 0.4 (0.1) < 0.001
Total cholesterol [mg/dL, median (IR)] 224 (67) 224 (79) 234 (86) 0.743
LDL- cholesterol [mg/dL, median (IR)] 130 (70) 135 (66) 156 (79) 0.843
HDL- cholesterol [mg/dL, median (IR)] 49 (19) 44 (20) 52 (15) 0.314
Triglycerides [mg/dL, median (IR)] 186 (176.5) 223 (258.5) 170 (101) 0.131
Statin use [n (%)] 31 (20.1) 9 (17) 6 (46.2) 0.072
Fibrate use [n (%)] 43 (27.9) 21 (39.6) 1 (7.7) 0.061
DM diabetes mellitus, OGTT oral glucose tolerance test, CL clinical lipodystrophy, cART combination antiretroviral therapy, BMI body mass index, ART antiretroviral therapy,PI protease inhibitor, NNRTI non-nucleoside reverse transcriptase inhibitor, NRTI nucleoside reverse transcriptase inhibitor, HOMA homeostatic model assessment index,QUICKI quantitative insulin sensitivity check index, SD standard deviation, IR interquartile range
become glycated, suggest a greater red blood cell turnover in the HIV-infected patients [17]. The eventual relation-ship with drugs used in the treatment of HIV infection with these hematologic findings is difficult to study, as ART is generally used in combination.
OGTT was the method that diagnosed the highest percentage of patients with DM and prediabetes. Similar results have been found in the literature [24–26]. Gianotti et al. demonstrated in their study that OGTT revealed that 11% of their cohort with long-standing
Table 4 Sample’s characteristics according to the presence of no DM, prediabetes and DM, accessed by fasting glucose
Fasting glucose P value
<100 mg/dL 100–126 mg/dL ≥126 mg/dL
n (%) 169 (76.8) 44 (20) 7 (3.2)
Sex [n (%)] 0.049
Male 103 (60.9) 23 (52.3) 7 (100)
Female 66 (39.1) 21 (47.7) 0 (0)
Age [years, [median (IR)] 43 (15) 51.5 (15) 45 (14) 0.027
Duration of HIV infection [years, [median (IR)] 8 (6) 8 (5.8) 8 (6) 0.782
cART [years, [median (IR)] 6 (7) 6 (5.8) 8 (6) 0.408
Clinical lipodystrophy [n (%)] 0.082
Without CL 76 (45) 27 (61.4) 2 (28.6)
With CL 93 (55) 17 (38.6) 5 (71.4)
Body Composition [n (%)] 0.004
No lipodystrophy 26 (15.8) 4 (9.8) 1 (14.3)
Isolated central fat accumulation 46 (27.9) 22 (53.7) 1 (14.3)
Lipoatrophy 52 (31.5) 6 (14.6) 0 (0)
Mixed form of lipodystrophy 41 (24.8) 9 (22) 5 (71.4)
BMI [(kg/m2), [median (IR)] 24.4 (5.8) 26.1 (5.5) 26 (3.4) 0.052
Waist circumference [cm, [median (IR)] 88 (16.5) 95 (13.5) 95 (15) 0.005
CD4 cell count [cells/mm3, [median (IR)] 486 (344) 525 (298) 605 (382) 0.643
HIV RNA (<50) [n (%)] 151 (100) 35 (100) 6 (100) Hepatitis C co-infection [n (%)] 56 (33.5) 6 (14.3) 2 (28.6) 0.034 CDC clinical categories [n (%)] 0.398 A 89 (52.7) 27 (61.4) 3 (42.9) B 3 (1.8) 2 (4.5) 0 (0) C 77 (45.6) 15 (34.1) 4 (57.1) ART [n (%)] IP 96 (56.8) 23 (52.3) 4 (57.1) 0.885 NNRTI 79 (46.7) 20 (45.5) 3 (42.9) 0.999 NRTI 163 (96.4) 41 (93.2) 6 (85.7) 0.157
HOMA-IR index [median (IR)] 1.5 (1.3) 3.2 (2.6) 9.3 (6,8) < 0.001
QUICKI index [median (IR)] 0.4 (0.1) 0.3 (0.04) 0.3 (0.04) < 0.001
Total cholesterol [mg/dL, median (IR)] 220 (66) 240.5 (86) 234 (79) 0.061
LDL- cholesterol [mg/dL, median (IR)] 127 (67) 149 (62) 146 (74) 0.136
HDL- cholesterol [mg/dL, median (IR)] 47 (18) 49 (22) 41 (22) 0.651
Triglycerides [mg/dL, median (IR)] 189.5 (197.8) 214.5 (207.8) 184 (88) 0.975
Statin use [n (%)] 35 (20.7) 8 (18.2) 3 (42.9) 0.312
Fibrate use [n (%)] 50 (29.6) 15 (34.1) 0 (0) 0.200
DM diabetes mellitus, CL clinical lipodystrophy, cART combination antiretroviral therapy, BMI body mass index, ART antiretroviral therapy, PI protease inhibitor, NNRTI non-nucleoside reverse transcriptase inhibitor, NRTI nucleoside reverse transcriptase inhibitor, HOMA homeostatic model assessment index, QUICKI quantitative insulin sensitivity check index,SD standard deviation, IR interquartile range
HIV infection had prediabetes or DM, undiagnosed on the basis of fasting glucose levels alone [24], while Seang et al. detected a 31% relative increase in the prevalence
of DM diagnosis among HIV-infected women [25].
Epidemiological evidence has also supported this obser-vation in the general population, especially among older
patients [27]. In light of this knowledge, the 2017
European AIDS Clinical Society Guidelines recommend that HIV-infected patients with a fasting glucose diagno-sis of prediabetes should carry out an OGTT in order to identify overt diabetes [10].
With regards to the characteristics that differed signifi-cantly between the diagnostic groups, we observed that there were some that were important across all three methods, while others varied specifically, depending on the method used for the assessment.
Sex was a factor that showed association with the diag-nosis only when fasting glucose was used. With this method, the total number of patients that had the diag-nosis of DM were male, and there was also a higher prevalence of male (52.3% versus 47.7% female) in the prediabetes group. Some authors have reported a lack of significant differences between sexes when considering the risk factors for glucose homeostasis disturbances in HIV patients [24], while others, in agreement with our findings, stated that male sex was associated with in-creased risk of new-onset DM [5,28].
In all three methods, a progressive stage of glucose homeostasis disturbance was associated with older age. This finding is congruent with the great majority studies done on the subject [1–5, 7, 28, 29]. This has been
highlighted in recent literature that, after the
introduction of ART (which has dramatically reduced HIV-related mortality and morbidity, substantially in-creasing longevity), HIV-infected individuals have a poten-tial of developing metabolic complications, which is comparable to that of the general population [1]. In these patients, the importance of traditional cardio-metabolic risk factors should be emphasized, as these are likely to exert an equal influence on HIV-infected patients as they do in the general population [1]. On the other hand, there have been studies that suggest that the aging process might be premature or accelerated in these patients, lead-ing to the manifestation of metabolic complications earlier in life [2]. This highlights the importance of closely moni-toring for the development of cardio-metabolic abnormal-ities in these patients.
Regarding the duration of HIV infection and ART use, we observed that, regardless of the diagnostic method used, no significant difference between the groups was ob-served. This contrasts with findings in the literature, that suggest that a higher prevalence of DM is associated with a higher duration of HIV infection and ART use [1,3,30], but, is in agreement with a study done by Araújo et al., in which also, no association between the duration of infec-tion and the development of glucose homeostasis distur-bances was found [31].
BMI was considered to be significantly higher in predia-betes patients, compared to the no DM patients, but only when HbA1c was used for the assessment. This finding is corroborated by several authors [3–5, 7,28–30] who de-scribed a significant association between a higher BMI and the presence of disturbances of glucose homeostasis in HIV-infected patients. Additional to the BMI, abdom-inal fat accumulation or trunk obesity has been identified as a factor primarily associated with the prevalence of dis-turbances of glucose homeostasis in HIV-infected patients [8,25,26,30–33], just as described in the general popula-tion. In our study, when fasting glucose was used for the assessment of diabetes, there was a significant association between waist circumference and the diagnosis. This par-ameter was higher in DM and prediabetes patients, when compared with the no DM ones. Furthermore, in this diagnostic method, we obtained significant differences re-garding the classes of body composition, with most signifi-cant differences observed in the isolated central fat accumulation (highest percentage of patients in the predi-abetes group) and mixed forms of lipodystrophy (highest percentage of patients in the DM group), which mirror the effect of these higher waist circumference levels in these diagnostic groups. In fact, it has been reported that abdominal fat accumulation is a major contributor to glu-cose metabolism disturbances when compared to lipoatro-phy associated with the acquired lipodystrolipoatro-phy of HIV infection [8]. Endocrine activity of adipose tissue takes a central place in the pathogenesis of metabolic disorders
Table 5 Analysis of the agreement between HbA1c and Glucose at 120 min during an OGTT
Glucose at 120 min Total <140 mg/dL 140–200 mg/dL
HbA1c <5.7% 140 42 182
5.7–6.4% 14 11 25
Total 154 53 207
Kappa Coefficient = 0.141 (p = 0.025)
HbA1c glycated haemoglobin, OGTT oral glucose tolerance test
Table 6 Analysis of the agreement between HbA1c and fasting glucose
Fasting glucose Total <100 mg/dL 100–126 mg/dL
HbA1c <5.7% 148 39 187
5.7–6.4% 21 5 26
Total 169 44 213
Kappa Coefficient = 0.013 (p = 0.848)
[34], thus it makes sense, pathogenically, that this relation can be observe. There were no differences in the diagnos-tic groups regarding the presence of absence of clinical lipodystrophy, in neither of the diagnostic methods.
Hepatitis C coinfection has been found to be associated with the development of glucose homeostasis disturbances among HIV-infected patients [7,29,31]. In our study, when fasting glucose was used for assess-ment, Hepatitis C coinfection had a prevalence of 33.5% (56 patients) in the no DM group, 14.3% (6 pa-tients) in the prediabetes group, and 28.6% (2 papa-tients) in the DM group. Non-diabetic patients had the highest percentage of coinfection. However, we have to keep in mind that in the prediabetes and DM group, the number of patients is very reduced. Hence, the small sample size may be a limitation for the interpretation of this finding.
The association between ART and the development of diabetes has been frequently described throughout the literature [1, 4, 5, 26]. When we analyzed the type of ART used, only when the OGTT method was applied, were there significant differences. In this group, we ob-served that progressive stage of glucose homeostasis dis-turbance was positively associated with the use of protease inhibitors, and negatively associated with the use of non-nucleoside reverse transcriptase inhibitors. It has in fact been reported that protease inhibitors-based regimens might be associated with the development, and/or acceleration of the progression of metabolic com-plications [1, 30], although this association is not con-sensual among the literature [5,7,31,33,35,36]. Slama et al. reported that certain ARTs (protease inhibitors, non-nucleoside reverse transcriptase inhibitors and zidovudine) were associated with the HbA1c-fasting glucose discordance [22], however, specifically regarding the use of HbA1c for the assessment, similar to our find-ings, Kim et al. reported a lack of association between all types of ART and the diagnosis of diabetes [37]. In other studies, non-nucleoside reverse transcriptase inhibitors were recognized as being an alternative regimen to pro-tease inhibitors in patients with metabolic complica-tion, as these had a lower prevalence of such complications [1, 36]. On the other hand, nucleoside reverse transcriptase inhibitors have been associated
with an increased risk of glucose metabolism distur-bances [5, 28, 31, 35, 36], and with HbA1-fasting glu-cose discordance in the assessment of HIV-infected patients, suggesting that, in these patients, HbA1c should not be used for the assessment of glycaemia [21]. In our study, there was no significant association between the use of nucleoside reverse transcriptase in-hibitors and the development of glucose homeostasis disturbances. It is, however, extremely difficult to deter-mine which drug is responsible for the increased risk of glucose metabolism disturbances, as patients usually use these pharmacological solutions in combination with each other, and, furthermore, therapeutic changes often occur during the course of the disease.
Despite the euglycemic insulin clamp technique being the gold standard technique for the study of tissue sensi-tivity to insulin [38], we used easier-to-perform methods - HOMA-IR and QUICKI indexes, that have shown a strong correlation with the gold standard, and good cor-relation between each other, which allowed us to have a robust estimate of insulin sensitivity [15, 16, 24]. The HOMA-IR index median levels were higher in the predi-abetes group, when compared to the no DM group when we used the HbA1c, lowest in the no DM group and highest in the DM group when we used fasting glucose, and highest in the prediabetes group and lowest in the no DM group when we used OGTT. These results sup-port the evidence that progressive stages of glucose me-tabolism disorders are associated with progressive stages of insulin resistance. In the case of OGTT, where the prediabetes group had indexes that were more altered than the DM group, a possible explanation may be that, in a DM state, insulin deficiency is superior to that of the prediabetes state, or this may be due to a small sam-ple in the DM group. Hence, in both prediabetes and DM, we have insulin resistance, however, as insulin defi-ciency is greater in the DM state, the calculation of these indexes is affected, becoming less pronounced.
There were no differences in HIV-related parameters between the different groups of glucose homeostasis dis-turbances. Research has associated a lower CD4 cell count with higher prevalence of glucose homeostasis dis-turbances [3, 24], and a count of <500 cells/mm3 was
Table 7 Analysis of the agreement between fasting glucose and Glucose at 120 min during a OGTT
Glucose at 120 min Total
<140 mg/dL 140–200 mg/dL ≥200 mg/dL Fasting glucose <100 mg/dL 128 34 7 169 100–126 mg/dL 24 17 3 44 ≥126 mg/dL 2 2 3 7 Total 154 53 13 220 Kappa Coefficient = 0.206 (p < 0.001)
found to be strongly associated with HbA1c-fasting glu-cose discordance [22]. Although we had, throughout our study, groups that registered CD4 cell counts below this level, these were never statistically significant. Thus, we can hypothesize that this characteristic had a small im-pact on the development of this kind of complication.
In our agreement analyses, we used the kappa coeffi-cient, which is a robust statistic, useful for either interrater or intrarater reliability testing. Kappa values are considered to represent a slight agreement when they are between 0 and 0.20 and fair agreement when they are between 0.21 and 0.40 [39]. Hence, in face of our results, we can con-clude that the agreement between fasting glucose-OGTT was fair (0.206), and between fasting glucose-HbA1c (0.013) and OGTT-HbA1c (0.141) was slight. Conse-quently, we can say that these diagnostic methods agree much less than would be expect only by chance.
However, the ability to use HbA1c to screen HIV-infected patients in a nonfasting state and for esti-mating long-term glycaemia makes it a very useful tool
for the management of DM [23]. Several authors have
shown that HbA1c underestimates glycaemia levels in these patients, making it a less accurate diagnostic method [4, 17, 18, 21, 22]. In fact, Eckhardt et al. have shown HbA1c to be very insensitive, but highly specific for the diagnosis of DM in HIV patients [23]. In light of this evidence, the 2017 American Diabetes Association guidelines state that this test underestimates glycaemia in HIV-infected individuals, and that it is not recommended for diagnosis, and even for monitoring, which presents
challenges [40]. On the other hand, OGTT has been
shown to reveal cases of prediabetes, and even DM, in in-dividuals with normal fasting glucose levels [24,25]. Thus, the use of this test might be an effective method for detect-ing these disturbances of glucose metabolism prematurely, making it possible to avoid the severe complications of the disease by means of an early diagnosis [24].
Due to the fact that the HIV population has the poten-tial to develop cardio-metabolic abnormalities through multiple pathways, determining the magnitude of DM in this population highlights the need for preventive and management strategies. Overall, the optimal diagnostic al-gorithm is still poorly defined, and the question remains as to whether clinicians should use direct measures of gly-caemia, or HbA1c to achieve a more accurate diagnosis.
Limitations
This study had some limitations, mainly related to the cross-sectional nature of our analyses, which prevents us from making any conclusions regarding causality. Although we included all patients referred to our depart-ment, we cannot exclude bias in the referral, as some pa-tients could have been referred because there was already some suspicion of them having DM or other
metabolic disorder. Therefore, we might have selected a study population with a different distribution of meta-bolic and endocrine complications, compared to the general patients’ population. Consequently, these results cannot be extrapolated for the total HIV population. Conclusions
In our study, it was clear that disturbances of glucose homeostasis was a prevalent problem, specifically predia-betes, which had values of 14.1, 24.1, and 20% prevalence, depending on the method used for diagnosis. Hence, more sensitive diagnostic tools are essential for prevention of DM complications in this population. Our results indicate that HbA1c underestimated glycaemia levels, and that OGTT might, in fact, allow for an earlier diagnosis of glu-cose homeostasis disturbances, as this was the method that had a higher capacity to detect them. Therefore, in the HIV population, it would be prudent for medical prac-titioners to use direct measures of glycaemia (fasting glu-cose or OGTT) to diagnose gluglu-cose homeostasis disturbances, or, perhaps, even consider establishing lower HbA1c thresholds to determine this diagnosis.
Abbreviations
ADA:American Diabetes Association; AIDS: Acquired immune deficiency syndrome; ART: Antiretroviral therapy; BMI: Body mass index; CDC: Centers for disease control and prevention; DM: Diabetes mellitus;
HbA1c: Hemoglobin A1c/glycated Hemoglobin; HDL: High density lipoprotein; HIV: Human immunodeficiency virus; HOMA: Homeostatic model assessment; LDL: Low density lipoprotein; OGTT: Oral glucose tolerance test; QUICKI: Quantitative insulin sensitivity check index
Funding
ACS has a FCT Investigator contract IF/01060/2015. The authors declare that they received no funding to conduct this study.
Availability of data and materials
The data that support the findings of this study are available on request from the corresponding author [ARC]. The data are not publicly available because they contain information that could compromise research participant privacy/consent.
Authors’ contributions
ARC conceived the study, participated in its design, in the acquisition of data, and drafted the manuscript; FAM participated in the acquisition of data and revised the manuscript; ACS performed the statistical analysis; ASP participated in the acquisition of data and revised the manuscript; AS revised critically the manuscript; DC revised critically the manuscript; PF participated in the acquisition of data, in the design of the study and revised critically the manuscript. All authors read and approved the final manuscript.
Ethics approval and consent to participate
All patients provided written informed consent and the study protocol was approved by the São João Hospital’s Ethics Committee for Health. Consent for publication
Not applicable.
Competing interests
The authors declare that they have no competing interests.
Publisher’s Note
Springer Nature remains neutral with regard to jurisdictional claims in published maps and institutional affiliations.
Author details
1Medical Student. Faculty of Medicine, University of Porto. Alameda Prof. Hernâni Monteiro, 4200-319 Porto, Portugal.2EPIUnit - Instituto de Saúde Pública, Universidade do Porto, Porto, Portugal.3Departamento de Ciências da Saúde Pública e Forenses e Educação Médica, Faculdade de Medicina, Universidade do Porto, Porto, Portugal.4Infectious Diseases Department, Centro Hospitalar São João, Porto, Portugal.5Renal, Urological and Infectious Diseases Department, Faculty of Medicine of University of Porto, Porto, Portugal.6Endocrinology, Diabetes and Metabolism Department, Centro Hospitalar São João, and Faculty of Medicine, i3S - Instituto de Investigação e Inovação em Saúde, University of Porto, Porto, Portugal.
Received: 15 June 2017 Accepted: 28 June 2018
References
1. Nguyen KA, Peer N, Mills EJ, Kengne AP. A meta-analysis of the metabolic syndrome prevalence in the global HIV-infected population. PLoS One. 2016;11(3):e0150970.
2. Schouten J, Wit FW, Stolte IG, Kootstra NA, van der Valk M, Geerlings SE, Prins M, Reiss P. Cross-sectional comparison of the prevalence of age-associated comorbidities and their risk factors between HIV-infected and uninfected individuals: the AGEhIV cohort study. Clin Infect Dis. 2014;59(12):1787–97. 3. Roerink ME, Meijering R, Bosch M, de Galan BE, van Crevel R. Diabetes in
patients with HIV: patient characteristics, management and screening. Neth J Med. 2015;73(7):310–5.
4. Tien PC, Schneider MF, Cox C, Karim R, Cohen M, Sharma A, Young M, Glesby MJ. Association of HIV infection with incident diabetes mellitus: impact of using hemoglobin A1C as a criterion for diabetes. J Acquir Immune Defic Syndr. 2012;61(3):334–40.
5. De Wit S, Sabin CA, Weber R, Worm SW, Reiss P, Cazanave C, El-Sadr W, Monforte A, Fontas E, Law MG, et al. Incidence and risk factors for new-onset diabetes in HIV-infected patients: the data collection on adverse events of anti-HIV drugs (D:a:D) study. Diabetes Care. 2008;31(6):1224–9. 6. Worm SW, De Wit S, Weber R, Sabin CA, Reiss P, El-Sadr W, Monforte AD, Kirk
O, Fontas E, Dabis F, et al. Diabetes mellitus, preexisting coronary heart disease, and the risk of subsequent coronary heart disease events in patients infected with human immunodeficiency virus: the data collection on adverse events of anti-HIV drugs (D:a:D study). Circulation. 2009;119(6):805–11.
7. Lichtenstein KA, Hart RL, Wood KC, Bozzette S, Buchacz K, Brooks JT. Statin use is associated with incident diabetes mellitus among patients in the HIV outpatient study. J Acquir Immune Defic Syndr. 2015;69(3):306–11. 8. Freitas P, Carvalho D, Santos AC, Mesquita J, Matos MJ, Madureira AJ,
Martinez E, Sarmento A, Medina JL. Lipodystrophy defined by fat mass ratio in HIV-infected patients is associated with a high prevalence of glucose disturbances and insulin resistance. BMC Infect Dis. 2012;12:180. 9. Piepoli MF, Hoes AW, Agewall S, Albus C, Brotons C, Catapano AL, Cooney
MT, Corra U, Cosyns B, Deaton C, et al. European guidelines on cardiovascular disease prevention in clinical practice: the sixth joint task force of the European Society of Cardiology and Other Societies on cardiovascular disease prevention in clinical practice (constituted by representatives of 10 societies and by invited experts) developed with the special contribution of the European Association for Cardiovascular Prevention & rehabilitation (EACPR). Eur Heart J. 2016;37(29):2315–81. 10. EACS Guidelines 8.2.http://www.eacsociety.org/files/guidelines_8.2-english.pdf. 11. Centers for Disease Control and Prevention. 1993 revised classification
system for HIV infection and expanded surveillance case definition for AIDS among adolescents and adults. MMWR Recomm Rep. 1992;41(RR-17):1–19. 12. Bonnet E, Delpierre C, Sommet A, Marion-Latard F, Herve R, Aquilina C, Labau E, Obadia M, Marchou B, Massip P, et al. Total body composition by DXA of 241 HIV-negative men and 162 HIV-infected men: proposal of reference values for defining lipodystrophy. J Clin Densitom. 2005;8(3):287–92.
13. Freitas P, Carvalho D, Santos AC, Mesquita J, Correia F, Xerinda S, Marques R, Martinez E, Sarmento A, Medina JL. Assessment of body fat composition disturbances by bioimpedance analysis in HIV-infected adults. J Endocrinol Investig. 2011;34(10):e321–9.
14. American Diabetes Association. 2. Classification and Diagnosis of Diabetes. Diabetes Care. 2017;40(Supplement 1):S11–24.
15. Bonora E, Targher G, Alberiche M, Bonadonna RC, Saggiani F, Zenere MB, Monauni T, Muggeo M. Homeostasis model assessment closely mirrors the glucose clamp technique in the assessment of insulin sensitivity: studies in
subjects with various degrees of glucose tolerance and insulin sensitivity. Diabetes Care. 2000;23(1):57–63.
16. Katz A, Nambi SS, Mather K, Baron AD, Follmann DA, Sullivan G, Quon MJ. Quantitative insulin sensitivity check index: a simple, accurate method for assessing insulin sensitivity in humans. J Clin Endocrinol Metab. 2000;85(7): 2402–10.
17. Glesby MJ, Hoover DR, Shi Q, Danoff A, Howard A, Tien P, Merenstein D, Cohen M, Golub E, Dehovitz J, et al. Glycated haemoglobin in diabetic women with and without HIV infection: data from the Women’s interagency HIV study. Antivir Ther. 2010;15(4):571–7.
18. Diop M-E, Bastard J-P, Meunier N, Th√©venet S, Maachi M, Capeau J, Pialoux G, Vigouroux C. Inappropriately low glycated hemoglobin values and hemolysis in HIV-infected patients. AIDS Res Hum Retrovir. 2006;22(12):1242–7. 19. Duran L, Rodriguez C, Drozd D, Nance RM, Delaney JA, Burkholder G,
Mugavero MJ, Willig JH, Warriner AH, Crane PK, et al. Fructosamine and hemoglobin A1c correlations in HIV-infected adults in routine clinical care: impact of Anemia and albumin levels. AIDS Res Treat. 2015;2015:478750. 20. Monroe AK, Glesby MJ, Brown TT. Diagnosing and managing diabetes in HIV-infected patients: current concepts. Clin Infect Dis. 2015;60(3):453–62. 21. Kim PS, Woods C, Georgoff P, Crum D, Rosenberg A, Smith M, Hadigan C. A1C
underestimates glycemia in HIV infection. Diabetes Care. 2009;32(9):1591–3. 22. Slama L, Palella FJ Jr, Abraham AG, Li X, Vigouroux C, Pialoux G, Kingsley L,
Lake JE, Brown TT. Inaccuracy of haemoglobin A1c among HIV-infected men: effects of CD4 cell count, antiretroviral therapies and haematological parameters. J Antimicrob Chemother. 2014;69(12):3360–7.
23. Eckhardt BJ, Holzman RS, Kwan CK, Baghdadi J, Aberg JA. Glycated Hemoglobin A(1c) as screening for diabetes mellitus in HIV-infected individuals. AIDS Patient Care STDs. 2012;26(4):197–201.
24. Gianotti N, Visco F, Galli L, Barda B, Piatti P, Salpietro S, Bigoloni A, Vinci C, Nozza S, Gallotta G, et al. Detecting impaired glucose tolerance or type 2 diabetes mellitus by means of an oral glucose tolerance test in HIV-infected patients. HIV Med. 2011;12(2):109–17.
25. Seang S, Lake JE, Tian F, Anastos K, Cohen MH, Tien PC. Oral glucose tolerance testing identifies HIV+ infected women with diabetes mellitus (DM) not captured by standard DM definition. J AIDS Clin Res. 2016;7(2):545. 26. Howard AA, Floris-Moore M, Arnsten JH, Santoro N, Fleischer N, Lo Y,
Schoenbaum EE. Disorders of glucose metabolism in HIV-infected women. Clin Infect Dis. 2005;40(10):1492–9.
27. Wahl PW, Savage PJ, Psaty BM, Orchard TJ, Robbins JA, Tracy RP. Diabetes in older adults: comparison of 1997 American Diabetes Association
classification of diabetes mellitus with 1985 WHO classification. Lancet. 1998; 352(9133):1012–5.
28. Ledergerber B, Furrer H, Rickenbach M, Lehmann R, Elzi L, Hirschel B, Cavassini M, Bernasconi E, Schmid P, Egger M, et al. Factors associated with the incidence of type 2 diabetes mellitus in HIV-infected participants in the Swiss HIV cohort study. Clin Infect Dis. 2007;45(1):111–9.
29. Brar I, Shuter J, Thomas A, Daniels E, Absalon J. A comparison of factors associated with prevalent diabetes mellitus among HIV-infected antiretroviral-naive individuals versus individuals in the National Health and nutritional examination survey cohort. J Acquir Immune Defic Syndr. 2007; 45(1):66–71.
30. Blass SC, Ellinger S, Vogel M, Ingiliz P, Spengler U, Stehle P, von Ruecker A, Rockstroh JK. Overweight HIV patients with abdominal fat distribution treated with protease inhibitors are at high risk for abnormalities in glucose metabolism - a reason for glycemic control. Eur J Med Res. 2008;13(5):209–14. 31. Araujo S, Banon S, Machuca I, Moreno A, Perez-Elias MJ, Casado JL. Prevalence
of insulin resistance and risk of diabetes mellitus in HIV-infected patients receiving current antiretroviral drugs. Eur J Endocrinol. 2014;171(5):545–54. 32. Rhee JY, Bahtila TD, Palmer D, Tih PM, Aberg JA, LeRoith D, Jao J.
Prediabetes and diabetes among HIV-infected adults in Cameroon. Diabetes Metab Res Rev. 2016;32(6):544–9.
33. Kosmiski LA, Scherzer R, Heymsfield SB, Rimland D, Simberkoff MS, Sidney S, Shlipak MG, Bacchetti P, Biggs ML, Grunfeld C, et al. Association of Increased Upper Trunk and Decreased leg fat with 2-h glucose in control and HIV-infected persons. Diabetes Care. 2011;34(11):2448–53.
34. Drelichowska J, Kwiatkowska WÇ, Knysz B, Witkiewicz W. Metabolic syndrome in HIV-positive patients. HIV AIDS Rev. 2015;14(2):35–41. 35. Brown TT, Li X, Cole SR, Kingsley LA, Palella FJ, Riddler SA, Chmiel JS,
Visscher BR, Margolick JB, Dobs AS. Cumulative exposure to nucleoside analogue reverse transcriptase inhibitors is associated with insulin resistance markers in the multicenter AIDS cohort study. AIDS. 2005;19(13):1375–83.
36. Tien PC, Schneider MF, Cole SR, Levine AM, Cohen M, DeHovitz J, Young M, Justman JE. Antiretroviral therapy exposure and incidence of diabetes mellitus in the Women’s interagency HIV study. AIDS. 2007;21(13):1739–45. 37. Kim SY, Friedmann P, Seth A, Fleckman AM. Monitoring HIV-infected
patients with diabetes: hemoglobin A1c, Fructosamine, or glucose? Clin Med Insights Endocrinol Diabetes. 2014;7:41–5.
38. DeFronzo RA, Tobin JD, Andres R. Glucose clamp technique: a method for quantifying insulin secretion and resistance. Am J Phys. 1979;237(3):E214–23. 39. McHugh ML. Interrater reliability: the kappa statistic. Biochem Med (Zagreb).
2012;22(3):276–82.
40. American Diabetes Association. 3. Comprehensive Medical Evaluation and Assessment of Comorbidities. Diabetes Care. 2017;40(Supplement 1):S25–32.