2010 THE AUTHORS. JOURNAL COMPILATION 2010 BJU INTERNATIONAL Investigative Urology
INHIBITION OF BLADDER TUMOUR BY SIROLIMUS PARADA
et al.
Inhibition of bladder tumour growth
by sirolimus in an experimental
carcinogenesis model
Belmiro Parada
1,2, Flávio Reis
1,6, Arnaldo Figueiredo
1,2, Pedro Nunes
2,
Edite Teixeira-Lemos
1, Patrícia Garrido
1, José Sereno
1, Rui Pinto
4,
Maria F.X. Cunha
3, Paula Neto
3, Paulo Santos
5, Isabel Velada
5, Alfredo Mota
2and Frederico Teixeira
1,61Institute of Pharmacology & Experimental Therapeutics, IBILI, Medicine Faculty, Coimbra University, 2Department of Urology & Renal Transplantation and 3Pathology Unit, Coimbra University Hospital, 4Pharmacology &
Pharmacotoxicology Unit, Pharmacy School of Lisbon, Lisbon, 5Functional Genomics Laboratory, Center of Histocompatibility of the Centre, Coimbra, and 6Institute for Molecular and Cellular Biology, Porto University, Porto, Portugal
Accepted for publication 4 January 2010
immunohistochemical and gene expression evaluation. Blood was collected for the determination of several serum proliferative and inflammatory markers. Lipid
peroxidation, through serum
malondialdehyde (MDA) content, and total antioxidant status (TAS) were also evaluated.
RESULTS
Sirolimus caused a marked inhibition of bladder tumour growth. When compared with group 3, group 4 had a reduced proportion of rats with tumour (three of eight vs eight of 12), and significantly fewer tumours per rat, with a mean (SD) of 1.00 (0.0) vs 1.88 (0.35), and tumour volume per tumour, of 0.30 (0.11) vs 66.1 (48.9) mm3
, with less aggressive histological changes, i.e. a marked reduction in hyperplasia (four of eight vs 12/12), high-grade dysplasia (four of eight vs 11/12) and urothelial tumour. Rats in group 4 had no infiltrative bladder cancers and had a lower incidence of high-grade tumours than rats in group 3. The rats in group 4 had decreased serum levels of
transforming growth factor-β1, higher levels of tumour necrosis factor-α, and higher levels of serum TAS and a better serum MDA/TAS ratio, a marker of more favourable redox status. Furthermore, the down-regulation of bladder caspase 3 gene expression and the increased Ki67 immunostaining in group 3 were significantly attenuated in group 4.
CONCLUSIONS
Sirolimus given as an oral agent, 2 mg/kg/ day, significantly inhibited rat bladder carcinogenesis. Sirolimus reduced the number and volume of tumours and induced a less aggressive histological behaviour. This might be due to antiproliferative and antioxidant properties, as well as to the restoration of apoptotic pathways.
KEYWORDS
bladder cancer, chemoprevention, sirolimus
OBJECTIVE
To investigate the anticarcinogenic effects of sirolimus 2 mg/kg/day on a rat model of urinary bladder carcinogenesis induced with N-butyl-N(4-hydroxybutyl)nitrosamine (BBN).
MATERIALS AND METHODS
Thirty-six male Wistar rats were divided into four groups: 1, a control group (eight), given tap water only; 2, a sirolimus control group (eight), given 2 mg/kg/day; 3, a carcinogen (BBN) group (12) exposed to 0.05% BBN; 4, a treatment group (sirolimus/BBN; eight) given 2 mg/kg/day + 0.05% BBN. In the tumour-induction phase, from week 1 to week 8, rats from groups 3 and 4 received
BBN ad libitum in drinking water. In the
treatment phase, from week 8 to week 20, rats from groups 2 and 4 received sirolimus 2 mg/kg/day by an oesophageal cannula. At week 20 the rats were killed humanely, and the number and size of tumours recorded. The bladders were collected for histological,
INTRODUCTION
Bladder cancer is a very prevalent tumour, accounting for 5–10% of all malignancies in Western countries [1]. Despite adequate treatment and follow-up, 30–80% of these patients develop recurrent tumours within 5 years, and up to 45% can progress to more
invasive and aggressive forms of cancer [2]. The burden of bladder cancer could be reduced through the implementation of several primary and secondary prevention strategies, including the elimination of known risk factors. Furthermore, this cancer can be a good model for pharmacological prevention. Chemopreventive properties of several agents
have been studied, such as green-tea polyphenols, soy products, vitamins, selenium and NSAIDs [3]. However, an efficient agent that could easily be given to high-risk patients has not been found.
Sirolimus is a natural macrocyclic lactone produced by Streptomyces hygroscopicus,
BJUI
B J U I N T E R N A T I O N A LP A R A D A E T A L .
which was discovered in the soil of the Vai Atari region of Rapa Nui (Easter Island, 1975) [4]. It is a potent immunosupressor widely used to prevent allograft rejection in organ transplantation. It binds intracellularly to the immunophilin FKBP-12, forming a complex that inhibits the enzymatic activation of the mammalian target of rapamycin (mTOR) [5]. mTOR is a member of a family of protein kinases termed phosphoinositide 3-kinase related kinases, which are involved in many critical regulatory cellular functions such as cell-cycle progression, cellular responses to DNA damage, DNA repair and DNA recombination [6]. Thus, sirolimus has potent antiproliferative properties due to its ability to modulate critical signal-transduction pathways that link mitogenic stimuli to the synthesis of proteins required for cell-cycle progression [7]. Sirolimus has shown promising antitumoral activity in several cancers but it has not previously been used in bladder cancer [8–11].
MATERIALS AND METHODS
Thirty-six male Wistar rats (Charles River Laboratory Inc, Barcelona, Spain), 250–285 g, 8 weeks old, were maintained in an air-conditioned room, subjected to 12-h dark/ light cycles and given standard laboratory rat chow (IPM-R20, Letica, Barcelona, Spain) and free access to tap water. Animal experiments were conducted according to the European Communities Council Directives on Animal Care.
The rats were divided in four groups: 1, a control group of eight given tap water only; 2, a sirolimus control group of eight given 2 mg/ kg/day (Rapamune®, Wyett Europe Ltd, Berkshire, UK); 3, a carcinogen group of 12, given 0.05% N-butyl-N-(4-hydroxybutyl) nitrosamine (BBN; Tokyo Chemical Industry Co., Ltd, Tokyo, Japan); and 4, a treatment group of eight, given 2 mg/kg/day sirolimus and 0.05% BBN.
The experimental study was conducted in two steps, a tumour-induction phase from week 1 to week 8, when rats from groups 3 and 4 received BBN ad libitum in drinking water, and a treatment phase from week 8 to week 20, when rats in groups 2 and 4 received sirolimus 2 mg/kg/day by an oesophageal cannula. All rats completed the 20-week study protocol, and body weight and amount drunk were monitored during the
experimental period.
At the end of treatment the rats were injected with intraperitoneal anaesthesia, 2 mg/kg of a 2 : 1 (v : v) 50 mg/mL ketamine (Ketalar®, Parke-Davis, Pfizer Laboratories Lda, Seixal, Portugal) solution in 2.5% chlorpromazine (Largatil®, Rhône-Poulenc Rorer, Vitória Laboratories, Amadora, Portugal). Blood samples were immediately collected by venepuncture from the jugular vein in needles with no anticoagulant (for serum samples collection) or with EDTA.
Under anaesthesia the rats were killed by cervical dislocation, and the lungs, stomach, liver, kidneys and intestines immediately removed, weighed and placed in ice-cold Krebs buffer or formaldehyde for further analysis. Before removal, bladders were intraluminally injected with a buffered formaldehyde solution as pre-fixation for histological analyses. A ligature was placed around the bladder neck to maintain proper distension.
For a macroscopic quantitative analysis (number and volume of tumours), each bladder pre-fixed in formaldehyde was carefully opened, the lumen inspected for grossly visible lesions and the number of tumours per rat and the volume of each tumour were recorded to calculate the incidence of tumour per group and the mean volume per rat. A tumour was defined as a lesion of >0.5 mm in diameter.
For the microscopic qualitative analysis (bladder histology), the bladder was immersion-fixed in 4% buffered formaldehyde and processed for paraffin sectioning. Three slices from each bladder were embedded, 3 μm sections cut and stained with haematoxylin and eosin (H&E), and examined histologically by one author (M.F.X.C.) unaware of the treatments. For bladder Ki67 immunostaining, formalin-fixed, paraffin-embedded tissue blocks were sectioned at 5-mm thickness, and immunostained using the avidin-biotin peroxidase method, as previously described [12]. Sections were deparaffinized in xylene and rehydrated through graded alcohols. Endogenous peroxidase activity was blocked by 3% hydrogen peroxide in PBS, the slides washed three times (2 min each) and then incubated with blocking serum for 10 min to block nonspecific binding. The excess of blocking serum was removed, and the sections than incubated with primary
antibody (anti-Ki67 monoclonal antibody; NeoMarkers, LabVision, Fremont, CA, USA) diluted at 1 : 200) for 30 min at room temperature. After washing, the biotinylated secondary antibody was used as a second layer for 10 min. The sections were then washed three times for 5 min each. Streptavidin-peroxidase complex was applied for 10 min, the sections washed in PBS, and the peroxidase signal was developed in 0.05% diaminobenzidine and 0.01% hydrogen peroxide in PBS. The sections were lightly counterstained with haematoxylin. Brown diffuse nuclear staining was seen in positive cases of Ki67.
For bladder gene expression analysis, total RNA was isolated from paraffin-embedded bladder tissue sections. Samples were processed according to the protocol of Purification of Total RNA from FFPE Tissue Sections from RNeasy® FFPE kit (Qiagen, Hilden, Germany). Total RNA was eluted in 30 μL of RNase-free water (without optional treatment with DNAse). To quantify the amount of total RNA extracted and verify RNA integrity (using the RNA integrity number), samples were analysed using 6000 Nano Chip® kit, in Agilent 2100 bioanalyser (Agilent Technologies, Walbronn, Germany) and 2100 expert software, following the manufacturer’s instructions. The yield from isolation was from 0.5 to 3 μg; RNA integrity numbers were 6.0–9.0 and purity (A260/A280)
was 1.8–2.0.
RNA was reverse transcribed with SuperScriptTM
III First-Strand Synthesis System for RT-PCR (Invitrogen, CA, USA); 1 μg of total RNA was mixed with a 2× First-Strand Reaction Mix and a SuperScriptTM
III Enzyme Mix (oligo(dT) plus random hexamers), according to the manufacturer’s instructions. Reactions were carried out in a thermocycler Gene Amp PCR System 9600 (Perkin Elmer, Norwalk, CO, USA), for 10 min at 25 °C, 50 min at 50 °C and 5 min at 85 °C. Reaction products were then digested with 1 μL RNase H for 20 min at 37 °C and, finally, cDNA eluted to a final volume of 50 μL and stored at −20 °C.
Relative gene expression was quantified by real-time PCR using the LightCycler® 480 II (Roche, Rotkreuz, Switzerland). A normalization step preceded the quantification of gene expression, using geNorm Housekeeping Gene Selection kit for Rattus norvegicus (Primer Design,
I N H I B I T I O N O F B L A D D E R T U M O U R B Y S I R O L I M U S
Southampton, UK) and geNorm software (Ghent University Hospital, Center for Medical Genetics, Ghent, Belgium) to select optimal reference genes for the present study [13]; the selected genes were glyceraldehyde phosphate dehydrogenase (Gapdh) and ribosomal protein L13 (Rpl13).
Real-time PCR reactions used QuantiTect® Primer Assay (Qiagen, Hilden, Germany) for the gene of interest, caspase 3, and the endogenous controls selected previously (Table 1), together with QuantiTect SYBR Green PCR Kit Gene expression. RT-PCR reactions were carried out with 100 ng cDNA sample, primers (50–200 nM) and 1× QuantiTect SYBR Green PCR Master Mix. Non-template control reactions were used for each gene, to ensure no unspecific amplification. Reactions were performed with the following thermal profile: 10 min at 95 °C plus 40 cycles of 15 s at 95 °C and 1 min at 60 °C. Real-time PCR results were analysed with LightCycler 480 software, version 1.5 (Roche, Rotkreuz, Switzerland) and quantification used the 2– ΔΔCt
method [14].
Serum levels of TGF-β1, TNF-α and interleukin-1β (IL-1β) were measured using ultrasensitive Quantikine® ELISA kits (R & D Systems, Minneapolis, USA). Serum C-reactive protein (CRP) was determined using an ELISA kit from Helica Biosystems, Inc. (Fullerton, CA, USA). All assays were performed in duplicate.
Serum redox status was assessed by two methods: a thiobarbituric acid reactive-species assay, in which serum was used to determine the products of lipid peroxidation, i.e. malondialdehyde (MDA), as previously described [15]; and a ferric reducing antioxidant potential (FRAP) assay, in which serum antioxidant capacity was measured as FRAP, as previously described [16], and termed the total antioxidant status (TAS).
Serum creatinine, serum aspartate aminotransferase (AST) and alanine aminotransferase (ALT) levels were assessed using validated automatic methods and equipment (Hitachi 717 analyser, Roche Diagnostics Inc., MA, USA). Serum total cholesterol (total-c), high-density lipoprotein cholesterol (HDL-c), low-density lipoprotein cholesterol (LDL-c) and triglycerides (TGs) were also analysed on the Hitachi 717 analyser using standard laboratory methods. Plasma glucose levels were measured using a glucose oxidase commercial kit (Sigma, St. Louis, MO, USA).
Several haematological variables were measured in EDTA-whole blood using an automatic Coulter Counter® (Beckman Coulter Inc., Foster City, CA, USA), i.e. a red blood cell (RBC) count, haematocrit, haemoglobin concentration, platelet and white blood cells (WBC) count.
The results are presented as the mean (SEM) and groups compared using a one-way ANOVA
and Fisher’s test, with significance indicated at P< 0.05.
RESULTS
All rats completed the 20 week protocol; the mean intake of food and fluids was not significantly different among the four groups. In the experimental study, sirolimus caused a marked inhibition of bladder tumour growth (Table 2). When compared with group 3, the mean number of tumours per rat, of 0.38 (0.18) vs 1.25 (0.35) and the mean number of tumours per rat with tumour, of 1.00 (0.0) vs 1.88 (0.35), were significantly lower in group 4. There was also a much lower tumour volume per tumour, of 0.30 (0.11) vs 66.1 (48.9) mm3
(P< 0.05) and fewer rats with tumour (three of eight vs eight of 12) in group 4, although in this case the difference was not
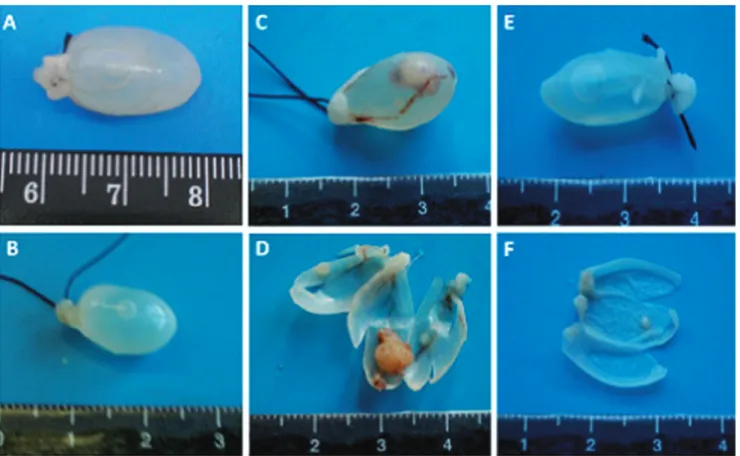
statistically significant. On gross inspection the bladder walls of rats in group 3 were thicker, more irregular, and with more blood vessels (Fig. 1).
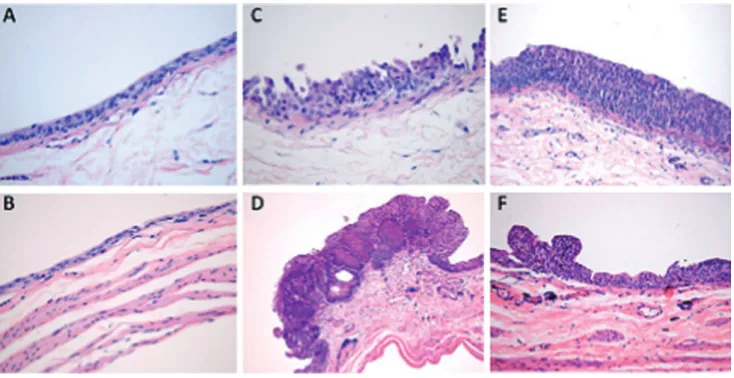
Histological examination (Fig. 2) confirmed the less aggressive histological changes in group 4 than in the group 3, with a marked reduction in hyperplasia (four of eight vs 12/12), high-grade dysplasia (four of eight vs 11/12) and urothelial tumour (Table 2). Rats in group 4 showed no infiltrative bladder cancers and had a lower incidence of high-grade tumours than those in group 3 (Table 2). No bladder from control groups 1 and 2 showed macroscopic or histological signs of tumour, with normal wall texture, thickness and vascularization (Figs 1,2). Rats in group 4 had lower serum levels of TGF-β1 (P< 0.05) but significantly higher levels of TNF-α (P< 0.01) than those in group 3 (Fig. 3). There were no differences in the inflammatory markers CRP and IL-1β. When compared with group 3, rats in group 4 also had a better TAS, of 572.6 (13.2) vs 523.5 (17.3) μmol/mL (P< 0.05), with less oxidative aggression, as shown by the lower values of serum MDA, of 0.413 (0.056) vs 0.465 (0.033) μmol/mL, and a better serum MDA/TAS ratio of 0.58 (0.04) vs 0.93 (0.04) × 10–3
(P< 0.001), a marker of more favourable redox status.
The increase in bladder Ki67 immunostaining in group 3 was clearly attenuated in group 4 (Fig. 4). Real time-PCR gene expression of caspase 3 showed that BBN caused a decreased expression in the bladder tissue and this reduction was significantly attenuated when the drug was used concomitantly in group 4 (Fig. 5).
The lipid profile showed that sirolimus caused hypercholesterolaemia and hypertriglyceridaemia in both the control
TABLE 1 Genes of interest and reference genes used in the present real-time quantitative PCR study
Symbol Gene name GenBank ID Primer pair origin
Amplicon length, bp
Casp3 Caspase 3 NM 012922 Rattus norvegicus QuantiTect® Primer Assay
QT01794429(Qiagen, Hilden, Germany)
115
Gapdh Glyceraldehyde phosphate
dehydrogenase
NM 017008 Rattus norvegicus geNorm Housekeeping Gene
Selection kit(PrimerDesign, Southampton, UK)
87
P A R A D A E T A L .
TABLE 2 Results for the macroscopic and histological findings
Mean (SEM) or n variable
Group 1, control
2, SIR control
3, BBN 4, sirolimus/BBN
Overall Tumour Overall Tumour
Macroscopic
% of tumours/group 0 0 8/12 3/8
Total no. of tumours 0 0 15 3
No. of tumours/rat 0 0 1.25 (0.35) 1.88 (0.35) 0.38 (0.18)* 1.00 (0.0)†
Tumour volume, mm3
Per rat with tumour 0 0 124.0 (90.4) 0.30 (0.11)
Per tumour 0 0 66.1 (48.9) 0.30 (0.11) Microscopy (histology) Pre-neoplastic lesions, % Hyperplasia 0 0 12/12 8/8 4/8* 2/3 High-grade dysplasia 0 0 11/12 8/8 4/8* 3/3 Urothelial tumour 0 0 8/12 3/8 Malignant lesions Papillary 0 0 12/15 3/3 Infiltrative 0 0 3/15 0/0 Tumour grade Low (G1) 0 0 7/15 2/3 High (G2/G3) 0 0 8/15 1/3 *P< 0.05, †P< 0.01 vs group 3.
FIG. 1. Macroscopic evaluation at the end of the 20 week-protocol: Bladders from control group 1 (A) and control group 2 (B) showed no macroscopic signs of tumour. Rats from group 3 had larger bladder tumours with increased vascularization (C,D), in clear contrast with rats from group 4 (E,F).
I N H I B I T I O N O F B L A D D E R T U M O U R B Y S I R O L I M U S
group 2 and group 4. Rats in these two groups also had changes in hepatic function, with elevated AST and a slightly higher creatinine value. No signs of mielotoxicity were
detected. Rats receiving sirolimus had a lower weight at the end of the protocol (Table 3). The lungs, liver, stomach and intestines were normal on gross inspection, and on
histological examination there were no signs of metastasis.
DISCUSSION
Bladder cancer is the fourth most common tumour in men and the eighth in women. It has a high prevalence, a poor prognosis if diagnosed late or treated inadequately, and a high socio-economic cost [1]. Bladder tumours are associated with exogenous risk factors, including cigarette smoking and occupational carcinogens, e.g. aromatic amines and polycyclic aromatic hydrocarbons [17–19]. Other exposures include chronic UTIs, cyclophosphamide use and radiotherapy. The burden of bladder cancer could be reduced by implementing several primary and secondary prevention strategies. Further to the elimination of known risk factors, this cancer could also be a good model for pharmacological prevention studies.
Urothelial TCC is present in >90% of the cases; the malignant transformation is a continuous process that includes proliferative epithelial abnormalities, preneoplastic changes and malignant lesions (carcinoma in
FIG. 2. Histological data (H&E, × 100) showed no tumour in controls (group 1) (A) or group 2 (B). In the group 3, high-grade dysplasia, with carcinoma in situ were more frequent (C) and bladder cancers were larger and more invasive (D) than in group 4, who had hyperplasia, low-grade dysplasia (E) and tumours that were more superficial, of lower grade and smaller (F).
FIG. 3. Serum markers of proliferation and inflammation: aaa, P < 0.001 vs control group; bb, P < 0.01 vs group 3. 500 450 400 350 300 250 200 Control μ g/ml SIR Control TGF-β1 BBN bb SIR/BBN 19 17 15 13 11 9 7 5 Control μ g/ml SIR Control TNF-α BBN bb SIR/BBN 140 120 100 80 60 40 20 0 Control μ g/ml SIR Control CRP BBN aaa SIR/BBN 140 120 100 80 60 40 20 0 Control μ g/ml SIR Control IL-1β BBN SIR/BBN
P A R A D A E T A L .
situ, papilloma and carcinoma) [1,20,21]. An
early treatment with drugs that reverse these molecular and morphological pathways could prevent bladder cancer. Pre-clinical studies using green tea polyphenols, soy products, vitamins, selenium and NSAIDs showed that bladder cancer is responsive to prevention strategies [3,22–24]. Our group has also shown the efficacy of selective cyclooxygenase-2 inhibition for bladder cancer chemoprevention in rats [22]. However, an efficient agent that could easily be given to high-risk patients has not been found.
Our experimental bladder carcinogen model in rats, induced using BBN 0.05% in drinking water over 8 weeks, was used previously, with similar tumour induction efficacy [22,24–26]. Oral administration of BBN produces bladder tumours analogous to those in humans, in a dose- and time-dependent manner. At week 8 the carcinogen was stopped and we started pharmacological treatment with sirolimus; to our knowledge, sirolimus has not been studied in animal models of bladder cancer. The anticarcinogenic potential of sirolimus is due to the blockade of mTOR, which
regulates essential transduction pathways and is involved in the coupling of growth stimuli with cell-cycle progression. Growth factor-growth factor receptor interactions affect the phosphorylation state of mTOR [27]. Blocking mTOR affects the function of the eukaryotic initiation factor 4E-binding protein-1 and decreases the activity of the 40S ribosomal protein S6 kinase, leading to arrest in the cell-cycle progression from G1 to S [6,28,29], thus reducing cell proliferation. Sirolimus also prevents cyclin-dependent kinase activation, inhibits retinoblastoma protein
FIG. 4. Immunostaining micrograph of Ki67 expression (the positivity is brown nuclear staining) in group 3 (BBN, A) and in group 4 (SIR/BBN, B). Avidin-biotin peroxidase method (original × 400).
FIG. 5. Relative bladder gene expression of caspase 3 for the groups under evaluation. aa, P < 0.01 vs control group; bb, P < 0.01 vs group 3 (BBN).
0.8 0.7 0.6 0.5 0.4 0.3 0.2 0.1 0.0 Control Rel a
tive gene expression (
a rbitr a ry u nit) SIR Control BBN aa Caspase 3 bb SIR/BBN
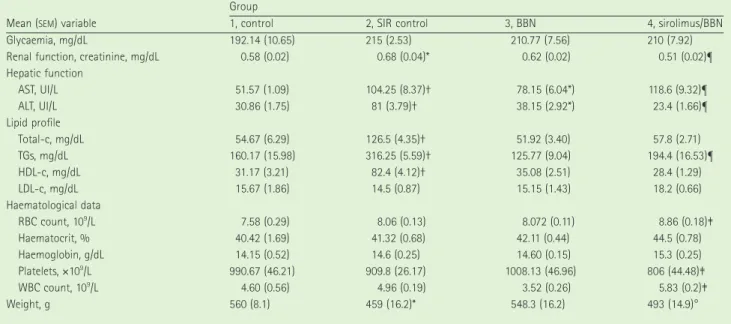
TABLE 3 Biochemical data and weight for the four groups at the end of the study (week 20)
Mean (SEM) variable
Group
1, control 2, SIR control 3, BBN 4, sirolimus/BBN
Glycaemia, mg/dL 192.14 (10.65) 215 (2.53) 210.77 (7.56) 210 (7.92)
Renal function, creatinine, mg/dL 0.58 (0.02) 0.68 (0.04)* 0.62 (0.02) 0.51 (0.02)¶
Hepatic function AST, UI/L 51.57 (1.09) 104.25 (8.37)† 78.15 (6.04*) 118.6 (9.32)¶ ALT, UI/L 30.86 (1.75) 81 (3.79)† 38.15 (2.92*) 23.4 (1.66)¶ Lipid profile Total-c, mg/dL 54.67 (6.29) 126.5 (4.35)† 51.92 (3.40) 57.8 (2.71) TGs, mg/dL 160.17 (15.98) 316.25 (5.59)† 125.77 (9.04) 194.4 (16.53)¶ HDL-c, mg/dL 31.17 (3.21) 82.4 (4.12)† 35.08 (2.51) 28.4 (1.29) LDL-c, mg/dL 15.67 (1.86) 14.5 (0.87) 15.15 (1.43) 18.2 (0.66) Haematological data RBC count, 109/L 7.58 (0.29) 8.06 (0.13) 8.072 (0.11) 8.86 (0.18)‡ Haematocrit, % 40.42 (1.69) 41.32 (0.68) 42.11 (0.44) 44.5 (0.78) Haemoglobin, g/dL 14.15 (0.52) 14.6 (0.25) 14.60 (0.15) 15.3 (0.25) Platelets, ×109/L 990.67 (46.21) 909.8 (26.17) 1008.13 (46.96) 806 (44.48)‡ WBC count, 109/L 4.60 (0.56) 4.96 (0.19) 3.52 (0.26) 5.83 (0.2)‡ Weight, g 560 (8.1) 459 (16.2)* 548.3 (16.2) 493 (14.9)°
I N H I B I T I O N O F B L A D D E R T U M O U R B Y S I R O L I M U S
phosphorylation and accelerates the turnover of cyclin D1.
The impressive antiproliferative activity of Sirolimus was reported in several preclinical studies, including cell-line cultures of human prostate, breast and small cell lung cancers, glioblastoma, melanoma and T-cell leukaemia, and in clinical studies [6,8–11,28,30]. Tensirolimus, another mTOR inhibitor, has been approved for clinical use in metastatic RCC, reinforcing the putative potential of these compounds as antineoplastic agents [31].
The mechanisms underlying the anticarcinogenic properties of sirolimus remain to be fully elucidated, but inhibition of cell proliferation appears to be the most important. Sirolimus could have a direct inhibitory effect on urothelial tumour cell proliferation, but also indirectly through reduction of endothelial cells and tumour angiogenesis. Increased tumour cell proliferation is a feature of bladder cancer and the disruption of mTOR pathways appears to be involved [32,33]. Numerous mutations of upstream regulators of mTOR signalling can lead to hyperactivation, resulting in uncontrolled cell growth [34]. All these arguments justified the pioneering use of sirolimus in an experimental model of bladder carcinogenesis.
In the present study, sirolimus had evident antiproliferative activity, causing fewer rats with tumour (three of eight vs eight of 12), together with significantly fewer tumours per rat and an even more impressive decrease in the tumour volume, with less aggressive histological changes, i.e. high-grade urothelial carcinoma; all the bladder tumours were TCC. Administration of sirolimus also tended to decrease the depth of invasion; tumours in group 4 rats were all superficial, while in group 3, 20% had deeper invasion, although limited to the lamina propria mucosa. In agreement with these data, the number and severity of pre-neoplastic lesions, hyperplasia and high-grade dysplasia were also reduced. These data show the ability of sirolimus to inhibit bladder tumour growth.
Increased production of TGF-β1 can occur in different tumour types and correlates with their severity. TGF-β1 can create a microenvironment that promotes tumour growth, invasion and metastasis [35,36]. In the present study, rats in group 4 had lower
levels of TGF-β1 and the inhibition of this signal-transduction pathway could potentially explain the decrease in tumour growth and aggressiveness by sirolimus. This effect was accompanied by reduced Ki67 bladder immunostaining, a validated marker of proliferation, particularly in the bladder cancer [12,37], thus reinforcing the antiproliferative properties of sirolimus. TNF-α is a multifunctional cytokine involved in apoptosis, cell survival, inflammation and immunity. It has a role in regulating the apoptosis/proliferation balance in tumour cells [38].The reason for the elevated value of TNF-α in group 4 is not clear, but it might reflect the effect of sirolimus in the life-death signalling regulation, causing a reduction of bladder tumour burden through activation of apoptotic pathways [39]. Caspase-3 is a key mediator of the apoptotic pathway. In the present study, sirolimus significantly attenuated the down-regulation of caspase 3 gene expression seen in rats in group 3, thus showing that the chemopreventive effect of sirolimus on bladder cancer growth involves mechanisms related to the restoration of the caspase 3 apoptosis pathway. Our results are in agreement with the role of caspase 3 reduction in bladder cancer development, and a role of caspase 3 activity for cancer prevention, as previously reported in other studies with other compounds [40–42]. Reactive oxygen species are capable of damaging DNA and other biomolecules, thus potentially promoting the development of malignancy [43]. Sirolimus also had a positive effect on redox status, with a higher antioxidant capacity, as shown by the higher serum TAS and favourable MDA/TAS index, contributing to its anticarcinogenic properties. There were no differences in the markers of inflammation.
In conclusion, in this experimental study, sirolimus given as an oral agent at 2 mg/kg/ day significantly inhibited rat bladder carcinogenesis, with minor adverse effects. Sirolimus reduced the number and volume of tumours, and induced less aggressive histological behaviour. This might be due to antiproliferative and antioxidant properties, together with a restoration of the caspase 3 apoptosis pathway. Although this was a preliminary study, the results are promising and justify further investigation, including other dosages, to validate the role of cancer chemoprevention strategies based on the
therapeutic use of mTOR inhibitors such as sirolimus.
CONFLICT OF INTEREST
None declared. Source of funding: Portuguese Association of Urology.
REFERENCES
1 Grasso M. Bladder cancer: a major public
health issue. Eur Urol 2008; (Suppl.)7: 510–5
2 Sylvester RJ, Van der Meijden AP, Oosterlinck W et al. Predicting
recurrence and progression in individual patients with stage TaT1 bladder cancer using EORTC risk tables a combined analysis of 2596 patients from seven EORTC trials. Eur Urol 2006; 49: 466–77
3 Leppert JT, Shvarts O, Kawaoka K et al.
Prevention of bladder cancer: a review.
Eur Urol 2006; 49: 226–34
4 Mota A. Sirolimus: a new option in
transplantation. Expert Opin
Pharmacother 2005; 6: 479–87
5 Seghal SN. Rapamune (RAPA, rapamycin,
sirolimus): mechanism of action effect results from blockade of signal transduction and inhibition of cell cycle progression. Clin Biochem 1998; 31: 335– 40
6 Hidalgo M, Rowinsky EK. The
rapamycin-sensitive signal transduction pathway as target for cancer therapy.
Oncogene 2000; 19: 6680–6
7 Rowinsky EK, Sabers SJ, Brunn GJ, Martin MM, Dumont FJ, Abraham RT.
Mechanism of action of rapamycin: new insights into the regulation of G1-phase progression in eukariotic cells. Progn Cell
Cycle Res 1995; 1: 53–71
8 Cloughesy TF, Yoshimoto K, Ngiemphu P, Brown K et al. Antitumor activity of
rapamycin in a Phase I trial for patients with recurrent PTEN-deficient
glioblastoma. PloS Med 2008; 5: 139– 51
9 Wan X, Helman L. The biology behind
mTOR inhibition in Sarcoma. Oncologist 2007; 12: 1007–18
10 Dowling RJ, Zakikhani M, Fantus IG, Pollak M, Sonenberg N. Metformin
inhibits mammalian target of rapamycin-dependent translation initiation in breast cancer cells. Cancer Res 2007; 67: 10804– 12
P A R A D A E T A L .
11 Buck E, Eyzaguirre A, Brown E et al.
Rapamycin synergizes with the epidermal growth factor receptor inhibitor erlotinib in non small-cell lung, pancreatic, colon and breast tumors. Mol Cancer Ther 2006;
5: 2676–84
12 El-kott AF. Flow cytometry and KI67
expression in rat’s urinary bladder carcinogenesis treated with Allium
Sativum. Cancer Ther 2007; 5: 185–
92
13 Vandesompele J, De Preter K, Pattyn
F et al. Accurate normalization of
real-time quantitative RT-PCR data by geometric averaging of multiple internal control genes. Genome Biol 2002; 3: 34
14 Livak KJ, Schmittgen TD. Analysis
of relative gene expression data using real-time quantitative PCR and the2- ΔΔCT method. Methods 2001; 25: 402– 8
15 Estepa V, Ródenas S, Martín MC.
Optimización de un método para la determinación de la peroxidación lipídica en suero humano. Anal Real Acad Farm 2001; 67: 1–17
16 Benzie IFF, Strain JJ. The ferric reducing
ability of plasma (FRAP) as a measure of ‘antioxidant power’. The FRAP assay. Anal
Biochem 1996; 239: 70–6
17 Kirkali Z, Chan T, Murugesan M et al.
Bladder cancer: epidemiology, staging, grading and diagnosis. Urology 2005; 66 (Suppl. 6A): 4–34
18 Zeegers MP, Tan FE, Dorant E, van Den Brandt PA. The impact of characteristics
of cigarette smoking on urinary tract cancer risk: a meta-analysis of epidemiologic studies. Cancer 2000; 66: 4–34
19 Kogevinas M, t’Mannetje A, Cordier
S et al. Occupation and bladder
cancer among men in Western Europe.
Cancer Causes Control 2003; 14: 907–
14
20 Sauter G, Algaba F, Amin M et al. WHO Classification of Classification of Tumors of the Urinary System and Male Genital Organs. Lyon: IARCC Press, 2004: 29–
34
21 Montironi R, Mazzucchelli R.
Preneoplastic lesions and conditions of the urinary bladder. EAU Update Ser 2003;
I: 53–63
22 Hattori K, Iida K, Joraku A, Tsukamoto S, Akaza H, Oyasu R. Chemopreventive
effects of cyclooxygenase-2 inhibitor and epidermal growth factor-receptor kinase
inhibitor on rat urinary bladder carcinogenesis. BJU Int 2006; 97: 640– 3
23 Kemberling JK, Hampton JA, Keck RW, Gomez MA, Selman SH. Inhibition of
bladder tumor growth by the green tea derivative epigallocatechin-3-gallate.
J Urol 2003; 170: 773–6
24 Sato D, Matsushima M. Preventive
effects of urinary bladder tumors induced by N-butyl-N-(4-hydroxybutyl)-nitrosamine in rat by green tea leaves. Int
J Urol 2003; 10: 160–6
25 Parada B, Sereno J, Reis F et al.
Anti-inflammatory, anti-proliferative and antioxidant profiles of selective cyclooxygenase-2 inhibition as chemoprevention for rat bladder carcinogenesis. Cancer Biol Ther 2009; 8: 1615–22
26 Ito N, Arai M, Sugihahara S et al.
Experimental urinary bladder tumors induced by N-butyl-N-(4-hydroxybutyl) nitrosamine. Gann Monogr 1975; 17: 367–81
27 Downward J. Mechanisms and
consequences of activation of protein kinase B/Akt. Curr Opin Cell Biol 1998; 10: 262–7
28 Yu K, Toral-Barza L, Discafani C et al.
MTOR, a novel target in breast cancer. the effect of CCI-779, an mTOR inhibitor, in preclinical models of breast cancer.
Endocrine Related Cancer 2001; 8: 249–
58
29 Fingar DC, Richardson CJ, Tee AR et al.
MTOR controls cell cycle progression through its cell growth effectors S6K1 and 4E-BP1/Eukaryotic translation initiation factor 4E. Mol Cell Biol 2004;
24: 200–16
30 Dutcher JP. Mammalian target of
rapamycin inhibition. Clin Cancer Res
Supplement 2004; 10: 6387s
31 Michael B Atkins, Hidalgo M et al.
Randomized phase II study of multiple dose levels of CCI-779, a novel mammalian target of rapamycin kinase inhibitor, in patients with advanced refractory renal cell carcinoma. J Clin
Oncol 2004; 22: 909–18
32 Sabatini DM. mTOR and cancer: insights
into a complex relatioship. Nat Rev Cancer 2006; 6: 729–34
33 Garcia JA, Danielpour D. Mammalian
target of rapamycin inhibition as a therapeutic strategy in the management of urologic malignancies. Mol Cancer Ther 2008; 7: 1347–54
34 Faivre S, Kroemer G, Raymond E.
Current development of mTOR inhibitors as anticancer agents. Nat Rev Drug Discov 2006; 5: 671–88
35 Dumont N, Arteaga CL. The tumor
microenvironment. a potential arbitrator of the suppressive and promoting actions of TGF-β. Differentiation 2002; 70: 574– 82
36 Leivonen SK, Kähäri VM. Transforming
growth factor-β signaling cancer invasion and metastasis. Int J Cancer 2007; 121: 2119–24
37 Margulis V, Shariat SF, Ashfaq R, Sagalowsky AI, Lotan Y. Ki-67 is
an independent predictor of bladder cancer outcome in patients treated with radical cystectomy for organ-confined disease. Clin Cancer Res 2006; 12: 7369– 73
38 Horssen R, Ten Hagen TL, Eggermont AM. TNF-α in cancer treatment.
Molecular insights, antitumor effects and clinical utility. Oncologist 2006; 11: 397– 408
39 Rath PC, Aggarwal BB. TNF-induced
signaling in apoptosis. J Clin Immunol 1999; 19: 350–64
40 Wang YB, Qin J, Zheng XY, Bai Y, Yang K, Xie LP. Diallyl trisulfide induces Bcl-2
and caspase-3-dependent apoptosis via downregulation of Akt phosphorylation in human T24 bladder cancer cells.
Phytomedicine 2010; 17: 363–8
41 Yuan SF, Chang HL, Chen HW et al.
Selective cytotoxicity of squamocin on T24 bladder cancer cells at the S-phase via a Bax-, Bad-, and caspase-3-related pathways. Life Sci 2006; 78: 869–74
42 Yeh CC, Kuo HM, Li TM et al.
Shikonin-induced apoptosis involves caspase-3 activity in a human bladder cancer cell line (T24). In Vivo 2007; 21: 1011–9
43 Halliwell B. Oxidative stress and cancer:
have we moved forward? Biochem J 2007;
401: 1–11
Correspondence: Frederico Teixeira, Institute
of Pharmacology and Experimental Therapeutics, IBILI, Medicine Faculty, Sub-Unit 1 (Polo III), Coimbra University, 3000-354 Coimbra, Portugal.
e-mail: [email protected] or
Belmiro Parada, Department of Urology & Renal Transplantation, Coimbra University Hospital, Praceta Mota Pinto, 3000 Coimbra, Portugal.
I N H I B I T I O N O F B L A D D E R T U M O U R B Y S I R O L I M U S
Abbreviations: mTOR, mammalian target of
rapamycin; BBN, N-butyl-N-(4-hydroxybutyl) nitrosamine; H&E, haematoxylin and eosin;
IL-1ββββ, interleukin-1β; CRP, C-reactive
protein; MDA, malondialdehyde; FRAP, ferric reducing antioxidant potential; AST, aspartate aminotransferase; ALT, alanine aminotransferase; total-c, total cholesterol;
HDL-c, high-density lipoprotein cholesterol; LDL-c, low-density lipoprotein cholesterol; TG, triglyceride; (W)(R)BC, (white) (red) blood