ISSN: 1579-4377
ANALYSIS OF THE DRYING KINETICS OF S. BARTOLOMEU PEARS
FOR
DIFFERENT DRYING SYSTEMS
RAQUEL P. F. GUINÉ
Departamento de Indústrias Alimentares, Escola Superior Agrária de Viseu, Instituto Politécnico de Viseu, Quinta da Alagoa, Estrada de Nelas, Ranhados, 3500-606 Viseu, Portugal
ABSTRACT
Pears of the variety S. Bartolomeu (Pyrus communis L.) are used in Portugal to produce a traditional food product, obtained by open-air sun drying. The traditional processing has many disadvantages, namely the efficiency and the sanitary quality of the final product. For these reasons, attempts were made to study alternative production methodologies, including the use of a solar stove, a solar drier and a drying tunnel.
In this work pears of the variety S. Bartolomeu, were dried in the three alternative systems mentioned, and their drying kinetics was studied. Eight different models from literature were tested and their performance was evaluated in terms of some statistical indicators.
The results allowed concluding that the models Henderson & Pabis, Logarithmic and Vega-Lemus were the best to fit the experimental data. Furthermore, it was concluded that the solar drying was very dependent on the weather conditions. It was also possible to observe that the loss of water was much more uniform in the drying tunnel system when compared to the solar dryings, because in the tunnel the operating temperature and air velocity were constant.
KEYWORDS
INTRODUCTION
Drying assumes a pivotal role in the food processing industries [1], and is one of the most widely used methods for preserving foods [2], which allows extending their shelf life by removing the water to a level that minimizes the deterioration phenomena due to microorganisms, enzymes or ferments [3-6]. Besides preservation, other advantages of drying include lighter weight for transportation and smaller space needed for storage, as well as avoiding the need of expensive refrigeration systems, with obvious economic benefits [2,6].
Open-air sun drying has been used since immemorial times to dry grains, vegetables, fruits and other agricultural products. This is a common method used to preserve foods and it is practiced until today in many countries where the combination of solar radiation, temperature and relative humidity is appropriate. However, despite being a cheap method, the open-air natural sun drying is not always applicable to large-scale production [7]. Furthermore, the product quality can be quite affected, since the foods are exposed to many potentially contaminating agents, such as dust or animals, or even deteriorating factors like adverse weather conditions, such as rain or night moist [8,9].
In Portugal pears of the variety S. Bartolomeu (Pyrus communis L.) are dried using a traditional sun drying method, which is based on an open-air exposure [10-11]. Notwithstanding being quite a cheap drying method, making use of the sun as energy source, it has some very important disadvantages, like for example: (1) the process is slow and very much dependent on weather conditions, and (2) the quality of the product is not satisfactorily taking into account factors such as pollution from dust or from animal contamination or other types of infestation and microbial or mould contamination in humid environments [12]. Therefore, alternative drying methods have been tested to dry these pears, namely using a solar stove, a solar drier and a drying tunnel with air heated through a solar collector. These allow conciliating cheapness with the improvement in quality by protecting the fruits against external dangers.
Drying is a complex thermal process during which many structural and physicochemical changes take place inside the foods [6]. The analysis of the drying processes allows their understanding and ultimately the establishment of appropriate operating conditions [13-14]. In engineering terms, this is achieved by mathematical modelling [15-17]. Many mathematical models have been proposed to describe drying process, from diffusion to thin-layer models, which can be grouped into theoretical, semi-theoretical, and empirical [2]. The present work aimed at determining the drying kinetics of the S. Bartolomeu pears, as described by empirical models from literature, for dryings performed in three alternative drying systems: a solar stove, a solar drier and a drying tunnel, along a three years period of study.
MATERIALS AND METHODS
The pears used in the present study are of the Portuguese variety S. Bartolomeu and were dried uncut, after peeling, like it is done in the traditional processing. However, unlike in the traditional drying, the pears were not openly exposed to the sun, and, alternatively, were dried in three different systems, place in three different institutions: a solar stove in ESAV1
(ESAVss), a solar drier in ESTV2 (ESTVsd) and a drying tunnel in UC3, with air heated by a solar collector (UCdt).
The ESAV solar stove (ESAss) is like a greenhouse with a structure of aluminium completely enclosed in 3 mm greenhouse glass The length is 3.2 m, the with is 1.9 m and the
height is 2 m in the centre and 1.3 m at the sides. The ventilator was operated at a rotating speed of 1700 r.p.m., corresponding to the extraction of 900 m3/h of air [5]. The system was equipped a thremohygrometer, to measure the temperature and relative humidity every 10 minutes, with register of medium values at hourly intervals. The pears were placed inside the solar stove over nylon nets, in a wood structure.
The ESTV solar dryer (ESTVsd) was developed specifically for the drying of pears, and is made of glass with different levels, in a stepwise configuration, designed for a more efficient use of the solar energy. The solar dryer promotes the natural ventilation from an entry in the bottom to an opening in the top. The system is equipped with various thermocouples, anemometers and other online data acquisition systems, like for mass and solar radiation.
The air passing through the UC drying tunnel (UCdt) is heated by an efficient design of a low-cost solar collector. The tunnel dryer has a net dimension of 40 × 60cm and is equipped with two trays of polyethylene and a scale to measure continuously the weight of the batch of pears.
In the ESAVss and ESTVsd systems, the temperature and relative humidity were variable according to the hour of the day and the weather conditions. In the UCdt system, the temperature was kept constant around 41 ºC and the drying air velocity was 1.1 m/s. The drying was carried out until the pears reached the desirable moisture content of about 20 % (wet basis) [8]. However, in some cases the final moisture was under this reference because when the samples were analyzed their moisture had already lowered under the optimum value.
Along drying the moisture content of the pears was determined by sampling in the ESAVss and ESTVsd systems, being measured with a Halogen Moisture Analyser, model HG53, from Mettler Toledo. In the UCdt system the moisture was determined by weight loss, measured by weighing the whole set of pears along drying.
MATHEMATICAL MODELING
Simulation models help designing new drying systems as well as improving the existing ones. Furthermore, they are important for the control of drying operations. In the drying kinetics of food products, the drying constant, K, is normally used. This parameter combines all the transport properties and may be defined by the thin layer equation [7].
Thin layer equations describe the drying phenomena in a unified way, regardless of of the controlling mechanism, and have been used to estimate drying times and access the drying curves for many agricultural and food products. A wide variety of thin layer equations is available in the literature, varying widely in nature, but having in common the capacity of describing successfully many drying processes [7,18].
In the present experiments, the drying kinetics was monitored in terms of variation of the pears moisture content along drying, and the data was then expressed in terms of the dimensionless variable moisture ratio, defined as:
e e W W W W MR − − = 0 (1)
where W is the moisture content at time t, W0 is the initial moisture content and We is the
equilibrium moisture content, all expressed in dry basis. To model the drying kinetics the experimental points (MR,t) were fitted to different empirical kinetic models from literature cited by Baini & Langrish [13] and presented in Table 1. The fittings were obtained with software SigmaPlot V8.0 (SPSS, Inc.)
To evaluate the most appropriate model to describe the drying behavior of the S. Bartolomeu pears, some statistical indicators were used. One of the primary criteria for
selecting the best equation was the correlation coefficient (R), followed by the reduced chi-square (c2) and the root mean square error (RMSE), expressed by the following equations [7,19]: n N MR MR N i i prev i − − =
∑
=1 2 , exp, 2 ) ( χ (2)∑
= − = N i i prev i MR MR N RMSE 1 2 , exp, ) ( 1 (3)where MRexp,i is the moisture content observed experimentally for instant i, MRprev,i is the predicted moisture content for the same instant, N represents the number of observations and
n stands for the number of parameters in the model.
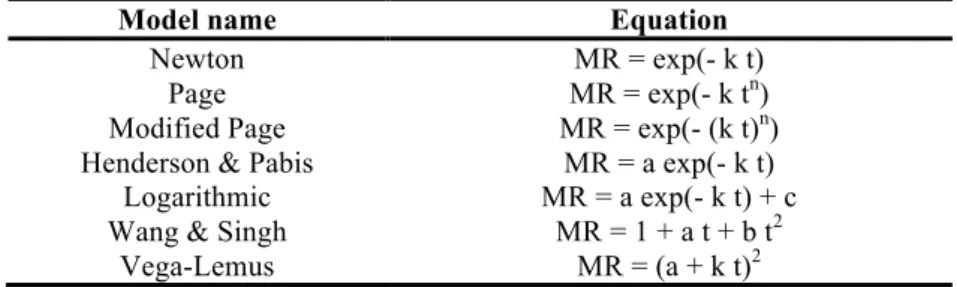
Table 1 – Empirical models used to represent the drying kinetics (Baini & Langrish, 2007).
Model name Equation
Newton MR = exp(- k t)
Page MR = exp(- k tn)
Modified Page MR = exp(- (k t)n) Henderson & Pabis MR = a exp(- k t)
Logarithmic MR = a exp(- k t) + c Wang & Singh MR = 1 + a t + b t2
Vega-Lemus MR = (a + k t)2
Table 1 – Empirical models used to represent the drying kinetics (Baini & Langrish, 2007).
The c2 is the mean square of the deviations between the experimental values and those
predicted by the model, while RMSE provides information on the short-term performance of the correlations by allowing a term by term comparison of the actual deviation between the calculated value and the measured value. The performance of each model was evaluated according to the higher values of R, and lower values of c2 and RMSE.
RESULTS AND DISCUSSION
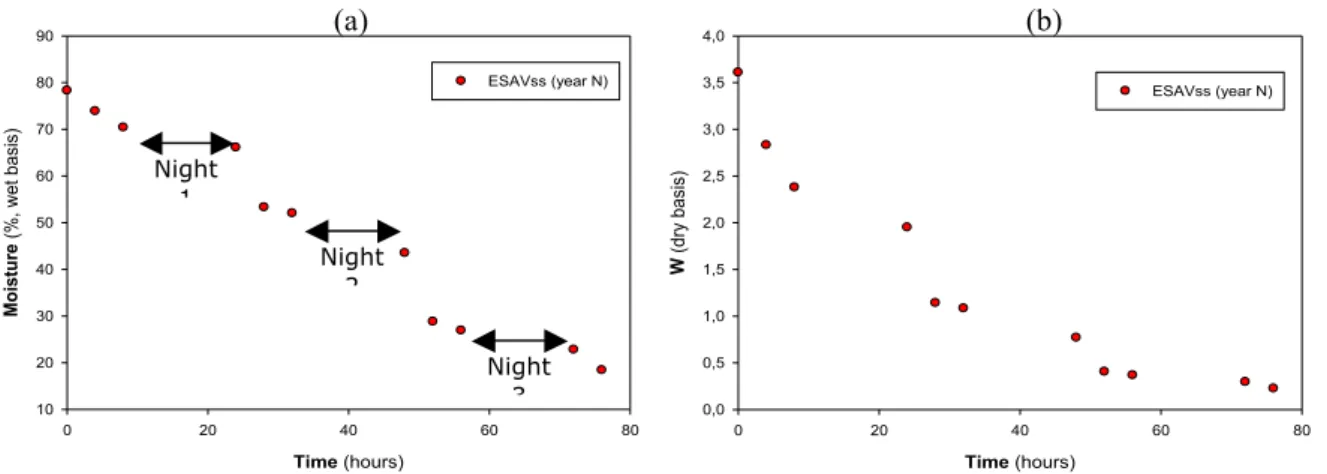
Figure 1 shows the variation of the moisture content of the pears for the drying performed in the ESAV solar stove in the first year of study (year N). The drying lasted approximately 80 hours, and some variability that is observed in the moisture data was mainly due to the influence of the atmospheric conditions, since in the night periods the drying is slowed or interrupted, and it is more intense in the hottest hours of the day. Furthermore, some heterogeneity in the size of the pears could also have some influence, since, like any natural product, the fresh pears were not all of the exact same size, and therefore, when the samples were removed for analysis, some variability could also be introduced.
Fig. 1 – Variation of the moisture content along drying for the ESAV solar stove in year N: (a) wet basis moisture content, (b) dry basis moisture content.
Table 2 – Fittings with different models to the experimental data for the drying in ESAVss in year N.
Model Parameters Values Statistics Values
Newton k (±sd)* 0.0425(±0.0033) R 0.9818 c2 0.0042 (-) RMSE 0.0615 Page k (±sd) 0.0534(±0.0217) R 0.9823 n (±sd) 0.9334(±0.1184) c2 0.0045 RMSE 0.0606 Henderson a (±sd) 0.9605(±0.0486) R 0.9830 (+) & Pabis k (±sd) 0.0407(±0.0040) c2 0.0043 RMSE 0.0594 (--) Logarithmic a (±sd) 1.0241(±0.0825) R 0.9852 (+) k (±sd) 0.0330(±0.0075) c2 0.0042 (-) c (±sd) -0.0813(±0.0865) RMSE 0.0555 (--) Wang a (±sd) -0.0297(±0.0021) R 0.9768 & Singh b (±sd) 0.0002(±0.0000) c2 0.0059 RMSE 0.0694 Vega- a (±sd) 0.9551(±0.0255) R 0.9836 (+) Lemus k (±sd) -0.0131(±0.0011) c2 0.0042 (-) RMSE 0.0584 (--)
*sd is the standard deviation.
(+) Higher values of R; (-) Smaller values of c2; (--) Smaller values of RMSE.
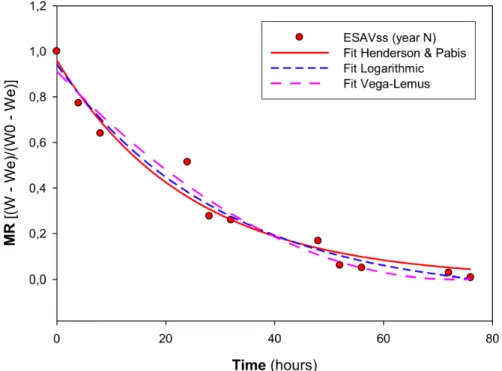
Table 2 shows the results of the fittings with the models in Table 1, when applied to the experimental data of the moisture ratio for the drying carried out in the ESAV solar stove in year N. The results reveal that all the models tested are good enough to describe the drying kinetics of the pears in this experiment, with the lowest value of the regression coefficient equal to 0.9768. However, some models are slightly better than others, as can be seen by the values of R, c2 and RMSE. The models that have the higher values of R are Henderson & Pabis, Logarithmic and Vega-Lemus. The models that show the lowest values of c2 are Newton, Logarithmic and Vega-Lemus, and the models with the lowest RMSE are once again Henderson & Pabis, Logarithmic and Vega-Lemus. From these results, it can be somehow concluded that the best models were Henderson & Pabis, Logarithmic and Vega-Lemus. The fittings with these three models selected as the best to describe the drying kinetics of the S. Bartolomeu pears are shown in Fig. 2, for the same experimental data
Time (hours) 0 20 40 60 80 Moi sture (% , wet basis) 10 20 30 40 50 60 70 80 90 ESAVss (year N) Time (hours) 0 20 40 60 80 W (dr y bas is) 0,0 0,5 1,0 1,5 2,0 2,5 3,0 3,5 4,0 ESAVss (year N) (a) (b) Night 1 Night 2 Night 3
(ESASss in year N). The graph shows that, despite the differences in the configurations of the drying curves, the three predicted curves are very close to the experimental data points, confirming the previous assumption that these three models were good to describe the drying kinetics in the present case.
Fig. 2 – Fittings with the best models to the experimental data in the drying of ESAV solar stove in year N.
Fig. 3 –Fittings with model Henderson & Pabis to the experimental data in the drying of ESAV solar stove in the three years: N, N+1 and N+2.
Fig. 4 –Fittings with model Logarithmic to the experimental data in the drying of ESAV solar stove in the three years: N, N+1 and N+2.
Fig. 5 –Fittings with model Vega-Lemus to the experimental data in the drying of ESAV solar stove in the three years: N, N+1 and N+2.
Figures 3, 4 and 5 show the fittings with models Henderson & Pabis, Logarithmic and Vega-Lemus, respectively, to the experimental data for the drying in the ESAV solar stove, but corresponding to the three years of study. The results of the fittings for years N+1 and N+2, are presented in Table 3. The results for year N were already presented in Table 2, and therefore were not included in Table 3. Considering the three years of study, it can be seen that model Henderson & Pabis is slightly less good (Fig. 3) then the other two models (Fig.s 4 and 5). As to the drying rates, it was observed that in year N the drying was completed after about 80 h, in year N+1 after about 150 h and in year N+2 after about 100 h. These differences are due to the influence of the climatic conditions, which were different in the different summers considered. Thus, in year N+1 the drying required almost as twice the time as in year N, confirming the unpredictability of the drying conditions in the solar stove system.
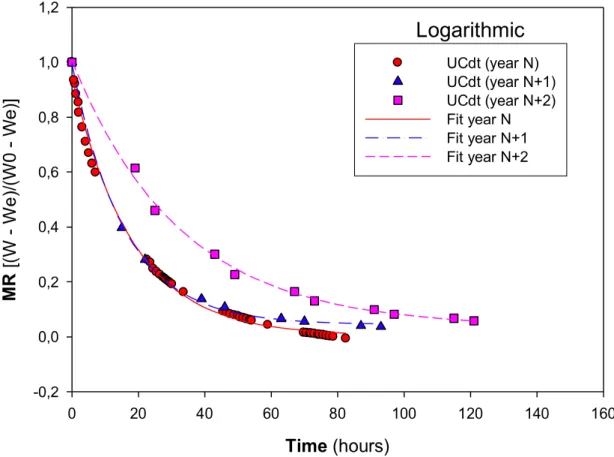
Fig. 6 – Fittings with model Logarithmic to the experimental data in the drying of UC drying tunnel in the three years: N, N+1 and N+2
Figure 6 represents the experimental data for the dryings carried out in the UC drying tunnel in the three years of study, together with the fittings obtained with model logarithmic, which results are in Table 4. It is visible from the graph and from the values of the regression coefficient in Table 4, that the performance of this model is quite good also for this drying system. Furthermore, the experimental data follows in every year a very definite trend, with much less variations, when compared to the ESAVss drying system. This is expected, since in the solar drying the variability of the weather conditions induces a non uniform loss of water, whereas in the drying tunnel, that water loss in continuous.
Table 4 – Fittings with model Logarithmic to the experimental data for the drying in UCdt in the three years of study.
Parameters Year N Year N+1 Year N+2
a (±sd) 0.9434(±0.0088) 0.9514(±0.0120) 0.9725(±0.0200) k (±sd) 0.0552(±0.0015) 0.0637(±0.0019) 0.0308(±0.0016) c (±sd) 0.0032(±0.0006) 0.0454(±0.0058) 0.0347(±0.0036)
R 0.9980 0.9995 0.9983
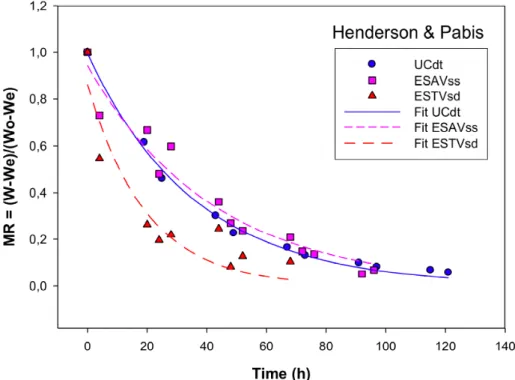
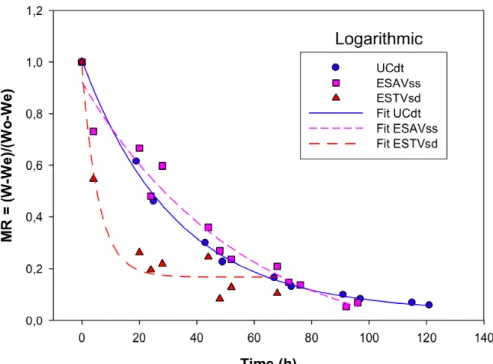
Figures 7 to 9 show the fittings with models Henderson & Pabis, Logarithmic and Vega-Lemus, respectively, to the experimental data for the three drying systems in the last year of study (year N+2). The results of the fittings are presented in Table 5. It can be seen, either from the graphs or the table, that the best model to describe the drying kinetics for these three different drying systems is model Logarithmic, presenting the higher values of the correlation coefficient. When the three drying systems are compared, one can observe that the best fits are obtained for the data in the UCdt system, followed by the ESAVss system and finally the ESTVsd system, with the lowest values of R. Furthermore, The ESAVss and UCdt systems present very similar drying patterns in this year, while the ESTVsd system is a little different, although faster, with a drying time of only 68 h against 96 h in the ESAVss and 121 h in the UCdt.
Fig. 7 – Fittings with model Henderson & Pabis to the experimental data for the year N+2, in the three drying systems.
Fig. 8 – Fittings with model Logarithmic to the experimental data for the year N+2, in the three drying systems.
Fig. 9 – Fittings with model Vega-Lemus to the experimental data for the year N+2, in the three drying systems.
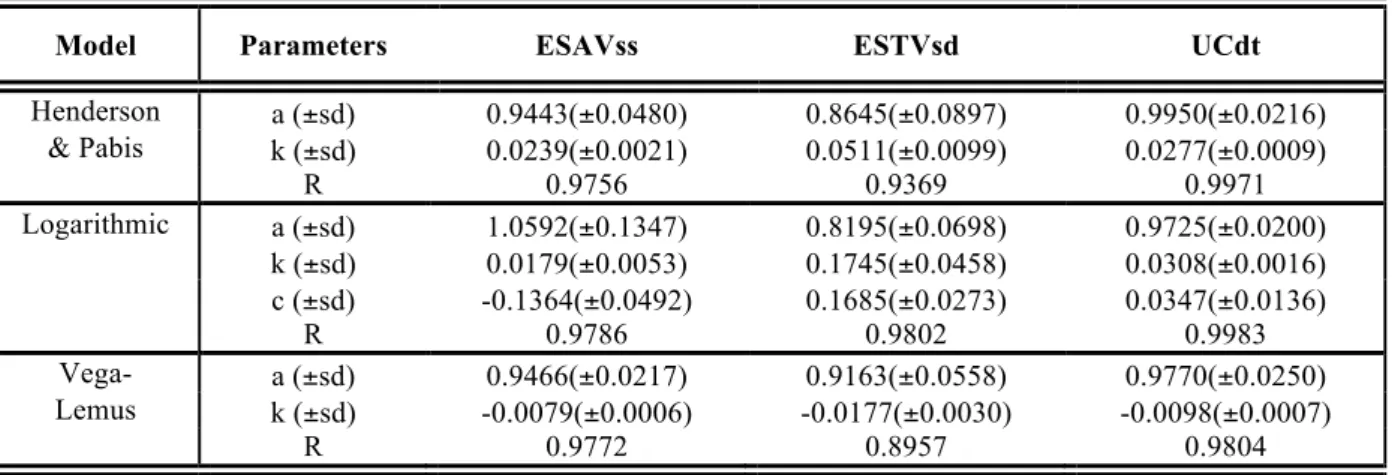
Table 5 – Fittings with the three best models to the experimental data for the drying in year N+2, in the three drying systems.
Model Parameters ESAVss ESTVsd UCdt
Henderson a (±sd) 0.9443(±0.0480) 0.8645(±0.0897) 0.9950(±0.0216) & Pabis k (±sd) 0.0239(±0.0021) 0.0511(±0.0099) 0.0277(±0.0009) R 0.9756 0.9369 0.9971 Logarithmic a (±sd) 1.0592(±0.1347) 0.8195(±0.0698) 0.9725(±0.0200) k (±sd) 0.0179(±0.0053) 0.1745(±0.0458) 0.0308(±0.0016) c (±sd) -0.1364(±0.0492) 0.1685(±0.0273) 0.0347(±0.0136) R 0.9786 0.9802 0.9983 Vega- a (±sd) 0.9466(±0.0217) 0.9163(±0.0558) 0.9770(±0.0250) Lemus k (±sd) -0.0079(±0.0006) -0.0177(±0.0030) -0.0098(±0.0007) R 0.9772 0.8957 0.9804 CONCLUSIONS
From the results obtained was possible to conclude that all the models tested could be successfully applied to the drying of the S. Bartolomeu pears. However, the models Henderson & Pabis, Logarithmic and Vega-Lemus, were the three that revealed to be better, base on the criteria: higher values of the regression coefficient and lower values of c2 and RMSE.
With respect to the dryings carried out in the ESAV solar stove in the three years, it was observed that in year N the drying rate was higher, lasting about 80 h, whereas in year N+1 and year N+2 the drying times were 150 h and 100 h, respectively, being these differences due to the different climatic conditions. As to the dryings performed in the drying tunnel, the moisture loss is much more uniform, due to the constant operating conditions.
When comparing the different drying systems, it was concluded that the ESAVss and UCdt systems presented very similar drying curves, while the ESTVsd system was a little faster. With relation to the fittings, it was concluded that model Logarithmic was the best to describe all the situations analyzed.
ACKNOWLEDGEMENT
The authors thank the FCT for financial support through project PTDC/AGR-ALI/74587/2006.
REFERENCES
[1]. K. M. Krokida, V. T. Karathanos, Z. B. Maroulis. Journal of Food Engineering 59, 391-403 (2003).
[2]. I. Doymaz. Journal of Food Engineering 79, 243-248 (2007). [3]. I. Alibas. LWT 40, 1445-1451 (2007).
[4]. D. Dutta, A. Dutta, U. Raychaudhuri, R. Chakraborty. Journal of Food Engineering 76, 538-546 (2006).
[5]. R. P. F. Guiné, D. M. S. Ferreira, M. J. Barroca, F. M. Gonçalves. International Journal of Fruit Science 7, 101-118 (2007).
[6]. K. Sacilik. Journal of Food Engineering 79, 23-30 (2007).
[7]. I. Togrul, D. Pehlivan. Journal of Food Engineering 58, 23-32 (2003). [8]. R. P. F. Guiné, J. A. A. M. Castro. Drying Technology 21, 581-591 (2003). [9]. R. P. F. Guiné. Food and Bioproducts Processing 84, 179-185 (2006).
[10]. M. J. Barroca, R. P. F. Guiné, A. Pinto, F. M. Gonçalves, D. M. S. Ferreira. Food and Bioproducts Processing 84, 109-113 (2006).
[11]. R. P. F. Guiné RPF. Food and Bioproducts Processing, 83, 273-276 (2005). [12]. V. T. Karathanos, V. G. Belessiotis. Journal of Food Engineering 31, 35-46 (1997). [13]. R. Baini, T. A. G. Langrish. Journal of Food Engineering 79, 330-343 (2007). [14]. A. Fadhel, S. Kooli, A. Farhat, A. Bellghith. Desalination 185, 535-541 (2005).
[15]. C. H. Chong, C. L. Law, M. Cloke, C. L. Hii, L. C. Abdullah, W. R. W. Daud. Journal of Food Engineering 88, 522-527 (2008).
[16]. S. Lahsasni, M. Kouhila, M. Mahrouz, J. T. Jaouhari. Journal of Food Engineering 61, 173-179 (2004).
[17]. J. S. Roberts, D. R. Kidd, O. Padilla-Zakour. Journal of Food Engineering 89 (4), 460-465 (2008).
[18]. N. Boudhrioua, M. Kouhila, N. Kechaou. Food and Bioproducts Processing 86(3), 176-184 (2008).