T
HE
I
NFLUENCE OF THE
G
RAPE
V
ARIETY ON THE
P
RODUCTION OF
V
OLATILE
P
HENOLS IN
P
ORTUGUESE
W
INES
Master Thesis presented to Escola Superior de Biotecnologia of the
Universidade Católica Portuguesa as part of the European Master of
Science Degree in Food Science, Technology and Nutrition
By Sophie Weiss
Under the supervision of Francisco Campos and José António Couto
ABSTRACT
The main purpose of this work is to determine whether there is a correlation between the susceptibility to volatile phenol production of wines and grape variety. Therefore, 11 single varietal red wines from Portugal were heat sterilized, contaminated with Dekkera bruxellensis PYCC 4801 and incubated for at least 10 days at 30°C. Since yeasts did not grow in pure wines due to inhibition by ethanol, the experiments were conducted in diluted samples with similar initial pH and ethanol levels. Yeast growth was monitored and produced levels of 4-ethylguaiacol, 4-ethylphenol and 4-vinylphenol were measured using gas chromatography in order to compare values between varieties.
This approach led to the production of ethylphenol and ethylguaiacol in all samples; 4-vinylphenol however, could not be detected in any sample. All values reached or exceeded perception threshold levels established in literature. This suggests that all examined wines are at risk of developing phenolic off-flavour once contaminated with Brettanomyces/Dekkera yeasts, especially considering that samples were diluted and thus contained lower amounts of precursors than are potentially present in pure wines.
4-ethylguaiacol values were generally lower and varied less between samples and varieties compared to 4-ethylphenol. Tinta Roriz and Touriga Franca showed the highest potential in regard to volatile phenol production from the natural precursors available in the wines while Sousão wines appeared to be the least prone and Touriga Nacional wines exhibited intermediate volatile phenol values. Furthermore, 4-ethylphenol:4-ethylguaiacol ratios were calculated and show differences between and similarities within varieties.
An attempt was made to estimate the precursor quantities originally present in the wines by comparing the results of spiked and unspiked wines but the obtained results were inconclusive.
From the results it can be suggested that the grape variety may have an influence on the production of volatile phenols by predetermining the availability of precursors. However, several other factors including vinification and wine aging methods may have an impact on the production of volatile phenols.
ACKNOWLEDGEMENTS
Foremost, I would like to thank Escola Superior de Biotecnologia da Universidade Católica Portuguesa (ESBUCP) for accepting me for this Master's thesis project and providing all the instrumental support necessary for conducting the research.
In particular, I would like to express my great appreciation to my supervisors Francisco Campos and José Antonio Couto for the continuous support at all times , motivation and help throughout the project.
I would also like to thank the winemakers from the Douro and Alentejo region who have provided me with samples for the work.
Finally, I would like to dedicate this project to my parents who have been supporting me throughout my studies and all the friends I have made during this master program.
ABBREVIATIONS
CFU Colony Forming Units FID Flame Ionisation Detector HCA Hydroxycinnamic Acids LAB Lactic Acid Bacteria log Logarithm to the base 10 PAD Phenolic Acid Decarboxylase S1-S4 Sousão SY Syrah TF Touriga Franca TN1-TN4 Touriga Nacional TR Tinta Roriz v Volume 4EC 4-Ethylcatechol 4EG 4-Ethylguaiacol 4EP 4-Ethylphenol 4VC 4-Vinylcatechol 4VG 4-Vinylguaiacol 4VP 4-Vinylphenol
ABBREVIATIONS OF GENUS NAMES B. Brettanomyces C. Candida D. Dekkera L. Lactobacillus P. Pichia Ped. Pediococcus S. Saccharomyces
LIST OF TABLES
Table 1: Most common volatile phenols found in wine, their synthesis pathway and odour ..12
Table 2: Concentration ranges of volatile phenols in red wine ...13
Table 3: Variety, origin and analytical parameters of the wine samples ...24
Table 4: Sample numbers and their composition ...25
Table 5: Range of retention times for calibrated volatile phenols and internal standard ...27
Table 6: Cell concentration of inocula ...28
Table 7: Mean potential of varieties to produce 4-ethylphenol in diluted wines in ppm ...39
Table 8: Molar conversion rates (%) of p-coumaric acid to 4-ethylphenol by D. bruxellensis in different varietal wines fortified with the precursor ...40
Table 9: Molar conversion rates (%) of ferrulic acid to 4-ethylguaiacol by D. bruxellensis in different varietal wines fortified with the precursor ...41
LIST OF FIGURES
Figure 1: Phenolic acids found in grapes and wine ...14
Figure 2: Average contents of phenolic acids in wines from continental Portugal and Azores ...15
Figure 3: Formation pathway of volatile phenols via the decarboxylation of hydroxycinnamic acids ...16
Figure 4: Calibration curves for 4-ethylguaiacol, 4-ethylphenol and 4-vinylphenol including trendline equations ...27
Figure 5: Growth of D. bruxellensis PYCC 4801 in diluted Touriga Franca (TF) at 30°C ...29
Figure 6: Growth of D. bruxellensis PYCC 4801 in diluted Tinta Roriz (TR) at 30°C ...29
Figure 7: Growth of D. bruxellensis PYCC 4801 in diluted Syrah (SY) at 30°C ...30
Figure 8: Growth of D. bruxellensis PYCC 4801 in diluted Touriga Nacional (TN1) at 30°C .30 Figure 9: Growth of D. bruxellensis PYCC 4801 in diluted Touriga Nacional (TN2) at 30°C .30 Figure 10: Growth of D. bruxellensis PYCC 4801 in diluted Touriga Nacional (TN3) at 30°C ...31
Figure 11: Growth of D. bruxellensis PYCC 4801 in diluted Touriga Nacional (TN4) at 30°C ...31
Figure 12: Growth of D. bruxellensis PYCC 4801 in diluted Sousão (S1) at 30°C ...31
Figure 13: Growth of D. bruxellensis PYCC 4801 in diluted Sousão (S2) at 30°C ...32
Figure 14: Growth of D. bruxellensis PYCC 4801 in diluted Sousão (S3) at 30°C ...32
Figure 15: Growth of D. bruxellensis PYCC 4801 in diluted Sousão (S4) at 30°C ...33
Figure 16: Volatile phenol concentration in examined red wines ...33
Figure 18: Initial volatile phenol concentration in Tinta Roriz (TR) and Touriga Franca and amount present in diluted wine after contamination with D. bruxellensis PYCC 4801 ...35
Figure 19: Initial volatile phenol concentration in Syrah (SY) and the amount present in diluted wine after contamination with D. bruxellensis PYCC 4801 ...35
Figure 20: Initial volatile phenol concentration in Touriga Nacional wines and the amount present in diluted wines after contamination with D. bruxellensis PYCC 4801 ...36
Figure 21: Initial volatile phenol concentration in Sousão wines compared to the amount present in diluted wines after contamination with D. bruxellensis PYCC 4801 ...37
Figure 22: Concentration of 4-ethylguaiacol produced by D. bruxellensis in diluted varietal red wines ...38
Figure 23: Concentration of 4-ethylphenol produced by D. bruxellensis in diluted varietal red wines ...39
OUTLINE
ABSTRACT ...2
ACKNOWLEDGEMENTS ...3
ABBREVIATIONS ...4
ABBREVIATIONS OF GENUS NAMES...5
LIST OF TABLES ...6
LIST OF FIGURES ...7
1 INTRODUCTION ... 10
2 LITERATURE REVIEW ... 11
2.1 Phenolic compounds in wine ... 11
2.2 Volatile phenols in wine ... 11
2.2.1 Concentration ranges... 12 2.2.2 Perception thresholds ... 13 2.2.3 Precursors... 13 2.2.4 Synthesis ... 15 2.3 Microbial origin ... 16 2.3.1 Dekkera/Brettanomyces ... 18 2.3.2 Sources of contamination ... 19
2.4 Grape variety and volatile phenol production by Brettanomyces bruxellensis ... 20
2.4.1 Portuguese wines ... 21
2.5 Other factors influencing volatile phenol production ... 22
3 MATERIALS AND METHODS ... 24
3.1 Wine samples ... 24
3.2 Yeast strain... 25
3.3 Preparation of phenolic compound solutions ... 25
3.4 Sample preparation ... 25
3.5 Determination of yeast growth ... 26
3.6 Extraction of volatile phenols ... 26
3.7 Gas chromatography ... 26
4 RESULTS ... 28
4.1 Inoculum size ... 28
4.2 Yeast growth ... 28
4.3 Volatile phenols in varietal wines... 33
4.4 Volatile Phenols production by D. bruxellensis PYCC 4801 in diluted wines ... 34
4.4.1 Estimation of the potential for volatile phenol production in diluted wines ... 38
4.4.2 Estimation of volatile phenol precursor quantities in diluted wines ... 39
5 DISCUSSION... 42
5.2 Volatile phenols production ... 43
5.3 Potential of volatile phenol production ... 44
5.4 Estimation of precursor quantities ... 45
6 CONCLUSIONS ... 46
1 INTRODUCTION
Volatile phenols such as 4-ethylphenol, 4-ethylguaiacol, 4-vinylguaiacol and 4-vinylphenol impart the so-called phenolic off-flavour that is described as inducing barnyard, horse sweat or leather-like defects in wine aroma. It can also be referred as to "Brett character" since volatile phenols are formed by Brettanomyces/Dekkera yeasts utilizing phenolic precursors present in grapes and wine. This alteration, mainly occurring in red wines is considered detrimental to wine quality leading to rejection of those concerned wines. Therefore, since the accumulation of volatile phenols carries a high risk of financial losses for the wine industry, the interest in control and prevention measures of Brettanomyces/Dekkera spoilage has been rising in the past few years.
While several factors influencing the formation of volatile phenols in wine have been widely discussed, little research has been focused on the impact of the grape variety. Empirical evidence obtained by Portuguese winemakers suggests that some grape varieties may be more susceptible to Brettanomyces/Dekkera spoilage and production of volatile phenols than others. In spite of Portugal having a substantial diversity of native grape varieties, those have not yet been studied in as much detail as varieties from other origins, especially with regard to production of volatile phenols. Therefore, this project aims to evaluate whether there are recognizable differences in the susceptibility of different Portuguese varieties to produce volatile phenols. In order to attain this purpose, the following objectives have to be achieved.
Determining the ability of chosen single varietal wines to support the growth of a particular Dekkera strain, namely Dekkera bruxellensis PYCC 4801.
Determining the ability of Dekkera bruxellensis PYCC 4801 to produce volatile phenols in this environment.
Determining a potential correlation between grape variety and volatile phenol production.
Determining the suitability of contamination with D. bruxellensis PYCC 4801 and subsequent determination of volatile phenols as method to obtain information on the wines potential to produce volatile phenols.
The theoretical part of this work gives an overview over phenolic compounds in wine, focusing on those acting as precursors, the synthesis of volatile phenols and their microbial origin. Furthermore, previous works evaluating volatile phenol occurrence in several varietal wines as well as some from different origins is discussed. In the experimental part different native varietal wines from Portugal were contaminated with Dekkera bruxellensis in order to determine and evaluate the possible effect of the grape variety on the production of volatile phenols. Eventually it is discussed if and to what extent the results indicate a correlation between variety and volatile phenol production..
2 LITERATURE REVIEW
2.1 Phenolic compounds in wine
Grapes and wine contain various phenolic compounds that are related to both the colour and flavour attributes of wine and may also have antioxidant properties that may be beneficial to health (De Beer, et al., 2002; Ribéreau-Gayon, et al., 2006) These compounds are mainly extracted from grape skins, particularly the epidermal cells and the seeds during winemaking but smaller amounts also originate from wood, introduced during wine aging (Ribéreau-Gayon, et al., 2006). The phenolic composition of wines is greatly influenced by the grape variety, location of the vineyard, climate, soil type, system and practices of cultivation and harvest as well as the process of winemaking including all process steps such as pressing, maceration, aging, etc. (Rodríguez-Delgado, et al., 2002)
Based on their carbon skeleton, phenolic compounds can basically be divided into two groups: flavonoids and non-flavonoids. Flavonoids present in wine are anthocyanins, flavan-3-ol monomers, polymers and flavonols (Castillo-Sánchez, et al., 2008). Their structure is a composition of 15 carbon atoms, including two benzene rings that are connected by a linear three-carbon chain (Kheir, et al., 2013). Non-flavonoids including hydroxycinnamic acids and their derivates, hydroxybenzoic acids and volatile phenols by contrast possess a simpler structure consisting of one primary aromatic ring bond to either one or three carbons (Castillo-Sánchez, et al., 2008; Kheir, et al., 2013; Basha, et al., 2004). Apart from these compounds, a third group of phenolic compounds in wine has recently been mentioned by Basha et al. (2004): phenolic-protein-polysaccharides.
2.2 Volatile phenols in wine
Certain non-flavonoids, particularly phenolic acids (hydroxycinnamic) in their free forms, act as precursors to the production of odorous volatile phenols. Volatile phenols associated with wine include ethylphenols (such as 4-ethylphenol and 4-ethylguaiacol) that are quantitatively more significant in red wines as well as vinylphenols (such as vinylphenol and 4-vinylguaiacol) which are mostly found in white wines (Chatonnet, et al., 1997). The low concentrations of vinylphenols in red wine were thought to be due to the subsequent conversion of these intermediates to their corresponding ethyl-derivates by lactic acid bacteria during malolactic fermentation. It has been shown however that it is rather related to the inhibition of conversion enzymes by certain grape phenols (Ribéreau-Gayon, et al., 2006). Recently, 4-ethylcatechol has been found to contribute to phenolic off-flavour in wine as well. However, due to difficulties in its detection more attention has been paid to the four above mentioned volatile phenols (Hesford, et al., 2004).
Although commonly occurring in very low concentrations, volatile phenols have great influence on organoleptic characteristics, especially when sensory thresholds are exceeded (Kheir, et al., 2013; Rentzsch, et al., 2009). Excessive volatile phenol production is regarded as spoilage, imparting phenolic, animal or even stable odours that are also referred as to phenolic character (Chatonnet, et al., 1992). Specifically, 4-ethylphenol possesses woody, smoky, leather and animal flavours while 4-vinyl and 4-ethylguaiacol impart spicy clove-like notes (Edlin, et al., 1995).
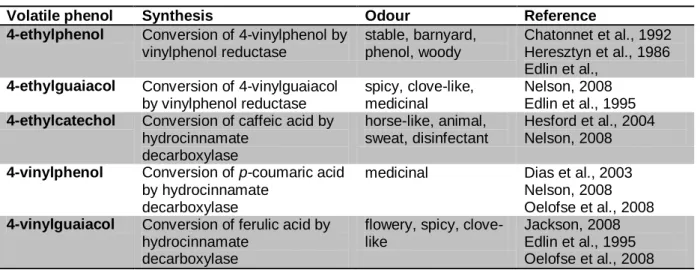
Table 1 shows the most commonly occurring volatile phenols, summarizes their pathway of formation and sensory descriptors. These off-flavours can appear in red wines at various stages during fermentation and ageing (Chatonnet, et al., 1997). However, below certain threshold levels their presence may be considered as contributing to the complexity of wine aroma generating notes of leather, smoke or spices (Kheir, et al., 2013).
Table 1: Most common volatile phenols found in wine, their synthesis pathway and odour
Volatile phenol Synthesis Odour Reference
4-ethylphenol Conversion of 4-vinylphenol by vinylphenol reductase stable, barnyard, phenol, woody Chatonnet et al., 1992 Heresztyn et al., 1986 Edlin et al.,
4-ethylguaiacol Conversion of 4-vinylguaiacol by vinylphenol reductase
spicy, clove-like, medicinal
Nelson, 2008 Edlin et al., 1995
4-ethylcatechol Conversion of caffeic acid by hydrocinnamate decarboxylase horse-like, animal, sweat, disinfectant Hesford et al., 2004 Nelson, 2008
4-vinylphenol Conversion of p-coumaric acid by hydrocinnamate
decarboxylase
medicinal Dias et al., 2003 Nelson, 2008 Oelofse et al., 2008
4-vinylguaiacol Conversion of ferulic acid by hydrocinnamate
decarboxylase
flowery, spicy, clove-like Jackson, 2008 Edlin et al., 1995 Oelofse et al., 2008 2.2.1 Concentration ranges
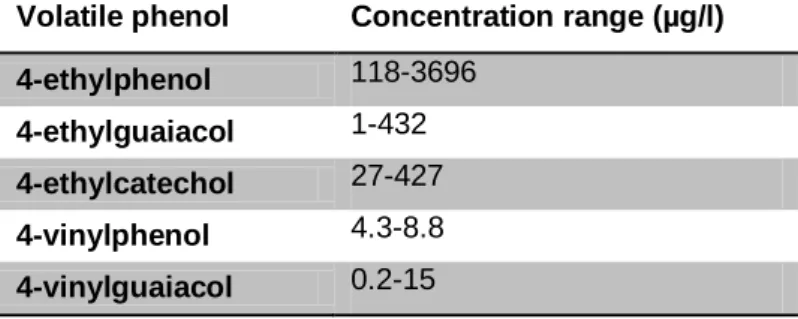
Volatile phenol quantities found in wines strongly vary depending on variety, vintage and the wine's origin. Pollnitz et al. (2000) examined 61 bottled commercial red wines of various vintages using gaschromatography-mass spectrometry and found 4-ethylphenol concentrations ranging from 2 µg/l in Merlot up to 2660 µg/l in Shiraz with a mean value of 795 µg/l. 4-ethylguaiacol was detected in a range from 1 µg/l in Pinot Noir to 437 µg/l in Merlot with a mean concentration of 99 µg/l. Oelofse et al. (2008) as well summarized quantity rates commonly found in red wines showing ranges similar to those Pollnitz et al. (2000) discovered. Additionally, Table 2 shows concentration ranges for ethyl and vinylphenols occurring in red wines.
Table 2: Concentration ranges of volatile phenols in red wine (reproduced from Oelofse et al, 2008) Volatile phenol Concentration range (µg/l)
4-ethylphenol 118-3696 4-ethylguaiacol 1-432 4-ethylcatechol 27-427 4-vinylphenol 4.3-8.8 4-vinylguaiacol 0.2-15 2.2.2 Perception thresholds
Chatonnet et al. (1992) established perception thresholds for ethyl-derivatives in water as well as in red wine. Due to the aromatic complexity of wine, threshold values in water are much lower. It was shown that ethylguaiacol was more easily perceived compared to 4-ethyphenol with threshold values of 140 µg/l and 620 µg/l in wine, respectively. The rough proportion in which both these compounds are normally present in red wine is a 10:1 average ratio for the mixture 4-ethylphenol : 4-ethylguaiacol. If the combined threshold value of 426 µg/l is exceeded, the phenolic character may occur (Chatonnet, et al., 1992). However, these threshold values may not be equally applicable in all wines. It has been shown that certain compounds possess a masking effect on the detection of ethyl-derivatives and therefore sensory descriptors do not always correlate with the actual ethylphenol contents. In fact, it was proven that the presence of isobutyric and isovaleric acids, synthesized during volatile phenol production by Brettanomyces bruxellensis, raise the detection threshold of ethylphenols about up to three times compared to the aforementioned value (Romano, et al., 2008).
2.2.3 Precursors
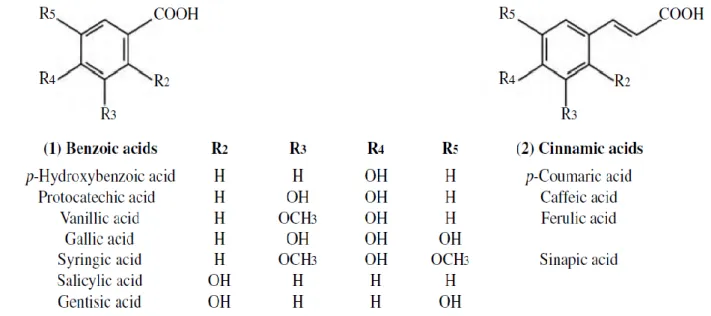
Both grape juice and wine contain phenolic acids including hydroxycinnamic and hydroxybenzoic acids. They can be present in cis and trans configurations while the latter are more stable and hence more prevalent (Rentzsch, et al., 2009). According to Ribéreau-Gayon et al. (2006), the combined concentration of benzoic and cinnamic acids in red wine ranges from 100 to 200 mg/l and from 10 to 20 mg/l in white wines. They may vary among different grape varieties, ripening conditions and be dependent on vinification practices (Ribéreau-Gayon, et al., 2006). For example, lower occurrence of precursors in white wine may be explained by the fact that they are extracted from the skins and seeds during maceration which is usually avoided in the production of white wine (Kheir, et al., 2013). Figure 1 shows the chemical structures of benzoic and cinnamic acids present in grapes and wine. In grapes, benzoic acids are mainly bound to glycosides or esters and released during winemaking by the hydrolysis of these combinations or other breakdown reactions of
anthocyanins (Ribéreau-Gayon, et al., 2006). Therefore in wine, benzoic acids are more prevalent in their free forms while cinnamic acids are found rather in combinations such as esterified with tartaric acid. (Kheir, et al., 2013; Rentzsch, et al., 2009; Ribéreau-Gayon, et al., 2006). In wine, fertaric acid and p-coutaric acid, tartaric esters of ferulic and p-coumaric acids, respectively, which are the most prevalent precursors in volatile phenol production are present at values around 16.0 mg/l and 55.0 mg/l, respectively (Rentzsch, et al., 2009).
Figure 1: Phenolic acids found in grapes and wine (reproduced from Ribéreau-Gayon, et al., 2006)
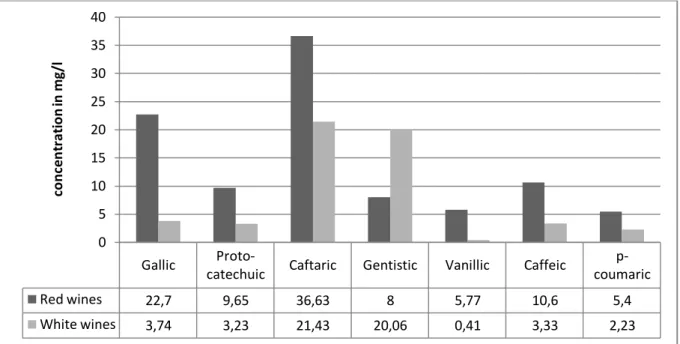
Research conducted on both red and white wines from Portugal found total phenolic acid contents close to the range mentioned by Ribéreau-Gayon et al. (2006), 98.7 mg/l were present in red and 54.4 mg/l in white wine (Ribeiro de Lima, et al., 1998). Moreover, average concentrations of some specific phenolic acids were determined using HPLC with diode array detector procedures. The results, presented in Figure 2, show average contents of phenolic acids obtained from examining a total of 72 wines. Furthermore, they confirm that apart from gentistic acid, white wines show lower values for phenolic acids (Ribeiro de Lima, et al., 1998).
Figure 2: Average contents of phenolic acids in wines from continental Portugal and Azores (Data compiled from Ribeiro de Lima et al., 1998)
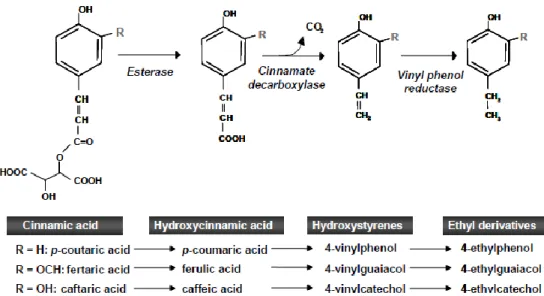
2.2.4 Synthesis
The production of volatile phenols is related to the enzymatic conversion of free hydroxycinnamic acid precursors, particularly p-coumaric acid, ferulic acid and caffeic acid (Kheir, et al., 2013; Ribéreau-Gayon, et al., 2006). Two sequential conversion steps facilitated by cinnamate decarboxylase and vinylphenol reductase are necessary in order to form volatile phenols (Chatonnet, et al., 1997). A cinnamate carboxylase enzyme or phenolic acid decarboxylase (PAD) decarboxylates hydroxycinnamic acids to intermediate hydroxystyrenes, namely 4-vinylphenol, 4-vinylguaiacol and 4-vinylcatechol by cleaving off the C3 carbon from the side chain and releasing CO2 (Kheir, et al., 2013; Chatonnet, et al., 1997). Research conducted by Barthelmebs et al. (2000) suggests that in some bacteria the synthesis of PAD enzymes, specifically p-coumaric acid decarboxylase may be a stress response to high concentrations of phenolic acids inducing the conversion of p-coumaric acid into a less toxic derivate. The second step of volatile phenol formation involves the reduction of vinyl-derivativee double bond by vinylphenol reductase (VPR) in order to form respective ethyl-derivatives (4-ethylphenol, 4-ethylguaiacol and 4-ethylcatechol) (Kheir, et al., 2013). The conversion pathway is shown in Figure 3.
Gallic
Proto-catechuic Caftaric Gentistic Vanillic Caffeic
p-coumaric Red wines 22,7 9,65 36,63 8 5,77 10,6 5,4 White wines 3,74 3,23 21,43 20,06 0,41 3,33 2,23 0 5 10 15 20 25 30 35 40 co n ce n tra ti o n in m g/l
Figure 3: Formation pathway of volatile phenols via the decarboxylation of hydroxycinnamic acids (reproduced from Oelofse et al., 2008)
An alternative pathway was proposed in some lactic acid bacteria by Whiting and Carr (1959) where the phenolic acids are first reduced to their substituted phenyl propionoc acids by p-coumaric and ferulic acid reductase activities (PAR) and subsequently decarboxylated to generate their 4-ethyl-derivates (Barthelmebs, et al., 2000; Ota, et al., 2001; Whiting, et al., 1959). This pathway was found in Lactobacillus plantarum and Lactobacillus paracollinoides (Barthelmebs, et al., 2000).
2.3 Microbial origin
The microbial origin of volatile phenols in wine has been widely discussed. Initially, their occurrence was associated with lactic acid bacteria (LAB) and their action during malolactic fermentation. Growing cultures of Lactobacillus brevis, L. plantarum and Pediococcus have been identified to be capable of decarboxylating phenolic acids, especially ferulic and p-coumaric acid (Couto, et al., 2006; Chatonnet, et al., 1995; Cavin, et al., 1993). Couto et al. (2006) proposed that LAB's capacity to produce volatile phenols is higher for p-coumaric than for ferulic acid. Although some LAB (Lactobacillus brevis, Ped. pentosaceus, Leuconostoc
oenos) were able to produce vinylphenols in ranges from a few hundred up to thousands of
µg/l in growth media, only insignificant amounts below 10.0 µg/l of ethylphenols were found to be released in wines (Chatonnet, et al., 1995; Cavin, et al., 1993). Chatonnet et al. (1995) suggested L. plantarum to be the only LAB capable of reducing vinyl-derivates into significant amounts of ethyl-derivates, 4-ethylphenol being the most predominant. These findings were confirmed by Couto et al. (2006) who found that 37% of 35 strains (20 species) exhibited
results were confirmed by a later study which identified, using a molecular screening approach, the presence of the pdc gene (which codifies for PAD) in certain LAB species (De las Rivas, et al., 2009). However, in previous studies conducted with wines, the released concentrations of volatile phenols by LAB did not exceed the perception threshold and therefore had no detrimental effect on wine aroma (Chatonnet, et al., 1995). Therefore, excessive volatile phenol production could not be linked to LAB or malolactic fermentation despite the fact that some LAB do possess enzymatic activity for transforming phenolic precursors into their corresponding volatile phenols.
Other microorganisms considered to be more relevant in regard to volatile phenol production are certain yeasts. Saccharomyces cerevisiae, the main yeast responsible for alcoholic fermentation in wines exhibits a cinnamate decarboxylase activity and is therefore capable of forming vinylguaiacol from hydroxycinnamic precursors, however does not reduce them to their corresponding ethyl-derivatives (Chatonnet, et al., 1993; Heresztyn, 1986). Dias et al. (2003) have shown that several yeast species associated with wine production or wine-related environment including Dekkera bruxellensis, D. anomala, Candida cantarelli, Candida
wickerhamii, Debaryomyces hansenii, Kluyveromyces lactis and Pichia guilliermondii
additionaly exhibit the capability of both decarboxylating p-coumaric and reducing the arising 4-vinylphenol into its respective ethylphenol. The highest molar conversion rates were detected in D. bruxellensis and D. anomala with an efficiency rate of about 90%. Similar results were obtained for efficiency of P. guilliermondii although conversion rates were variable within strains. The remaining showed themselves to be rather weak ethylphenol producers (Dias, et al., 2003b). Chatonnet et al. (1995) suggested that D. intermedia produces 4-ethylphenol in amounts up to 16 times the perception threshold value while LAB barely exceeded half the threshold value. Other yeast species and strains, not related to wine but other fermented foods were found by Chatonnet et al. (1992) and confirmed to form ethylphenols by Dias et al. (2003). These include C. halophila, C. mannitofaciens and C.
versailis that are associated with soy sauce production. It can be concluded that the
fermenting yeast S. cerevisiae or species other than Brettanomyces/Dekkera bruxellensis,
intermedia and anomala or LAB are considered rather weak ethylphenol producers under
wine conditions that may not influence wine aroma. Futhermore, P. guillermondii which produces significant amounts of ethylphenol was indeed recovered from grapes and grape juice but not from wine (Dias, et al., 2003b). Therefore, certain Dekkera/Brettanomyces strains remain the most significant agents in creating phenolic off-flavours in wine. The species most prevalent in wine is B. bruxellensis (Chatonnet, et al., 1992).
2.3.1 Dekkera/Brettanomyces
The name Brettanomyces is most probably derived from "British brewing fungus" since it was isolated from old English stock beer and imparts typical flavours. These flavours were suggested to be linked to a secondary fermentation by the spore forming
non-Saccharomyces yeast Brettanomyces that was first described in 1904 by Claussen (Oelofse,
et al., 2008; Van der Walt, et al., 1958). Later on, Brettanomyces strains were found to play a role in various fermented beverages such as wine, cider, kombucha as well as other types of beer but also in fermented food including olives or cheeses (Nelson, 2008; Suárez, et al., 2007). The first association with wine was not made until 1940 when a research by M.T.J. Custers showed that of 17 strains isolated from beverages, one originated from a French wine whereas most of them were found in beer (Oelofse, et al., 2008).
According to Van der Walt et al. (1958) Brettanomyces species are characterized by their slow growth, the production of pseudomycelium, the formation of 'ogive' cells, the presence of fermentative metabolism, the production of acetic acid under anaerobic conditions and the absence of spore formation. Currently, of the genera Brettanomyces five species are recognized: B. bruxellensis, B. anomalus, B. naardenensis, B. nanus and B.custersianus (Oelofse, et al., 2008; Arvik, et al., 2002). A few years after the first characterization of
Brettanomyces however, spore forming sexual strains were discovered and therefore the
genus revised. Two species were assigned to the new genus Dekkera: D. bruxellensis and
D.intermedia, of which the former represents the type strain (Van der Walt, 1964).
Brettanomyces/Dekkera yeasts are ubiquitous in regions associated with production of wine. Brettanomyces spp. has been isolated from wines and winery environment in Germany,
France, Portugal, South Africa, Italy, New Zealand, Spain, Great Britain and the United States (Nelson, 2008). Moreover, in 31 winemaking regions in Australia, 8 different genotypes of D. bruxellensis were found in 244 D. bruxellensis isolates obtained from wineries and wine (Curtin, et al., 2007).
The yeast species Brettanomyces/Dekkera bruxellensis is considered responsible for spoilage of wine and other fermented beverages. Other names such as D. intermedius, B.
intermedius, B. lambicus or B. custersii which enologists have referred to as the spoilage
organism in the past, are nowadays considered synonyms for Brettanomyces/Dekkera
bruxellensis (Loureiro, et al., 2003).
production at about the mid-exponential phase lasting until the beginning of the stationary phase. In contrast Chatonnet et al. (1992) described an earlier onset of 4-ethlyphenol production starting already from the latency phase and keeping up until the end of exponential phase. vinylphenol decreased in both studies with the increase of ethylphenol production. It was suggested this may be due to subsequent conversion to 4-ethylphenol (Chatonnet, et al., 1992; Dias, et al., 2003b)
Apart from volatile phenols, Dekkera/Brettanomyces exhibits the ability to produce other volatile compounds inducing off-flavours. These include tetrahydropyridines, responsible for mousy off-flavour as well as 3-methylbutyric acid (isovaleric acid) imparting sweaty and leathery notes (Nikfardjam, et al., 2009). Other effects of B. bruxellensis contamination are haziness or turbidity (Van der Walt, et al., 1958) and the formation of high levels of acetic acid (Nelson, 2008).
2.3.2 Sources of contamination
The primary source of contamination has been contentiously discussed and still remains uncertain. In 1958, Van der Walt et al. suggested a source to be winery environment rather than the yeast flora related to grapes and must. While Brettanomyces could be recovered from cellars and cellar equipment, they were not present on husks, pomaces or grapes. Therefore it was concluded that the contamination may arise only from within the winery. These findings were confirmed a couple of years later by the same authors with a method more appropriate for the recovery of Brettanomyces (Van der Walt, et al., 1960). More recent research using precise PCR techniques however, has shown the presence of
Brettanomyces/Dekkera yeasts on grapes and in grape processing lines as well (Loureiro, et
al., 2003). Generally, the rare detection on grapes in the past has been attributed to their low cell numbers in the diverse microbial environment of the grape skin in which other microorganisms or species may dominate. With the development of more specific media, B.
bruxellensis could be detected on grapes at different stages of berry development (Oelofse,
et al., 2008).
The occurrence of Brettanomyces/Dekkera has also been linked to grapes damaged by sour rot (Oelofse, et al., 2008). Furthermore, Brettanomyces was detected in air samples from crush, tank, barrel and bottling rooms of a winery. Thus, it could be shown that these spoilage yeasts can be present in the air (Connell, et al., 2002). However, the most critical stage in wine production for Brettanomyces/Dekkera spoilage to occur, is recognized to be the ageing in barrels after alcoholic fermentation has been completed, when the numbers of competitive microorganisms have decreased and the presence of residual sugars allows
proliferation (Chatonnet, et al., 1992). Barrels with their porous wood structure present an ecological niche for Brettanomyces/Dekkera which allows a little influx of oxygen and therefore promotes growth. Moreover, improper barrel sanitation and sulphite utilization might result in an incompletely elimination of these yeasts and thus favor the contamination of wines transferred to these barrels (Oelofse, et al., 2008; Suárez, et al., 2007; Loureiro, et al., 2003).
2.4 Grape variety and volatile phenol production by Brettanomyces bruxellensis
There are several factors affecting the formation of volatile phenols by
Brettanomyces/Dekkera. Firstly, the availability of phenolic precursors greatly influences the
formation of volatile products (Kheir, et al., 2013; Suárez, et al., 2007). This aspect has been widely related to both geographical origin and variety. In several studies from various countries and wine producing regions, it was suggested that phenolic compound concentrations vary between different grape varieties. For distinct differentiation of wines regarding grape variety however, the content of polyphenols has proven to be more useful than data on volatile compounds or phenolic acids. While some colored phenols such as the flavonoid quercetin show large variations between varieties, hydroxycinnamic acids have not been proven to differ significantly, although trends are recognizable (Villiers, et al., 2005). Gambelli et al. (2004) compared the phenolic compound contents of Italian red wines from different geographical origins. The findings indicate that concentrations of phenolic acids including p-coumaric and ferulic acid are more dependent on cultivars than on geographical origin (Gambelli, et al., 2004). Similar results were obtained by Pena-Neira et al. (1999) who observed quantitative differences in phenolic compounds in Spanish red wines. It was suggested they may be related to grape variety but are also influenced by vinification method and employed process of wine aging (Pena-Neira, et al., 2000). White wines generally show lower amounts of phenolic compounds due to shorter extraction times from skins and seeds. In some samples however, ferulic acid contents where similar to those found in red wine (Villiers, et al., 2005).
Pollnitz et al. (2000) describes research conducted by Goldberg et al. (1998) who analyzed
p-coumaric acid concentrations of 547 commercial red wines from different wine producing
regions and countries using high performance liquid chromatography. Although values seemed to vary slightly within varieties, the lowest values were observed in Pinot Noir compared to Shiraz and Cabernet Sauvignon. These results from Australian wines were confirmed by the analysis of Californian and South African wines which showed the lowest p-coumaric acid concentrations in Pinot Noir as well (Villiers, et al., 2005; Goldberg, et al.,
from France, Australia, California, South Africa and Canada (Goldberg, et al., 1998; Soleas, et al., 1997).
Pollnitz et al. (2000) analyzed Australian red wines regarding varietal influences on the presence of volatile phenols (4-ethlyphenol and 4-ethylguaiacol). Again, within varieties wide ranges of concentrations could be observed. The general trend however showed that the mean concentration of 4-ethylphenol was lowest in Pinot (with an average of 338.0 µg/l), with the authors suggesting that a relation might exist to the low precursor occurrence in this grape variety detected in previous research (Pollnitz, et al., 2000). Pinot Noir was followed by Shiraz with an average concentration of 605.0 µg/l and Cabernet Sauvignon with the highest average 4-ethylphenol concentration of 1250.0 µg/l. Varietal differences in 4-ethylguaiacol were found to be insignificant (Pollnitz, et al., 2000). Similar results were obtained by a study conducted on German wines from the Würtemberg region. Varieties that are known to be rich in hydroxycinnamic precursors such as Acolon, Cabernet Cubin, Dornfelder or Portugieser, have shown to possess high ethylphenol contents that partly exceed the sensory threshold value established by Chatonnet et al. (1992) (Nikfardjam, et al., 2009). These results suggest that depending on their contents of phenolic precursors, varieties may be more or less prone to formation of volatile phenols.
There are however certain factors that may affect the precursor concentration so that even within varieties, values may change. Grapes grown in hot climates for example are richer in hydroxycinammic acids. Moreover, the maturity of grapes as well as technological aspects during vinification play important roles (Ribéreau-Gayon, et al., 2006). For instance, the extraction process including temperature profiles during maceration impact precursor availability. High temperatures, especially at the end of maceration have been shown to promote extraction processes by affecting the permeability of cells and membranes of grape skins and thus increasing formation of volatile phenols (Gerbeaux, et al., 2002).
2.4.1 Portuguese wines
Only a few studies have been conducted on Portuguese varieties and none of them has tried to find a relation between precursor availability and the potential to form volatile phenols but rather evaluated the possibility to differentiate varieties on the basis of their phenolic profiles. Ribeiro de Lima et al. (1998) have proven varietal differences in p-coumaric acid content, with Touriga Francesa (also referred as to Touriga Franca) (38.3 mg/l) exhibiting highest values in red and Verdelho (5.0 mg/l) in white wines. Other authors that evaluated anthocyanin profiles rather than non-coloured phenolics have shown that anthocyanins may be a good marker to differentiate varieties (Dopico-García, et al., 2008; Mateus, et al., 2002).
While Dopico-García et al. (2008) examined 10 different varieties of red Vinho Verde grapes and could observe clear differences in their specific anthocyanin profiles, Mateus et al. (2002) only evaluated two varieties, namely Touriga Nacional and Touriga Franca but obtained similar results. Observations regarding the influence of grape origin and harvest conditions on non-coloured phenolic composition and anthocyanin profile have shown that the impact of these factors is higher in non-coloured phenolics rather than anthocyanins (Dopico-García, et al., 2008). Although no correlation to volatile phenols was specifically examined, the results suggest that the grape variety highly impacts their phenolic profile and therewith the potential precursor composition of grapes.
2.5 Other factors influencing volatile phenol production
Besides factors affecting the phenolic composition, microbiological factors may also influence volatile phenol production. For instance, the capacity to form those compounds from their precursors varies depending on the strain responsible for spoilage (Suárez, et al., 2007; Valentao, et al., 2007; Shinohara, et al., 2000). This may be explained by differences in enzymatic specificity, activity and the metabolism of phenolic acids between species (Edlin, et al., 1995). Furthermore, a high correlation between Brettanomyces/Dekkera population size and conversion time of p-coumaric acid into volatile phenols was found by Benito et al. (2009) suggesting that the amount of odorous product formed is greatly influenced by the extent of contamination by the spoilage organism (Benito, et al., 2008). A decrease of volatile phenols formed may also be due to a decrease of phenolic precursors caused by their adsorption onto yeast cell walls (Salameh, et al., 2008). Both Salameh et al. (2008) and Cabrita et al. (2012) have found the initial concentration of p-coumaric as well as ferulic and caffeic acid to be decreased immediately after inoculation with Brettanomyces/Dekkera yeast in both wine and synthetic medium and attributed the major part of this loss to cell adsorption. Besides adsorption to cell walls smaller amounts of acids may be lost due to esterification with ethanol or instability at high temperatures (Cabrita, et al., 2012; Salameh, et al., 2008). Although this and other chemical reactions can decrease the quantity of p-coumaric acid available for bioconversion, other reactions can cause its increase. This effect was described by Dugelay et al. (1993) who observed the hydrolysis of p-coumaroyltartaric acid facilitated by hydrolytic enzymes including pectinase, (hemi-)cellulase and cinnamate esterase releasing p-coumaric acid in must. Such enzyme preparations may be used for clarification improvement purposes, colour extraction or flavour enhancement (Dugelay, et al., 1993).
increase in temperature (30°C compared to 16°C) raised the production rate of ethylphenol although it did not impact the eventual yield. Moreover, it was shown that glucose or ethanol are necessary carbon sources in order to obtain conversion rates up to 90%. It should be noted however, that ethanol concentrations above 13 %(v/v) have been restricting both the growth of Brettanomyces/Dekkera bruxellensis and the formation of ethylphenols.
In conclusion, several authors have shown that the grape variety indeed impacts the phenolic composition of grapes and wine and thus the availability of precursors. Due to various other factors related to the vinification process and contaminating yeasts however a concrete correlation between variety and formation of volatile phenols has not been found yet.
3 MATERIALS AND METHODS
The experimental work described in this dissertation involved analyzing Portuguese wines for the occurrence of volatile phenols. Single varietal wines were selected in order to identify the influence of the grape variety on volatile phenol production in purposely contaminated wines. A total of 11 samples were collected from different wineries. Subsequently, the wines were modified regarding pH- and alcohol content in order to serve as base media for yeast growth and/or volatile phenol metabolism. Freshly prepared cultures of a Dekkera bruxellensis strain were used to inoculate the wines and samples were incubated for 10-14 days at 30°C. Yeast growth was monitored by viable yeast counts three times a week. Once stationary phase was reached volatile compounds were extracted (using a liquid-liquid extraction protocol) in order to prepare samples for subsequent chromatographic screening. The samples were analysed for the presence of three particular volatile phenols: 4-Ethylphenol (4EP), 4-Ethylguacaol (4EG) and 4-Vinylphenol (4VP).
3.1 Wine samples
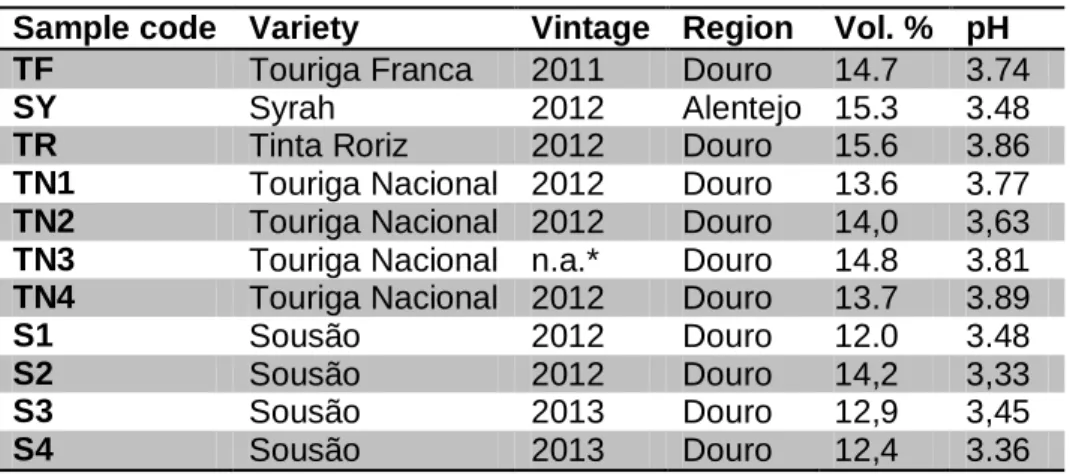
A total of 11 single variety wines were provided by different wine producers from two major wine regions in Portugal; the Douro Valley and Alentejo region. Table 3 summarizes the preliminary information available for some chemical parameters of all wines used in this work.
In order to eliminate wine organisms that might interfere with the experiments, all samples were heat treated prior to actual sample preparation. Pasteurization was performed at 50°C for 3 min. using a heat plate with incorporated magnetic stirrer to facilitate even heat distribution throughout the sample. If not immediately used, pasteurized samples were stored at 7°C.
Table 3: Variety, origin and analytical parameters of the wine samples
*n.a.: not available
Sample code Variety Vintage Region Vol. % pH
TF Touriga Franca 2011 Douro 14.7 3.74
SY Syrah 2012 Alentejo 15.3 3.48
TR Tinta Roriz 2012 Douro 15.6 3.86
TN1 Touriga Nacional 2012 Douro 13.6 3.77
TN2 Touriga Nacional 2012 Douro 14,0 3,63
TN3 Touriga Nacional n.a.* Douro 14.8 3.81
TN4 Touriga Nacional 2012 Douro 13.7 3.89
S1 Sousão 2012 Douro 12.0 3.48
S2 Sousão 2012 Douro 14,2 3,33
S3 Sousão 2013 Douro 12,9 3,45
3.2 Yeast strain
For the experimental work the reference strain Dekkera bruxellensis PYCC 4801, from the Portuguese Yeast Culture Collection (Caparica, Portugal) was chosen due to its relevance as a volatile phenol producing spoilage organism in the wine industry. The stock culture was prepared in liquid YM broth (Difco™, Becton, Dickinson and Company, France) and grown to late exponential phase for about 3-5 days at 30°C. In order to preserve the stock culture it was subsequently inoculated in a YM agar (2.0% w/w) medium slant, grown at 30°C and eventually stored at 7°C for later use. The fresh culture used for inoculating the samples was prepared from the slant using sterile YM broth and in the same manner as the stock. Prior to inoculation, the fresh culture was centrifuged (3000 g, 5 min), washed and resuspended in sterile deionized water in order to avoid growth medium being transferred into the sample.
3.3 Preparation of phenolic compound solutions
Individual concentrated solutions (10 g/l) of volatile phenol precursors were prepared by weighing in about 0.1 g of both ferulic acid and p-coumaric acid and dissolving each in 10.0 ml of ethanol (99.5%, Aga, Portugal). The solutions were properly mixed using a vortex and stored in the freezer at -18°C. All commercial phenolic compounds had a purity of at least 99% and were obtained from Sigma-Aldrich (Steinheim, Germany).
3.4 Sample preparation
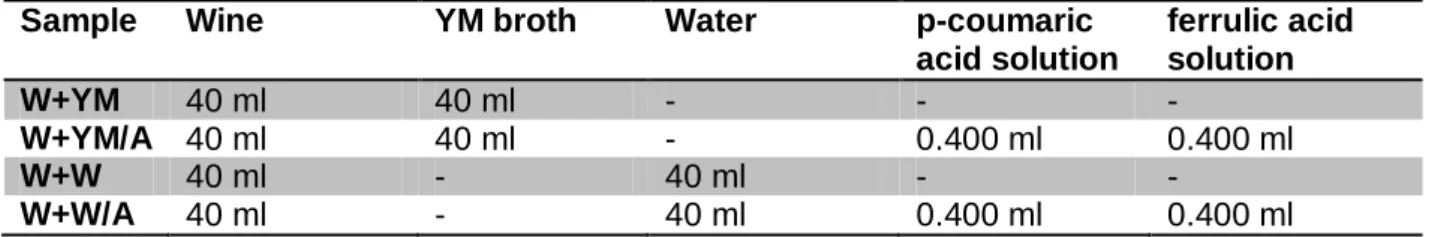
Considering the high alcohol content and low pH of the samples, dilutions were prepared of each wine in order to avoid conditions that may cause stress to the yeasts. In sterile Schott glasses, the wines were mixed with either sterile YM broth or sterile deionized water, in a 50:50 (v/v) ratio constituting a total of 80.0 ml per sample. In order to determine the influence of certain precursors in volatile phenol production, 400 µl of each ferulic and p-coumaric acid solutions were added to selected samples up to a final concentration of 5.0 ppm or 50.0 ppm. The exact composition of the samples is shown in Table 4. To guarantee identical conditions for the yeasts, additionally, pH and ethanol content where adjusted to 3.8 and 7.5% vol., respectively, in all wines. Each sample was prepared as duplicate.
Table 4: Sample numbers and their composition
Sample Wine YM broth Water p-coumaric
acid solution ferrulic acid solution W+YM 40 ml 40 ml - - - W+YM/A 40 ml 40 ml - 0.400 ml 0.400 ml W+W 40 ml - 40 ml - - W+W/A 40 ml - 40 ml 0.400 ml 0.400 ml
Subsequently, each sample was inoculated with 800 µl of freshly prepared Dekkera
3.5 Determination of yeast growth
Yeast growth in samples was determined using the viable plate count technique as described by Miles and Misra (1938). Prior to plating, decimal dilutions were made in 9.0 ml of sterile Ringer solution (Biokar Diagnostics, France) until a 10-5 dilution was obtained. After thoroughly mixing using a rotative vortex, 20 µl drops of each dilution were plated in YM agar (2.0% w/w) plates equally divided into sectors and labeled with their respective dilution. Each sample was plated in duplicates in order to obtain average values. Following incubation at 30°C for 3-4 days, colonies were counted and the number of colony forming units (CFU) per ml in the original sample was calculated.
3.6 Extraction of volatile phenols
50.00 ml of each sample was transferred into volumetric flasks. In order to allow for the appropriate comparison of results, 50.0 µl of 3-octanol were added as internal standard. Afterwards, 4.0 ml of a 50:50 (v/v) solution of n-hexan (Merck, Germany) and diethyl-ether (Panreac, Spain) were added to each volumetric flask and subsequently stirred for 5 minutes. Next, the mixtures were transferred to separation funnels where aqueous and organic phases were separated. While the latter were collected in new vials, the aqueous phases were poured back into respective volumetric flasks for further extraction. The extraction procedure was repeated two more times with 2.0 ml of solvent in order to achieve maximum extraction yields. Eventually, organic phases were collected in vials and reduced under nitrogen flow to about one third of their original volume.
3.7 Gas chromatography
Subsequent to extraction, the samples were analysed using a gas chromatograph from Hewlett Packard (5890A) equipped with a flame ionisation detector (GC-FID). The column employed was a FFAP type (BP1) with dimensions of 50 m x 0.22 mm x 0.25 µm (SGE, Austin, Texas). Hydrogen was used as carrier gas and the flow adjusted to 1.0 ml/min. Once the split flow was adjusted to around the optimum of 30.0 ml/min and the injector had heated up to about 250°C, a sample volume of 2.0 µl was injected. The oven temperature program applied was as following: starting off with 40°C held for 1 min and followed by an increase at a rate of 2°C per minute reaching up to 220°C where it was held for 20 minutes.
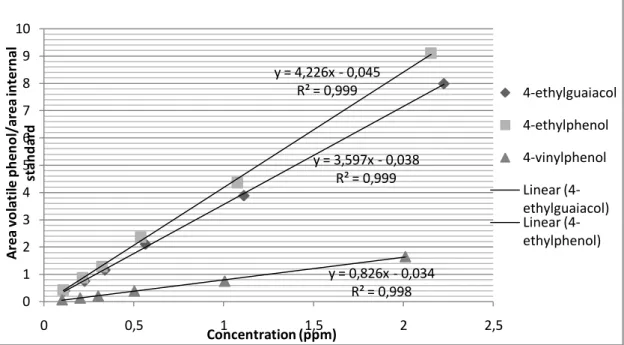
3.8 Calibration curves
In order to identify volatile phenols in the samples a calibration curve was established by preparing standard solutions containing ethylphenol (99%, Sigma-Aldrich, Germany), 4-ethylguaiacol (98%, Sigma-Aldrich, Germany) and 4-vinylphenol (10% solution in propylene glycol, SAFC, United Kingdom). The range of consequent retention times for given GC parameters are shown in Table 5.
Table 5: Range of retention times for calibrated volatile phenols and internal standard
Compounds Average retention time in min
3-octanol 29.56
4-ethylguaiacol 67.42
4-ethylphenol 74.69
4-vinylphenol 85.01
Moreover, all peaks were well separated and as can be seen in Figure 4 R² values show that there is a good correlation between the different data points of each compound.
Figure 4: Calibration curves for 4-ethylguaiacol, 4-ethylphenol and 4-vinylphenol including trendline equations
y = 3,597x - 0,038 R² = 0,999 y = 4,226x - 0,045 R² = 0,999 y = 0,826x - 0,034 R² = 0,998 0 1 2 3 4 5 6 7 8 9 10 0 0,5 1 1,5 2 2,5 A rea v o la ti le p h e n o l/a rea in te rn al st an d ard Concentration (ppm) 4-ethylguaiacol 4-ethylphenol 4-vinylphenol Linear (4-ethylguaiacol) Linear (4-ethylphenol)
4 RESULTS
4.1 Inoculum size
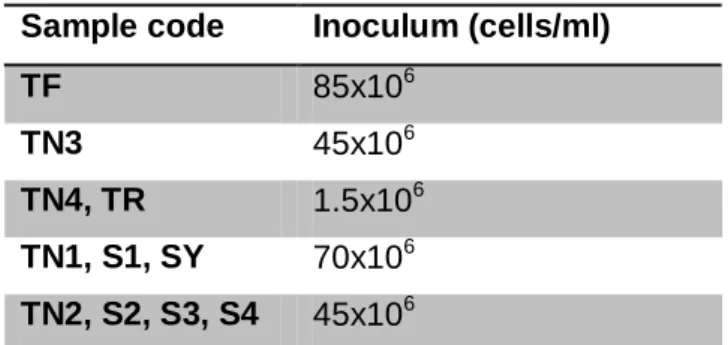
In all experiments, the initial population of yeasts was inoculated at a minimum of 106 cells/ml. As can be seen in Table 6, all values ranged between 1.5 and 85x106.
Table 6: Cell concentration of inocula
Sample code Inoculum (cells/ml)
TF 85x106
TN3 45x106
TN4, TR 1.5x10⁶
TN1, S1, SY 70x106
TN2, S2, S3, S4 45x106
(TF: Touriga Franca; TR: Tinta Roriz; TN1, TN3, TN4: Touriga Nacional; S1, S2, S3: Sousão)
4.2 Yeast growth
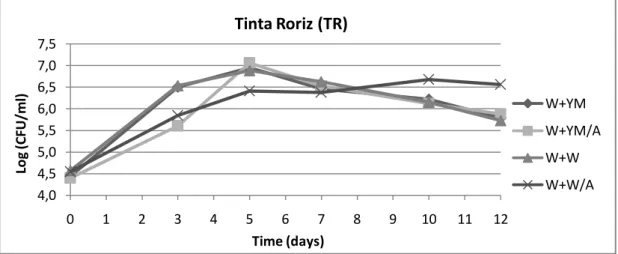
In test trials, pasteurized non-diluted wine was inoculated with D. bruxellensis in order to follow yeast growth and the production of volatile phenols. However, no yeast growth, but rather a decline in cell numbers could be observed (results not shown). Therefore, yeast growth was documented in wines diluted with either YM broth or water in a 50:50 ratio for a period of at least 10 days. The resulting growth curves of D. bruxellensis are presented from Figure 5 to Figure 15.
It can be seen that the initial cell concentration in all samples ranges from approximately 5.0 log CFU/ml to 6.0 log CFU/ml, except for the samples TN4 (Figure 11) and TR (Figure 6) which, in accordance with the inoculum size, contained lower counts at the day of inoculation. No significant differences in growth could be observed comparing samples diluted with water or YM although a slight trend towards higher final counts in YM diluted is visible in most of the samples. However, the opposite trend can be seen in Touriga Franca (TF) and one Touriga Nacional (TN3), presented in Figure 5 and Figure 10, respectively. Moreover, the supplementation with 5mg/l of p-coumaric and ferulic acids such as in TF (Figure 5) and TN3 (Figure 10), did not affect the yeast growth, while with addition of concentrations as high as 50 ppm (remaining figures) one can observe slightly lower cell numbers in supplemented samples. Therefore, it can be suggested that the addition of phenolic precursors in high quantities (such as 50 ppm) might be inhibitory to yeast growth.
Apart from three wines made from the Sousão variety (namely, S2, S3 and S4), the growth curves in different media do not show any significant differences in their behavior regarding growth phases within one sample. The end of exponential phase is attained after a minimum of 3 days, as to be seen for SY (Figure 7), TN1 (Figure 8) and TN2 (Figure 9). The latest onset of stationary phase occurred at around day 7 and 8 in TF (Figure 5), TN3 (Figure 10), S2 (Figure 13) and S4 (Figure 15).
Figure 5: Growth of D. bruxellensis PYCC 4801 in diluted Touriga Franca (TF) at 30°C; values obtained from two determinations (W+YM: wine diluted with YM medium; W+W: wine diluted with water; /A: with added phenolic acids)
Figure 6: Growth of D. bruxellensis PYCC 4801 in diluted Tinta Roriz (TR) at 30°C; values obtained from two
determinations (W+YM: wine diluted with YM medium; W+W: wine diluted with water; /A: with added phenolic acids)
4,0 4,5 5,0 5,5 6,0 6,5 7,0 7,5 0 1 2 3 4 5 6 7 8 9 10 11 12 13 Lo g (C FU /m l Time (days)
Touriga Franca (TF)
W+YM W+YM/A W+W W+W/A 4,0 4,5 5,0 5,5 6,0 6,5 7,0 7,5 0 1 2 3 4 5 6 7 8 9 10 11 12 Lo g (C FU /m l) Time (days)Tinta Roriz (TR)
W+YM W+YM/A W+W W+W/AFigure 7: Growth of D. bruxellensis PYCC 4801 in diluted Syrah (SY) at 30°C; values obtained from two determinations (W+YM: wine diluted with YM medium; W+W: wine diluted with water; /A: with added phenolic acids)
Figure 8: Growth of D. bruxellensis PYCC 4801 in diluted Touriga Nacional (TN1) at 30°C; values obtained from two determinations (W+YM: wine diluted with YM medium; W+W: wine diluted with water; /A: with added phenolic acids)
Figure 9: Growth of D. bruxellensis PYCC 4801 in diluted Touriga Nacional (TN2) at 30°C; values obtained from two determinations (W+YM: wine diluted with YM medium; W+W: wine diluted with water; /A: with added phenolic acids)
4,0 4,5 5,0 5,5 6,0 6,5 7,0 7,5 0 1 2 3 4 5 6 7 8 9 10 Lo g (C FU /m l) Time (days)
Syrah (SY)
W+YM W+YM/A W+W W+W/A 4,0 4,5 5,0 5,5 6,0 6,5 7,0 7,5 0 1 2 3 4 5 6 7 8 9 10 Lo g (C FU /m l) Time (days)Touriga Nacional (TN1)
W+YM W+YM/A W+W W+W/A 4,0 4,5 5,0 5,5 6,0 6,5 7,0 7,5 0 1 2 3 4 5 6 7 8 9 10 Lo g (C FU /m l) Time (days)Touriga Nacional (TN2)
W+YM W+YM/A W+W W+W/AFigure 10: Growth of D. bruxellensis PYCC 4801 in diluted Touriga Nacional (TN3) at 30°C; values obtained from two determinations (W: wine; W+YM: wine diluted with YM medium; W+W: wine diluted with water; /A: with added phenolic
acids)
Figure 11: Growth of D. bruxellensis PYCC 4801 in diluted Touriga Nacional (TN4) at 30°C; values obtained from two determinations (W+YM: wine diluted with YM medium; W+W: wine diluted with water; /A: with added phenolic acids)
Figure 12: Growth of D. bruxellensis PYCC 4801 in diluted Sousão (S1) at 30°C; values obtained from two determinations (W+YM: wine diluted with YM medium; W+W: wine diluted with water; /A: with added phenolic acids)
4,0 4,5 5,0 5,5 6,0 6,5 7,0 7,5 0 1 2 3 4 5 6 7 8 9 10 11 12 13 14 Lo g (C FU /m l) Time (days)
Touriga Nacional (TN3)
W+YM W+YM/A W+W W+W/A 4,0 4,5 5,0 5,5 6,0 6,5 7,0 7,5 0 1 2 3 4 5 6 7 8 9 10 11 12 Lo g (C FU /m l) Time (days)Touriga Nacional (TN4)
W+YM W+YM/A W+W W+W/A 4,0 4,5 5,0 5,5 6,0 6,5 7,0 7,5 0 1 2 3 4 5 6 7 8 9 10 Lo g (C FU /m l) Time (days)Sousão (S1)
W+YM W+YM/A W+W W+W/AAs mentioned previously and as can be seen in Figure 13, Figure 14 and Figure 15, the Sousão samples do not show the same patterns when comparing the curves shape both within one sample as well as between the samples. The growth phases are not clearly visible. Furthermore, the maximum of cell concentrations obtained were (especially in wine diluted with water) much lower when compared to other samples, meaning that there was less cell growth. In some cases (Figure 14) numbers declined even below the original inoculation amount of cells. However, that they were detectable with viable plate count technique at any stage shows that they were viable and thus able to produce volatile phenols at any time.
Figure 13: Growth of D. bruxellensis PYCC 4801 in diluted Sousão (S2) at 30°C; values obtained from two determinations (W+YM: wine diluted with YM medium; W+W: wine diluted with water; /A: with added phenolic acids)
Figure 14: Growth of D. bruxellensis PYCC 4801 in diluted Sousão (S3) at 30°C; values obtained from two determinations (W+YM: wine diluted with YM medium; W+W: wine diluted with water; /A: with added phenolic acids)
4,0 4,5 5,0 5,5 6,0 6,5 7,0 7,5 0 1 2 3 4 5 6 7 8 9 10 Lo g (C FU /m l) Time (days)
Sousão (S2)
W+YM W+YM/A W+W W+W/A 4,0 4,5 5,0 5,5 6,0 6,5 7,0 7,5 0 1 2 3 4 5 6 7 8 9 10 Lo g (C FU /m l) Time (days)Sousão (S3)
W+YM W+YM/A W+W W+W/AFigure 15: Growth of D. bruxellensis PYCC 4801 in diluted Sousão (S4) at 30°C; values obtained from two determinations (W+YM: wine diluted with YM medium; W+W: wine diluted with water; /A: with added phenolic acids)
4.3 Volatile phenols in varietal wines
As indicated by Figure 16, some of the original wines showed presence of 4-ethylphenol and 4-ethylguaiacol, while 4-vinylphenol could not be detected.
It can also be seen that in the non-contaminated wines 4-ethylguaiacol occurred quite often compared to 4-ethylphenol. While 4-ethylguaiacol was found in 7 wines, 4-ethylphenol was detected in only 4 wines at considerably low ranges from 0.02 ppm up to 0.09 ppm and from 0.03 ppm to 0.07 ppm, respectively. The values however are extremely low and do not exceed quantities that are actually considered as detectable by GC. Hence, all values found are far below the perception threshold level established by Chatonnet et al. (1992) and therefore not considered detrimental to wine aroma. Three samples, the Syrah (SY) and each one of the Touriga Nacional and Sousão wines, namely, TN2 and S4 did not show any volatile phenols.
Figure 16: Volatile phenol concentration in examined red wines (TF: Touriga Franca; TR: Tinta Roriz; TN1, TN3, TN4:
Touriga Nacional; S1, S2, S3: Sousão)
4,0 4,5 5,0 5,5 6,0 6,5 7,0 7,5 0 1 2 3 4 5 6 7 8 9 10 Lo g (C FU /m l) Time (days)
Sousão (S4)
W+YM W+YM/A W+W W+W/A TF TR TN1 TN3 TN4 S1 S2 S3 4EG 0,06 0,03 0,02 0,03 0,03 0,06 0,00 0,09 4EP 0,03 0,00 0,00 0,05 0,00 0,05 0,07 0,00 0,00 0,01 0,02 0,03 0,04 0,05 0,06 0,07 0,08 0,09 0,10 C o n ce n tra ti o n in p p m4.4 Volatile Phenols production by D. bruxellensis PYCC 4801 in diluted wines
The amount of volatile phenols in the diluted wines was measured using gas chromatography after contamination with D. bruxellensis and subsequent incubation for at least 10 days at 30°C. All the artificially contaminated samples showed presence of 4-ethylphenol and 4-ethylguaiacol but not of 4-vinylphenol.
When considering the concentration of volatile phenols observed in the diluted wines, it must be considered that potentially, the values could be twice as high as in the original wine since the samples were diluted into a 50:50 ratio and therefore in theory only contained half the amount of volatile phenol precursors compared to non-diluted wine. However, if non-diluted wine was directly contaminated, some factors such as inhibition of yeast growth by higher alcohol levels could have possibly impacted product outcome and therefore it cannot be presumed that levels were actually precisely twice as high. Hence, in all following results the volatile phenol levels presented, are the ones determined in diluted wines.
Figure 17 to Figure 20 present 4-ethylphenol and 4-ethylguaiacol concentrations detected in the original wines and in the same wines diluted with water or YM medium and artificially contaminated with D. bruxellensis PYCC 4801. As appears in the figures, with one exception (TN2), all samples show a trend to slightly higher volatile phenol production in wines diluted with YM compared to water. This may be attributed to an enhanced yeast growth in the presence of the growth medium which could be related to increased nutrient availability. As indicated by Figure 17 D. bruxellensis PYCC 4801 has formed considerable amounts of volatile phenols in Touriga Franca and Tinta Roriz wines. The released quantities of 4-ethylphenol and 4-ethylguaiacol in both diluted wines exceed the perception thresholds of 0.64 ppm and 0.14 ppm (Chatonnet, et al., 1992), respectively and thus it can be assumed the wines should exhibit a phenolic off-flavour. Moreover, the highest 4-ethylphenol quantity in this entire experiment was detected in Tinta Roriz (diluted with YM) with 1.59 ppm. Touriga Franca on the other hand showed the highest value for 4-ethylguaiacol with 0.25 ppm in the YM diluted sample. ´
Furthermore, the 4EG:4EP ratios of 1:7 (in YM diluted TF) and 1:6 (in water diluted TF) are close to the ones suggested in literature (Chatonnet, et al., 1992). While the 1:10 ratio in Tinta Roriz diluted with YM equals references in literature, the ratio in water diluted TR is a little different at 1:16.
Figure 17: Initial volatile phenol concentration in Tinta Roriz (TR) and Touriga Franca and amount present in diluted wine after contamination with D. bruxellensis PYCC 4801; the error bars represent the standard deviation of two
determinations (W: wine; W+YM: wine diluted with YM medium; W+W: wine diluted with water)
Compared to the two previous samples (Touriga Franca and Tinta Roriz), the Syrah wine has shown a smaller difference in volatile phenol production between water and YM diluted wine. Furthermore, as can be seen in Figure 18, the perception thresholds for ethylphenol and 4-ethylguaiacol as defined by Chatonnet et al. (1992) are not exceeded. From that however, it cannot be concluded that there is no phenolic off flavour since also the combined threshold of 0.42 ppm (Chatonnet, et al., 1992) and other factors have to be considered. Regarding the ratio 4EG:4EP which is about 1:6 in YM diluted and 1:5 in water diluted wine, it can be observed that the production of 4-ethylphenol in relation to 4-ethylguaiacol was smaller than suggested in literature (Chatonnet, et al., 1992).
Figure 18: Initial volatile phenol concentration in Syrah (SY) and the amount present in diluted wine after contamination with D. bruxellensis PYCC 4801; the error bars represent the standard deviation of two determinations (W: wine; W+YM:
The results for all four Touriga Nacional wines that were analysed are presented below in Figure 19. In two of the samples, namely TN2 und TN4, the 4-ethylphenol perception threshold as defined by Chatonnet et al. (1992) was, at least in the YM diluted sample, exceeded. Apart from TN4, the 4-ethylguaiacol concentrations either exceeded or were really close to perceivable quantities. As mentioned before, if both compounds are present in wine, in combination they are more easily perceivable and thus the off-flavour may occur even if individual threshold values are not exceeded (Chatonnet, et al., 1992). Furthermore, 4EG:4EP ratios are quite similar in all Touriga Nacional samples. They comprise ratios of 1:3, 1:4 and 1:5.
Figure 19: Initial volatile phenol concentration in Touriga Nacional wines and the amount present in diluted wines after contamination with D. bruxellensis PYCC 4801; the error bars represent the standard deviation of two determinations (W: wine; W+YM: wine diluted with YM medium; W+W: wine diluted with water)
As can be seen by comparing Figure 20 to all previous wines, in the Sousão wines the 4-ethylguaiacol quantities are much higher in relation to 4-ethylphenol. While those levels are really close or even exceeding the perception threshold, ethylphenol quantities only reach half of the amounts that are considered perceivable. However, it should be considered that these amounts of volatile phenols were obtained in (50:50) diluted wines, which may indicate that in undiluted wines higher amounts of these compounds may be produced by
Dekkera/Brettanomyces strains.
Figure 20: Initial volatile phenol concentration in Sousão wines compared to the amount present in diluted wines after contamination with D. bruxellensis PYCC 4801; the error bars represent the standard deviation of two determinations (W: wine; W+YM: wine diluted with YM medium; W+W: wine diluted with water)