The results of a visual health screening in Lisbon –
the importance of primary prevention
Mário Canastro1, Ricardo Bastos Amorim2, Ana Miguel Quintas3 1Interno de Oftalmologia, Hospital de Santa Maria, CHLN,
Docente livre da cadeira de Oftalmologia da Faculdade de Medicina de Lisboa
2Assistente, Departamento de córnea e cirurgia implanto-refrativa do Hospital Egas Moniz, CHLO 3Assistente, Departamento de córnea e superfície ocular, Hospital de Santa Maria, CHLN;
Docente livre da cadeira de Oftalmologia da Faculdade de Medicina de Lisboa
ABSTRACT
Visual health problems are a major public health burden. Preventing avoidable visual impairment and blindness is a strategic objective of the national health program for 2011-2016. Population information, primary prevention and access to ophthalmological care are major aims of this pro-gram. The purpose of this project is to present the results of a visual health screening on the city of Lisbon. Retrospective analysis of the results of a visual health screening taken between September and November 2014. Each subject filled a questionnaire concerning demographic data, past me-dical history and past ophthalmologic history. Afterwards, an ophthalmological observation was undertaken, which included visual acuity (VA) evaluation and external eye observation. Referral for further ophthalmological evaluation was performed according to observation. General visual health information was provided. A total of 1955 subjects voluntarily participated in the screening. The majority were above 55 years of age, currently retired, with a low level of education. 13.2% stated that had never been evaluated by an ophthalmologist. Arterial Hypertension and Diabetes Mellitus were the most common systemic diseases. 78.2% of the subjects had a refractive error (RE) correction. Cataract, ocular trauma and glaucoma were the most frequent past ophthalmolo-gic problems. One third of the cases had subnormal VA. 18% of the individuals who had no RE correction had a VA inferior to 20/40. 327 subjects were referred for ophthalmological evaluation. Visual health screening is a fundamental strategy to provide information to the population and an effective method to identify individuals at risk of severe visual impairment.
Keywords
Visual health screening, visual impairment, refractive error, visual acuity, primary prevention.
INTRODUCTION
Visual impairment is a major public health problem worldwide. The 2010 WHO Global Data on visual impair-ments report estimates a total of 285 million people visually impaired, from whom 39 million are blind. The majority of the visually impaired and blind people are 50 years of age or older and most of them are natural from the developing countries. The two major causes identified in this report are: uncorrected refractive errors (RE), responsible for 43% of
the cases, and cataracts responsible for 33%1.
Concerning developed countries, a population-based survey involving USA, Western Europe and Australia esti-mated that a third of persons 40 years or older suffers from a RE, projecting similar prevalence rates for year 20202. Ano-ther study, involving countries from Asia, Africa and the U.S.A. focusing in near visual impairment, reported that the majority of the population 50 years or older need near vision RE correction and the uncorrected percentage of RE ranged from 40 to 90%, in urban and rural settings, respectively3,4.
In Europe, the European Eye Epidemiology consortium estimated throw a meta-analysis of several population-based studies, that over half of the adult Europeans suffer from a refractive error, being myopia the most prevalent RE, with a growing prevalence in younger adults5. Similar results have been found in the U.S.A.6. It is also known that the refrac-tive status alters with age. Both infants, by the potentital of visual recovery if early correction is performed, and elderly, by the risk of potential vision threatening diseases, are age groups who should be addressed by screening and primary prevention measures7-9. Several differences in vision impair-ment and access to vision health care have been related to racial, education and economic factors10,11.
At national level, the National Health program to avoid visual impairment and preventable blindness reports that around 50% of the population suffers of some degree of visual impairment. Around 20% of children and half of the adult population have a significant RE. It also reports that 60% of the people 60 years of age or older have signs of cataract development, of whom 170.000 are in need of treatment. This report states that over a third of all diabe-tic patients were never or are irregularly examined by an ophthalmologist, of whom 15.000 are in risk of blinding and highlights the weight of others causes of visual impair-ment, like glaucoma, corneal and retinal diseases. This report emphasizes the importance of primary prevention and early diagnosis, establishing as key strategies to pre-vent visual impairment and prepre-ventable blindness general population information, primary prevention and prompt access to ophthalmological care12,13.
The main objectives of this study are to report the epi-demiologic results of a visual screening conducted in the metropolitan area of Lisbon and evaluate the results of the screening.
METHODS Study Sample
The sample includes 1955 individuals evaluated during a visual screening performed between September and Octo-ber 2014. The screening was performed in mobile units in several different locations, over the 24 districts of Lisbon.
Visual screening evaluation
After the identity and eligibility was confirmed, all indi-viduals signed a written informed consent to participate in the screening. Demographic data was collected, con-cerning age, gender, district of residency, education level and current professional situation. An extensive health
questionnaire was performed, concerning past medical his-tory, past ophthalmological history (refractive correction, drugs, surgery, amblyopia and trauma) and family history of ophthalmological pathologies. Subjects then underwent a screening examination that included testing of presenting visual acuity using a Sloan letters or “E” chart adapted for 10 feet. The chart provides a close approximation to the Early Treatment Diabetic Retinopathy Study (ETDRS) chart. Afterwards, external observation of the eye was per-formed by a trained nurse, to identify manifest ophthalmic abnormalities, as binocular misalignment, red reflex altera-tions and manifest eyelid or anterior segment changes.
Criteria for referral to ophthalmology consultation Subjects were referred to complete ophthalmology observation for the following reasons: important past ophthalmological diseases not evaluated for more than 2 years; presenting visual acuity worse than 20/25 in any or both eyes; presenting ophthalmological abnormalities not previously identified or studied.
Statystical analysis
Demographic data analysis was performed. Association of demographic data and past medical history and visual acuity was performed using parametric tests. SPSS version 21.0 was used.
RESULTS
Demographic data is shown in table 1. Mean age of the sample was 63.3 ±16.4 years, with minimum age of 7 years and maximum of 97 years (Graph 1). Female gender
Table 1 | Demographic data.
Age (Mean ± SD) 63.3 ±16.4 years (range 7 - 97) Gender 56.6% female43.4% male
Education level
8.3% illiterate
53.6% primary education 8.0% Lower secondary education 9.0% Intermediate secondary education 12.6% Secondary school 1.3% Bachelor 6.1% College degree 1.0% Master 0.2% Doctoral Current professional status Student 2.0% employed 20.7% unemployed 17.6% retired 59.7%
comprises 56.6% of the sample. Concerning education level, 53.6% of the individuals had a primary education level. Concerning professional status, 59.7 % of the indivi-duals were currently retired.
Results regarding last ophthalmic evaluation are on table 2. Two hundred and fifty two individuals referred that had never been evaluated by an ophthalmologist.
Concerning past medical history, 7% stated that didn´t have any kind of regular health surveillance. Past medical history data is summarized in table 3. Arterial hypertension (AH) and Diabetes Mellitus (DM) were the most frequen-tly referred diseases, accounting for 49.9% and 18% of all individuals, respectively.
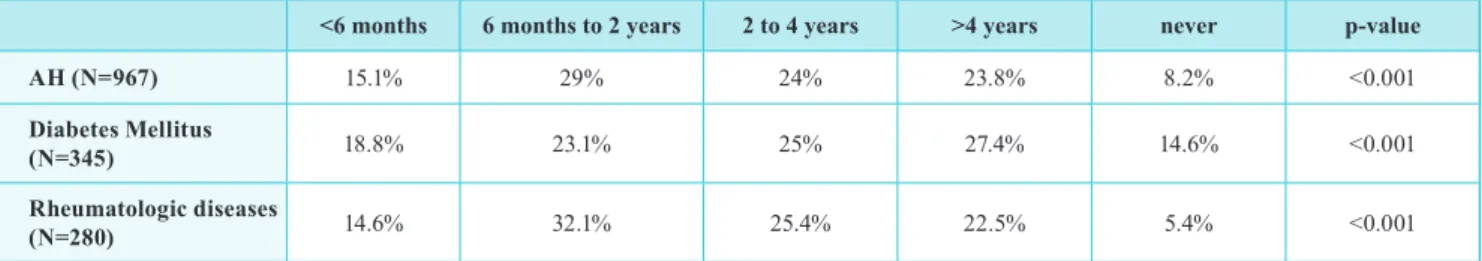
Chi-square analysis of the three most frequently refer-red past medical history diseases revealed that more than a third of the individuals had never been evaluated or had their last ophthalmological observation more than 4 years ago (table 4). In the group of patients with DM, 42% had their last ophthalmological evaluation 4 years ago or had never been evaluated.
From 967 patients with AH, 56% are not evaluated by
an ophthalmologist for more than 2 years, 8,2% have never been evaluated (p<0.001).
From 345 patients with DM, 67% are not evaluated by an ophthalmologist for more than 2 years, 14,6% have never been evaluated (p<0.001).
From 280 patients with rheumatologic disease, 53,3% are not evaluated by an ophthalmologist for more than 2 years, 5,4% have never been evaluated (p<0.001).
Regarding past ophthalmological history a total of 1533 individuals (78.4%) used RE correction. Cataract, glaucoma and diabetic retinopathy diagnosis was referred
Graph. 1 | Pyramid chart with frequencies of age for female (blue) and male (green) gender.
Table 2 | Last ophthalmological evaluation.
Less than 6 monthts 11.6%
6 months to 2 years 24.8%
2 to 4 years 24.6%
more than 4 years ago 25.8%
never 13.2%
Table 3 | Past medical history.
Systemic hypertension 49.9% yes50.1% no
Diabetes Mellitus 18% yes82% no
Reumathological diseases 14.4% yes85.6% no
Allergies 5.8% yes94.2% no
Asma 3.2% yes96.8% no
Infectious diseases 0.6% yes99.4% no
Table 4 | Past ophthalmological history.
RE correction 78.4% yes21.6% no
Ophthalmological surgery 16.6% yes83.4% no
Ophthalmological medication 14.8% yes85.2% no
Cataract 13.4% yes86.8% no
Past ocular trauma 6.1% yes93.9% no
Glaucoma 3.3% yes96.7% no
Strabismus 0.9% yes99.1% no
Diabetic retinopathy 0.8% yes99.2% no
by 13.2%, 3.3% and 0.8% of the individuals, respectively. Ocular trauma had a prevalence of 6.1% (table 5).
Chi-square analysis of the most relevant referred past ophthalmological history diseases, concerning last ophtha-lomology observation, is shown in table 6.
From 1511 individuals with RE correction, 4,6% had never been evaluated by an ophthalmology specialist (p<0.001).
From 258 individuals who referred the diagnosis of cataract, 58,5% have been evaluated at least 2 years ago (p<0.001).
From 15 patients with diabetic retinopathy, 26.7%% have not been evaluated for more than 2 years (p=0.018).
From 65 patients with glaucoma, 41,5% had an evalua-tion less than 6 months ago and 43.1% between 6 months and 2 years. 4.6% of the patients with glaucoma referred not being evaluated for more than 4 years (p<0.001).
A similar parametric analysis was performed for ophthalmological past family history data. The analysis did not result in relevant statistical differences between groups. The most relevant findings were:
• From 1093 patients with family history of refractive error, 12,2% have never been evaluated (p=0.08). • From 94 patients who reported family history of
glau-coma, 6,4% have never been evaluated (p=0.062). Considering VA score, a total of 66.6% of all right eyes and 68% of all left eyes had a VA score equal or superior to 20/25. In respect to low vision scores, 7% of all right eyes and 5,4% of all left eyes had a VA score equal or inferior to 20/60.
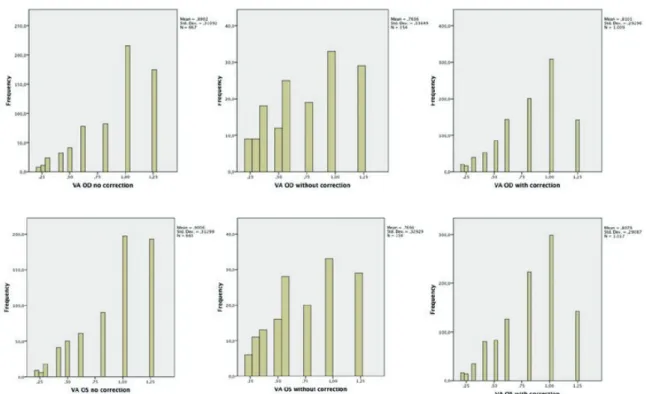
Results regarding VA analysis considering RE correc-tion are shown in graphs 2 to 7. The sample was divided in: 1) individuals who did not have a RE prescription (Graph 2 and 5); 2) individuals who were evaluated without their RE correction (Graph 3 and 6); 3) individuals evaluated with their current RE correction (Graph 4 and 7). Individuals in group 1 have the best mean VA score for both eyes, but 16.7% (OD) to 18.1% (OS) of the elements of this group had VA equal or worse than 20/40. Individuals in group 2
Table 5 | Qui-square analysis: time from ophthalmology evaluation in the setting of most frequent systemic diseases.
<6 months 6 months to 2 years 2 to 4 years >4 years never p-value
AH (N=967) 15.1% 29% 24% 23.8% 8.2% <0.001
Diabetes Mellitus
(N=345) 18.8% 23.1% 25% 27.4% 14.6% <0.001
Rheumatologic diseases
(N=280) 14.6% 32.1% 25.4% 22.5% 5.4% <0.001
Table 6 | Qui-square analysis: time from ophthalmology evaluation in the setting of several ocular morbidities.
<6 months 6 months to 2 years 2 to 4 years >4 years never p-value
RE correction (N=1511) 13.2% 28.3% 28.7% 25.3% 4.6% <0.001
Cataract (N=258) 22.5% 36.0% 24.0% 15.9% 1.6% <0.001
Diab. retinopathy
(N=15) 33.3% 40% 20% 6.7% 0% 0.018
Glaucoma (N=65) 41.5% 43.1% 10.8% 4.6% 0% <0.001
Table 7 | Comparative analysis: mean VA score with level of education. mean VA OD (N=1761) mean VA OS (N=1761) illiterate 0,62 ±0,25 0,61 ±0,25 primary education 0,78 ±0,29 0,79 ±0,29 Lower secondary education 0,96 ±0,30 0,93 ±0,29 Intermediate secondary education 0,95 ±0,29 0,94 ±0,26 Secondary school 0,96 ±0,28 0,96 ±0,30 Bachelor 0,99 ±0,24 0,97 ±0,22 College degree 0,98 ±0,29 1,03 ±0,27 Master 0,97 ±0,30 1,03 ±0,33 Doctoral 1,08 ±0,22 0,78 ±0,41 p-value <0.001 <0.001
had the worse mean VA score in both eyes. VA score was worse than 20/40 in 30,7% and 28.7% of the cases, on OD and OS, respectively.
Comparative analysis of VA results with education level and current professional status was performed throw One-Way ANOVA (Table 7 and 8). Both low level of edu-cation and unemployed or retired professional status was associated with lower VA scores (p<0.001).
Comparative analysis was performed to relate mean VA score considering last observation by an ophthalmology spe-cialist (Table 9). The mean VA score was lower in patients who we were recently observed by an ophthalmologist.
Concerning external opththalmic observation, a total of 239 individuals had visible external ophthtalmologic altera-tions, 55 of them were referred due to eyelid disease, 22 to proptosis and the reminder to anterior segment abnormalities.
A total of 327 patients were referred to further ophthal-mology evaluation and another 13 patients refused further evaluation.
DISCUSSION
This study analysed the results of a visual screening performed by health professionals in an urban setting in
Graph. 2-7 | Frequency charts of VA, for OD and OS in individuals with no RE correction, without current RE correction and with current RE correction.
Table 8 | Comparative analysis: mean VA score with cur-rent professional status.
mean VA OD (N=1766) mean VA OS (N=1766) student 1,06 ±0,23 1,07 ±0,23 employed 0,99 ±0,27 1,02 ±0,26 unemployed 0,88 ±0,30 0,89 ±0,31 retired 0,76 ±0,29 0,76 ±0,30 p value <0.001 <0.001
Table 9 | Comparative analysis: mean VA and time from last opthtalomogy evaluation.
mean VA OD (N=1746) mean VA OS (N=1746) < 6 months 0,79 ±0,308 0,79 ±0,29 6 months to 2 years 0,83 ±0,31 0,82 ±0,30 2 to 4 years 0,86 ±0,28 0,86 ±0,29 > 4 years 0,84 ±0,30 0,84 ±0,31 never 0,88 ±0,32 0,90 ±0,31 p-value 0,045 0,001
Lisbon. The sample includes mostly elder people, currently retired and with a low level of education.
More than a third of the individuals evaluated do not have an adequate follow-up with an ophthalmology spe-cialist, taking into account that more than a half was not evaluated for more than 2 years. Several studies have analyzed the importance of visual screening and have suggested that after 50 years of age a screening should be performed every two years, since the risk of developing ophthalmic diseases as primary open angle glaucoma and age-related macular degeneration increases significantly with age14.
Furthermore, the high incidence of AH and DM, disea-ses associated with severe ocular complications, increadisea-ses the relevance of regular ophthalmic evaluation. More than half of these patients were not evaluated for more than 2 years. Particularly in the case of the patients with DM, we verified that more than one third of the patients were not evaluated for more than 4 years. The importance of annual screening has been proved and is considered the standard of practice worldwide15.
The prevalence of refractive error correction was 78.4%. Similarly to other studies, RE is the major cause of visual impairment6,16-21. The importance of correcting refractive errors in infants and elderly has been extensi-vely investigated, to avoid future vision impairment in children22-26 and to improve quality of life, independence and even physical activity performance in the elderly27-29.
In this study we also verified an association between lower VA scores and lower levels of education. In fact, visual impairment, frequently caused by uncorrected RE, has been associated to lower educational and socioecono-mial levels and poorer income30-36. On other hand, visual impairment has also been found to increase the likelihood of being unemployed37. Our study verified that unem-ployed individuals had a lower VA score. It adds further proof that VA impairment is more prevalent in the unem-ployed population, probably due to reduced need of 20/20 VA score, which in turn delays the search for ophthalmo-logic evaluation. In fact vision impairment has been found to affect the individuals both socially, reducing quality of life, as physically, since it increases the risk of depres-sion, traumatic lesions and even reduces cardiorespiratory fitness38-42.
This study also found that the patients who were observed recently by an ophthalmologist had the lowest VA scores. This fact probably is due to the fact that most of the population in our sample only seeks for ophthal-mology care when vision impairment is already installed. This fact further emphasizes the importance of providing
general population with information, underlining the importance of preventing visual impairment and having a regular ophthalmic screening, particularly for those older than fifty years of age.
CONCLUSION
Visual health screening is a key element for improve-ment of primary prevention of visual impairimprove-ment. It is an effective way of screening for severe visual loss and also to provide the general population with information. Further screening initiatives can improve primary prevention in ophthalmologic care.
Aknowledgements: Screening initiative supported by
Santa Casa da Misericórdia de Lisboa, Núcleo Saúde Mais Próxima and Sociedade Portuguesa de Oftalmologia.
REFERENCES
1. WHO | Global data on visual impairment 2010. http:// www.who.int/blindness/publications/globaldata/en/. 2. Kempen JH, Mitchell P, Lee KE, et al. The prevalence
of refractive errors among adults in the United States, Western Europe, and Australia. Arch Ophthalmol (Chi-cago, Ill 1960). 2004;122(4):495-505. doi:10.1001/ archopht.122.4.495.
3. He M, Abdou A, Naidoo KS, et al. Prevalence and correction of near vision impairment at seven sites in China, India, Nepal, Niger, South Africa, and the Uni-ted States. Am J Ophthalmol. 2012;154(1):107-116.e1. doi:10.1016/j.ajo.2012.01.026.
4. He M, Abdou A, Ellwein LB, et al. Age-related pre-valence and met need for correctable and uncorrecta-ble near vision impairment in a multi-country study. Ophthalmology. 2014;121(1):417-422. doi:10.1016/j. ophtha.2013.06.051.
5. Williams KM, Verhoeven VJM, Cumberland P, et al. Prevalence of refractive error in Europe: the European Eye Epidemiology (E(3)) Consortium. Eur J Epidemiol. 2015;30(4):305-315. doi:10.1007/s10654-015-0010-0. 6. Vitale S, Ellwein L, Cotch MF, Ferris FL, Sperduto R.
Pre-valence of refractive error in the United States, 1999-2004. Arch Ophthalmol (Chicago, Ill 1960). 2008;126(8):1111-1119. doi:10.1001/archopht.126.8.1111.
7. Wang Q, Klein BE, Klein R, Moss SE. Refractive status in the Beaver Dam Eye Study. Invest Ophthalmol Vis Sci. 1994;35(13):4344-4347. http://iovs.arvojournals.
org/article.aspx?articleid=2179591.
8. Gao Z, Meng N, Muecke J, et al. Refractive error in school children in an urban and rural setting in Cambo-dia. Ophthalmic Epidemiol. 2012;19(1):16-22. doi:10.3 109/09286586.2011.632703.
9. Chou C-F, Cotch MF, Vitale S, et al. Age-related eye diseases and visual impairment among U.S. adults. Am J Prev Med. 2013;45(1):29-35. doi:10.1016/j. amepre.2013.02.018.
10. Zhang X, Cotch MF, Ryskulova A, et al. Vision Health Disparities in the United States by Race/Eth-nicity, Education, and Economic Status: Findings From Two Nationally Representative Surveys. Am J Ophthalmol. 2012;154(6):S53-S62.e1. doi:10.1016/j. ajo.2011.08.045.
11. Zadnik K, Congdon NG. Author response: what to do about racial disparities in access to glasses among children in the US? Invest Ophthalmol Vis Sci. 2015;56(1):106. doi:10.1167/iovs.14-16055.
12. DGS. Programa Nacional para a Saúde da Visão. 2005;2005.
13. SPO: Educação para a Saúde Visual | Plano Nacional de Saúde 2012 - 2016. http://pns.dgs.pt/spo/.
14. Medical Association Secretariat. Routine eye exami-nations for persons 20-64 years of age: an evidence--based analysis. Ont Health Technol Assess Ser. 2006;6(15):1-81.
15. Nentwich MM, Ulbig MW. Diabetic retinopathy - ocu-lar complications of diabetes mellitus. World J Diabe-tes. 2015;6(3):489-499. doi:10.4239/wjd.v6.i3.489. 16. Ferraz FH, Corrente JE, Opromolla P, Schellini SA.
Influence of uncorrected refractive error and unmet refractive error on visual impairment in a Brazi-lian population. BMC Ophthalmol. 2014;14:84. doi:10.1186/1471-2415-14-84.
17. Uribe JA, Swenor BK, Muñoz BE, West SK. Uncor-rected Refractive Error in a Latino Population: Proyecto VER. Ophthalmology. 2011;118(5):805-811. doi:10.1016/j.ophtha.2010.09.015.
18. Taylor HR, Xie J, Fox S, Dunn RA, Arnold A-L, Keeffe JE. The prevalence and causes of vision loss in Indige-nous Australians: the National IndigeIndige-nous Eye Health Survey. Med J Aust. 2010;192(6):312-318. http://www. ncbi.nlm.nih.gov/pubmed/20230347.
19. Robinson B, Feng Y, Woods CA, Fonn D, Gold D, Gor-don K. Prevalence of Visual Impairment and Uncorrec-ted Refractive Error – Report from a Canadian Urban Population-based Study. Ophthalmic Epidemiol. 2013. 20. Pan C-W, Klein BEK, Cotch MF, et al. Racial varia-tions in the prevalence of refractive errors in the United
States: the multi-ethnic study of atherosclerosis. Am J Ophthalmol. 2013;155(6):1129-1138.e1. doi:10.1016/j. ajo.2013.01.009.
21. Maini R, Keeffe J, Weih LA, McCarty CA, Taylor HR. Correction of refractive error in the Victorian popula-tion: the feasibility of “off the shelf” spectacles. Br J Ophthalmol. 2001;85(11):1283-1286.
22. Ying G, Maguire MG, Cyert LA, et al. Prevalence of vision disorders by racial and ethnic group among children participating in head start. Ophthalmology. 2014;121(3):630-636.doi:10.1016/j.ophtha.2013.09. 036.
23. Manny RE, Sinnott LT, Jones-Jordan LA, et al. Pre-dictors of adequate correction following vision scree-ning failure. Optom Vis Sci. 2012;89(6):892-900. doi:10.1097/OPX.0b013e318255da73.
24. Kemper AR, Bruckman D, Freed GL. Prevalence and distribution of corrective lenses among school-age chil-dren. Optom Vis Sci. 2004;81(1):7-10.
25. Kemper AR, Wallace DK, Zhang X, Patel N,
Crews JE. Uncorrected distance visual impairment among adolescents in the United States. J Ado-lesc Health. 2012;50(6):645-647. doi:10.1016/j. jadohealth.2011.10.012.
26. Kodjebacheva G, Brown ER, Estrada L, Yu F, Cole-man AL. Uncorrected refractive error among first-grade students of different racial/ethnic groups in southern California: results a year after school-mandated vision screening. J Public Health Manag Pract. 17(6):499-505. doi:10.1097/PHH.0b013e3182113891.
27. Owsley C, McGwin G, Scilley K, Meek GC, Seker D, Dyer A. Effect of refractive error correction on health--related quality of life and depression in older nur-sing home residents. Arch Ophthalmol (Chicago, Ill 1960). 2007;125(11):1471-1477. doi:10.1001/archopht. 125.11.1471.
28. Thiagalingam S, Cumming RG, Mitchell P. Factors associated with undercorrected refractive errors in an older population: the Blue Mountains Eye Study. Br J Ophthalmol. 2002;86(9):1041-1045.
29. Willis JR, Jefferys JL, Vitale S, Ramulu PY. Visual impairment, uncorrected refractive error, and accele-rometer-defined physical activity in the United States. Arch Ophthalmol (Chicago, Ill 1960). 2012;130(3):329-335. doi:10.1001/archopthalmol.2011.1773.
30. Varma R, Wang MY, Ying-Lai M, Donofrio J, Azen SP. The prevalence and risk indicators of uncorrected refrac-tive error and unmet refracrefrac-tive need in Latinos: the Los AngelesLatino Eye Study. Invest Ophthalmol Vis Sci. 2008;49(12):5264-5273. doi:10.1167/iovs.08-1814.
31. Qiu M, Wang SY, Singh K, Lin SC. Racial Dispa-rities in Uncorrected and Undercorrected Refractive Error in the United States. Invest Ophthalmol Vis Sci. 2014;55(10):6996-7005. doi:10.1167/iovs.13-12662. 32. Muñoz B, West SK, Rodriguez J, et al. Blindness, Visual
Impairment and the Problem of Uncorrected Refractive Error in a Mexican-American Population: Proyecto VER. Invest Ophthalmol Vis Sci. 2002;43(3):608-614. 33. Marmamula S, Keeffe JE, Rao GN. Uncorrected refrac-tive errors, presbyopia and spectacle coverage: results from a rapid assessment of refractive error survey. Ophthalmic Epidemiol. 16(5):269-274.
34. Macias EP, Lee DA, Oelrich FO. Refractive errors and visual acuity impairment among self-selected Hispanic, white, and black adults examined by the UCLA Mobile Eye Clinic. J Am Optom Assoc. 1999;70(11):724-734. 35. Liou HL, McCarty CA, Jin CL, Taylor HR.
Preva-lence and predictors of undercorrected refractive errors in the Victorian population. Am J Ophthalmol. 1999;127(5):590-596.
36. Budenz DL, Bandi JR, Barton K, et al. Blindness and visual impairment in an urban West African population: the Tema Eye Survey. Ophthalmology. 2012;119(9):1744-1753. doi:10.1016/j.ophtha.2012.04.017.
37. Sherrod CE, Vitale S, Frick KD, Ramulu PY. Associa-tion of vision loss and work status in the United Sta-tes. JAMA Ophthalmol. 2014;132(10):1239-1242; quiz 1243-1246. doi:10.1001/jamaophthalmol.2014.2213. 38. Coleman AL, Yu F, Keeler E, Mangione CM. Treatment
of uncorrected refractive error improves vision-specific
quality of life. J Am Geriatr Soc. 2006;54(6):883-890. doi:10.1111/j.1532-5415.2006.00817.x.
39. Loprinzi PD, Zebardast N, Ramulu PY. Cardiorespira-tory Fitness and Vision Loss Among Young and Middle--Age U.S. Adults. Am J Heal Promot. 2015;29(4):226-229. doi:10.4278/ajhp.131001-ARB-500.
40. McClure TM, Choi D, Wooten K, Nield C, Becker TM, Mansberger SL. The Impact of Eyeglasses on Vision--Related Quality of Life in American Indian/Alaska Natives. Am J Ophthalmol. 2011;151(1):175-182.e2. doi:10.1016/j.ajo.2010.06.043.
41. Vitale S, Schein OD, Meinert CL, Steinberg EP. The refractive status and vision profile: a ques-tionnaire to measure vision-related quality of life in persons with refractive error. Ophthalmology. 2000;107(8):1529-1539.
42. Zhang X, Bullard KM, Cotch MF, et al. Association between depression and functional vision loss in per-sons 20 years of age or older in the United States, NHA-NES 2005-2008. JAMA Ophthalmol. 2013;131(5):573-581. doi:10.1001/jamaophthalmol.2013.2597.
Os autores não têm conflitos de interesse a declarar.
Trabalho não publicado cedendo os direitos de autor à Sociedade Portu-guesa de Oftalmologia.
CONTACTO Mário Canastro