ISSN 1678-4324 Online Edition BIOLOGY AND TECHNOLOGY A N I N T E R N A T I O N A L J O U R N A L
The Photovoltaic Generation and its Energy Contribution
and Demand Shifting at the Center Headquarters of the
Federal University of Technology - Paraná - Campus
Curitiba
Juliana D’Angela
Mariano
1*,Jair Urbanetz Junior
1,21 Programa de Pós-Graduação em Engenharia Civil, Universidade Tecnológica Federal do Paraná, Curitiba,
Brazil; 2 Programa de Pós-Graduação em Sistemas de Energia, Universidade Tecnológica Federal do Paraná, Curitiba, Brazil.
ABSTRACT
Distributed photovoltaic (PV) generation is characterized by the application of several small power plants in urban centers. This form of energy deserves special mention due to the possibility of installation in existing areas such as roofs and facades. Thus, the implementation of these systems represents positive modifications of the urban scenario, with the adhesion of PV modules, presenting much smaller social and environmental impacts than that of large conventional plants. In this sense, this study aims at analyzing the demand and consumption curves of the Center headquarters buildings of Federal University of Technology - Paraná (UTFPR) in Curitiba, by applying the COPEL’s CAS Hemera platform, in order to determine the potential for implementation of grid-connected photovoltaic systems in this premise, because they allow the cost reductions in electric power. The first UTFPR’s grid-connected photovoltaic system was introduced in December 2011, at the Center’s headquarters, in one of the blocks of the university, which by the end of 2016 generated a total of 11.67 MWh of electricity. This paper proposes an expansion scenario for the existing grid-connected photovoltaic system, using the available coverage showing the shifting or reduction of energy demand peaks and the energy contribution to UTFPR's Center headquarters.
Keywords: distributed generation, photovoltaic generation curves, solar irradiation.
INTRODUCTION
One of the greatest challenges of this century is present in the electricity generation sector. Several problems, such as dependence on fossil fuels, availability/reliability of the electric system and climate change, can influence the energy supply, especially in the case of hydroelectric plants, which depend on the water levels of the reservoirs. Consequently, these adversities enabled the "sustainability transitions" in the electricity sector, through the application of new energy systems, allowing great leaps in environmental efficiency1.
In this context, Brazil, according to2 Silva holds the leading position regarding the use
of renewable energy sources and highlights the enormous Brazilian hydroelectric potential, which corresponds to more than two thirds of the total installed capacity of the country . Although there are many advantages in the use of water resources, the predominance of this source makes the electrical system dependent on hydrological conditions. In addition, the intensive droughts of recent years have contributed to the low levels of the reservoirs. In 2015, the Brazilian energy sector did not experience an energy crisis after the country's economic recession, which led to the adoption of matrix diversification strategies in order to increase energy security and guarantee the electricity supply.
In addition, the investment costs for the implementation of hydroelectric plants are high, about US $ 1,420/ kW and the average construction time ranges from four to five years. These plants have a lifespan of at least 30 years, which can be extended with the modernization and increase of turbines and generators2. In Brazil, this source
accounts for more than 60% of installed capacity, with the largest power plant being the Itaipu hydroelectric dam with 14 GW generation capacity3. However, there are
several renewable energy sources from primary sources, free and abundant on the earth's surface4, which is the case of photovoltaic solar energy.
Photovoltaic solar energy is obtained through the direct conversion of solar radiation into electricity. Despite the robustness of these systems, they are extremely simple in design and require little maintenance. The greatest advantage of the application of these systems is their modularity and autonomy in operation, being applied as a power source in water pumping systems, power supply in remote locations, communications, satellites and space vehicles, power generation in commercial and residential buildings in the urban environment and even for large scale power plants, in the megawatts scale5.
In this sense, photovoltaic systems can be divided between isolated systems, which are normally installed in places without access to the power grid, and need an energy storage element, which in this case are batteries; and grid-connected photovoltaic systems, which are the object of this research. They are seen as a form of generation distributed along the distribution network feeders, in low or medium voltage, and contribute to the availability of energy near the point of consumption6.
In the Brazilian scenario, photovoltaic power plants are still not very representative, since they have an installed capacity of about 0.02% in the energy matrix, with 39 photovoltaic plants and approximately 23 MWp, a small amount when compared to the country potential7. However, in 2017 this scenario presented a significant advance
due to ANEEL´S reserve auctions.
On the other hand, after the implementation of the ANEEL 482 regulations, there was a significant increase of micro installations (up to 75 kW), and mini (up to 5 MW) photovoltaic plants in Brazil. According to ANEEL9, until July 2017, there were
system, predicts that by 2024, around 1.2 million consumer units will start producing their own energy, totaling 4.5 GW of installed power10.
The grid-connected photovoltaic system (GCPVS) of the UTFPR’s Center headquarters in Curitiba presents an installed power of 2.1 kWp (10 KYOCERA modules of polycrystalline silicon technology, model KD210GX-LP connected in series) and a single-phase inverter in 220V of 2 kW nominal power (PVPOWERED model PVP2000). The PV system on the roof of the building, takes up, for that panel, only 15sqm², and the PV panels are are installed with 15º of angle and azimuthal deviation of 22º to the west, following the roof of the building. Figure 1 shows the monthly energy values generated by this system, since its implementation.
Figure 1 –Electricity Generation (kWh / month) in Green Office (GO) for the years 2012 to 2016
Analyzing the operation of this system in the years 2012 to 2016, there was a total generation of approximately 11 MWh in this period. The monitoring in these nearly five years of operation of the GCPVS in the Center headquarters confirms that this system is of high reliability, since it operates uninterrupted since its installation, cleanly and quietly and does not require any additional area, since the photovoltaic panel is installed on the roof of the building 11. Thus, based on the results obtained
previously, it is proven that this is the most promising form of generation distributed to the urban environment.
It is important to highlight that the grid-connected photovoltaic system installed at the Center headquarters has met technical standards related to the subject, such as NBR 16274: 2014 – GCPVS, ABNT NBR 11876: 2010 - Photovoltaic Modules, Module 3 of PRODIST.
MATERIAL AND METHODS
The study of the feasibility of the expansion of the existing grid-connected
photovoltaic system, included several steps described below. In this sense, the first step refers to the survey of the solar resource, which was done through the Brazilian Atlas of Solar Energy12, which presents values of solar irradiation for the inclined
plane for the longitude and latitude of the place, calculation of monthly and annual energy.
Figure 2 –Radiasol with Irradiation Values in the Horizontal Plan of the Center’s Headquarters of the UTFPR
Afterwards, the criterion of choice of the typical days for consumption and demand analysis was used, adopting typical days of irradiation, using INMET meteorological data in 2016 and coinciding with university busy days14.
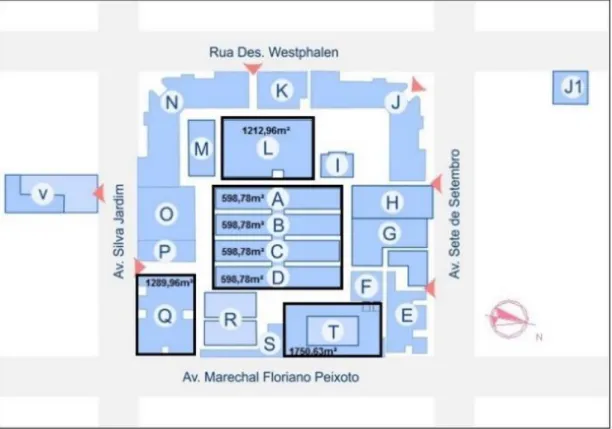
Thus, the analysis of the coverage areas, ie roofs and locations available for the allocation of the photovoltaic modules at the Neoville headquarters, is carried out by means of the evaluation of the floor plans made available by the Department of Projects (DEPRO) of the UTFPR campus Curitiba and survey in loco , aiming also to avoid the aesthetic commitment of the building, and at the same time to determine the photovoltaic potential of the campus.
Thus, it was possible to calculate the GCPVS sizing, which can be started from the available area and the area of the photovoltaic modules, according to Equation 115.
mod mod
Area Area
N avai l
(1)
Where:
Nmod: number of modules;
Areaavail: available area;
Areamod: area of modules added to the spacing area avoiding shading between rows.
From the power of the module and its quantity it is possible to calculate the value of the installed peak power of the panel or arrangement, according to Equation 215.
mod mod N
P
PPV (2)
Where:
PPV: installed peak photovoltaic power (Wp);
Pmod: power of the modules;
Nmod: number of modules.
G PR H P
E PV TOT
(3)
Where:
E: average daily electrical energy (Wh / day); PPV: installed peak photovoltaic power (Wp);
HTOT: monthly average daily solar irradiation for the locality in question (Wh /
m².day);
PR: Performance Fee or Performance Ratio, typically between 70 and 80% (75% for this analysis);
G: irradiance in the Standard Test Conditions (1,000 W / m²).
From the monthly values of electric energy produced by the grid-connected photovoltaic system calculated in Equation 3, it is possible to analyze the contribution of the proposed photovoltaic generator in relation to the energy produced and overlapping the photogenerated power curve with the demand curve, making it possible to identify the possible contribution in reduction of peak demand.
In order to collect data on the consumption and energy demand, that is, mass memories of the electric energy meter of the Neoville headquarters, the platform called CAS Hemera16 was used.
In terms of reduction of energy consumption, a parameter for analysis of the results will be the Energy Penetration Level (EPL), calculated according to Equation 4.
100 SE PVPL E E ELP (4) Where:
EPVPL: Energy generated by the photovoltaic system with determined Penetration
Level (NP), over a day or year (MWh);
ESE: Energy consumed by the Consumer Unit (CU) under study, over a day or year
(MWh).
For the calculation of the energy generated by the photovoltaic system with determined NP, during one day (MWh), Equation 5 is used.
EPVPLPPVPLHTOTA365PR (5)
Where:
EPVPL: Energy generated by the photovoltaic system, with a certain NP, throughout the
year, GWh;
PPVPL: Peak photovoltaic power, defined as NP (MWp);
HTOTA: average annual solar irradiation for the city of Curitiba (Wh / m².day);
PR: Performance Ratio or system performance rate, considered equal to 0.75.
The parameter applied for the demand reduction analysis is an analysis of the Effective Load Capacity Factor (ELCF), which consists of subtracting from the peak of the demand curve of this day the peak of the curve equivalent to the demand of the feeder in question when the grid-connected photovoltaic systems are inserted and soon after dividing this value by the grid-connected photovoltaic system installed nominal capacity, as shown in Equation 617.
100 PVPL DMAXPV DMAX P P P
ELCF (6)
Where:
PDMAX: Maximum demanded power in the day without the photovoltaic contribution;
PDMAXPV: Maximum demanded power in the day with the photovoltaic contribution;
PPVPL: Peak photovoltaic power, defined as PL (MWp).
RESULT AND DISCUSSION
Table 1 shows the values of the inclined plane irradiation, obtained through Radiasol program, considering 23º for inclination of the photovoltaic panel and azimuthal deviation from the 22º place (West).
Table 1 - Radiation Data on the Inclined Plane to Center’s Headquarters
INCLINED PLANE IRRADIATION (RADIASOL) - kWh/m².day
ANG AZI. DEV. JAN FEB MAR ABR MAY JUN JUL AUG SEP OCT NOV DEC ANNUAL 23º 22º(W) 5.53 5.46 5.27 4.51 3.74 3.67 3.88 4.82 4.56 5.10 5.84 5.72 4.84 Data acquired through the Brazilian Atlas of Solar Energy13 and modified to inclined plane by the Radiasol14 software
Additionally, a survey of the daily radiation values incident in the city of Curitiba was carried out in March and June 2016, a period that includes the academic calendar of the institution and approaching summer and winter. In these measurements, the typical days of maximum and minimum irradiation obtained were days 03/17/2016 and 06/15/2016 respectively, and these will be used in this analysis.
Table 2 - shows the irradiance values obtained on these dates from the INMET meteorological data.
Date Irradiation Daily Irradiation (kWh/m².day)
03/17/2016 Typical 5.75
06/15/2016 Typical 3.83
Table 2 - Typical Days Selected
Data acquired through the INMET15 database
Figure 3 -Selected Areas of Center’s Headquarters
For the design of the GCPVS proposed, the photovoltaic module of Hareon Solar was used, with a power of 330 Wp, which presents an area of 1.94m². However, it is necessary to enlarge the area, that is, the distance between modules, in order to avoid shading between the rows (1.65m²), reaching a total area required per module of 3.45 m². Hence, Equation 1 was applied, obtaining the number of modules equal to 1,957.
² 45 . 3
² 500 , 6
m m
Nmód Nmód1,957
With the number of modules it is possible to calculate the power of the photovoltaic generator by applying Equation 2, obtaining an installed power of 645,81 kWp.
967 , 1 330
PV
P PPV645,81kWp
Therefore, with the value of the installed power, annual average irradiance obtained in the Brazilian Atlas of Solar Energy for the inclined plane and Performance Ratio of 0.75, it is possible to estimate, through Equation 3, the values of average monthly and annual electricity generation described in MWh in Table 3.
1 75 . 0 84 . 4 81 ,
645
E E2,344.29kWh/day
Table 3 - Monthly and Annual Average Power Generation of the Neoville Headquarters POWER GENERATION (MWh)
JAN FEB MAR ABR MAY JUN JUL AUG SEP OCT NOV DEC ANNUAL
83.03 74.05 79.13 65.53 56.16 53.33 58.26 72.37 66.26 76.58 84.86 85.89 855.67
Note that the estimated daily energy is 2,344.29 kWh/day, while the total annual value to be produced by a grid-connected photovoltaic system is 855.67 MWh/year. The proposed analysis made the determination of the potential for photovoltaic generation of the Center headquarters of UTFPR possible, resulting in a system approximately 307,5 times larger than the existing photovoltaic system. Based on this result, it is proposed a scenario of expansion of the existing system at headquarters, extrapolating the obtained power values (307,5x) on the days listed for the analysis.
Table 4 shows the consumption data for this site, as well as the total photogenerated energy considering the instantaneous grid-connected photovoltaic system inverter (increased by 307,5) installed in this site and the respective percentages of energy reduction for the days listed for the analysis, where the month of March presented greater potential for energy reduction in general, due to the greater availability of solar irradiation.
Table 4 –Consumption, Photogenerated Energy, and Reduction Percentage of Center’s Headqaurters
Date Total Daily
Consumption (kWh)
Total Photogenerated Energy (kWh)
Reduction Percentage (%)
03/17/2016 41,328 2,387 5.8%
06/15/2016 36,676 2,085 5.7%
Values calculated considering the GCPVS proposed.
According to Table 4, the typical irradiation days of March and June present an equivalent energy reduction potential, but due to this high energy consumption, its reduction percentages have been reduced.
Figure 4 shows the UTFPR demand curve for the selected day, obtained in the CAS Hemera platform. According to the graphs generated by the CAS Hemera platform, the demand provided by COPEL, measured at UTFPR's Center headquarters, showed a peak value of demand for electricity at 16:00 hours, registered a value of 2,486 kW on 03/17/2016. However, for a typical day of irradiation in June, the time of greatest demand occurred also at 16:00 hours registered a power of 2,340 kW on 06/15/2015.
Figure 5 shows the behavior of the demand that would be observed at the Center headquarters on 03/17/2016 and 06/15/2016 considering the existence of the GCPVS proposed of 645,81 kWp.
The overlapping of demand curves provided with the calculated power was obtained, resulting in a considerable change in demand behavior over the course of the day. In this sense, the possibility of occurrence of shifting of the energy peak demand in the local power grid in the period of 17:00 hours respectively can also be noticed.
Figure 5 –New Demand Curve
The total energy consumed in this headquarter in 2016 was 6,442.28 MWh and the energy generated by a grid-connected photovoltaic system of 645,81 kWp would be 855,67 MWh. Applying analysis parameters by calculating the Energy Penetration Level (EPL), Equation 4:
100 28 , 442 . 6
67 ,
855
EPL EPL13.28%
Therefore, from the application of this equation we obtained an EPL of 13.28% reduction of electricity with the implementation of a system of 645.81 kWp.
Table 5 - Calculation of LFEF for Center Headquarters
Effective Load Capacity Factor (645.81 kWp)
Day Demand New Demand LFEF (%)
03/17/2016 2,846 2,802 6.8
06/15/2016 2,340 2,316 3.7
Values calculated considering the GCPVS proposed
According to the data presented in Table 5, it is observed that the maximum reduction of demand peaks occurs on 03/17/2016, resulting in a ELCF of 6.8%. However, on 06/15/2017, this reduction occurs, whether to a lesser extent with only 3.7%.
CONCLUSION
Through the proposed methodology, it was identified that the Center headquarters of UTFPR presents a significant area available for expansion of the existing GCPVS, with the installed power 307.5 times greater than the existing grid-connected photovoltaic system of 2.1 kWp. With regards to EPL, a significant level of energy reduction was achieved with the implementation of the grid-connected photovoltaic
system proposed. Through the choice of the typical days the LFEF was identified,
varying positively in the reduction of peak demand depending on the available solar irradiation condition for the selected day.
It should be emphasized that the proposed scenario used the power profile provided by the existing grid-connected photovoltaic system 2.1 kWp at UTFPR's Center headquarters and in operation since December 2011, so the system proposed of 645.81 kWp will effectively cause a change in the profile of the curve of university demand as demonstrated in the analyzed days.
As the proposal of this research adopted methodologies that allow greater gain in PV generation, through shading analysis and application of more efficient conversion technologies, such as the application of high efficiency inverters and PV modules with higher efficiency, the generation curve PV will certainly have a longer range of solar utilization. Therefore, the proposed GCPVS will effectively change the profile of the demand curve of the university according to the analyzed days.
Therefore, the study indicates that the insertion of a GCPVS at the institution, will contribute to the reduction of the costs with electric energy due to the energy contribution of this system, and also, especially in the days of high solar incidence, there will be a change in the profile of the demand curve, and may even shift or reduce its peak.
REFERENCES
1- Verbong GPJ, Geels F. Exploring sustainability transitions in the electricity sector with socio-technical pathways. Technological Forecasting & Social Change. 2010; n. 77, p. 1214-1221.
2- Silva RC, Neto IM. Seifert SS. Electricity supply security and the future role of renewable energy sources in Brazil. Renewable and Sustainable Energy Reviews. 2016; n. 59, p. 328-341. 3- Mariano JD, Santos FR, Brito GW, Casagrande Jr EF, Urbanetz Jr J. Hydro, thermal and photovoltaic power plants: A comparison between electric power generation, environmental impacts and CO2 emissions in the Brazilian scenario. International Journal of Energy and Environment. 2016; v. 7, n. 4, p 347-356.
5- Parida B, Iniyan S, Goic R. A review of solar photovoltaic Technologies. Renewable and Sustainable Energy Reviews. 2011; n. 15, p. 1625-1636.
6- Urbanetz Jr J. Photovoltaic Systems Connected to Urban Distribution Networks: Their Influence on the Quality of Electric Power and Analysis of Parameters That May Affect Connectivity. [Thesis], 2010; 189. Portuguese.
7- National Electrical Energy Agency: Energy Matrix of Brazil - [cited 2016 Feb 05].
Available from:
http://www2.aneel.gov.br/aplicacoes/capacidadebrasil/OperacaoGeracaoTipo.asp?tipo=12&ger =Combustivel&principal=Solar
8- Enel Green Power will build photovoltaic plants in the country. EXAME. 2015 Feb 19; Business.
9- National Electrical Energy Agency: Distributed Micro and Mini Generators Records made effective at ANEEL - [cited 2017 May 17]. Available from: http://www2.aneel.gov.br/scg/rcgMicro.asp
10- National Electrical Energy Agency: ANEEL extends possibilities for micro and distributed mini generation - [cited 2017 May 16]. Available from: http://www2.aneel.gov.br/aplicacoes/noticias/Output_Noticias.cfm
?Identidade=8955&id_area=90
11- Urbanetz Jr J, Tiepolo GM, Casagrande Jr EF, Tonin FS, Mariano JD. [Photovoltaic Distributed Generation: The Case of UTFPR Photovoltaic Systems in Curitiba]. Congresso Brasileiro de Planejamento Energético. 2016 Sep 26-28;12(5). Portuguese.
12- Pereira EB, Martins FR, Abreu SL, Rüther R. Brazilian Atlas of Solar Energy. São José dos Campos: INPE; 2006. p. 60.
13- UFRGS. Softaware “RADIASOL”. [cited 2017 Jun 22]. Available from: http://www.solar.ufrgs.br/.
14- National Institute of Meteorology [cited 2016 Aug 5]. Available from: http://www.inmet.gov.br
15- Urbanetz JR J. [Photovoltaic solar energy: fundamentals and design of systems] 2012; p. 12. Portuguese.
16- Power Telemetry System [cited 2016 Aug 5]. Available from: http://telemedicao.copel.com/hemera/ hemera.jsp.
17- Rebechi SH. [The potential of solar photovoltaic generation connected to the urban distribution system: case study for a feeder with peak daytime load]. [Dissertation], 2008; 100. Portuguese.