ISSN: 1809-4430 (on-line) www.engenhariaagricola.org.br
Received in: 1-19-2018 Accepted in: 7-3-2018
Doi: http://dx.doi.org/10.1590/1809-4430-Eng.Agric.v38n5p805-812/2018
TECHNICAL PAPER
SIMULATION OF DISTANCE BETWEEN FIELD AND REPLENISHMENT PUMP IN
MECHANIZED SPRAYING OF SUGARCANE (
Saccharum
spp.)
Neisvaldo B. dos Santos
1*1*Corresponding author.Universidade Federal do Piauí - UFPI / Bom Jesus - PI, Brasil. Doutorando em Engenharia Agrícola
(Engenharia de Sistemas Agrícolas) pela Universidade Federal do Ceará - UFC / Fortaleza - CE, Brasil.
E-mail: [email protected]
KEYWORDS
cost, agricultural
mechanization,
computational model,
hydraulic sprayers,
planning and
management.
ABSTRACT
Brazil is the world’s largest producer of sugarcane destined for mills. Spraying in
sugarcane plantations is carried out in extensive cultivation areas and with self-propelled,
tractor-driven, and aerial hydraulic equipment. For this, a good positioning of the
replenishment pump of agricultural defensives close to the field where the spraying is
carried out is necessary. However, it is desirable that the replenishment be carried out at
short distances between the field and replenishment pump. This study aimed to assess the
impact of the distance between the field and replenishment pump on the operational cost
of hydraulic sprayers for sugarcane farming practices. Due to the difficulty in
accomplishing the work and meeting the objective under field conditions, we decided to
develop a computational model called
“TratoCana”
in a spreadsheet and programming
language. The model was verified for possible routine errors, validated, and used in the
analysis of factors and in the generation of scenarios. The results showed that the
increased average distance between the field and replenishment pump has a negative
impact on the operational and economic performance of the machine.
INTRODUCTION
In Brazil, the sugarcane planted area is estimated at 8.61 million hectares in the 2018/2019 season, which represents a total production of 625.96 million tons (CONAB, 2018).
The mechanized spraying system of sugarcane has its productive functioning in the field and auxiliary operation in the roads, the place where the replenishment with agricultural defensives occurs. For this, spraying machines need to run a distance between the field and replenishment pump. However, this distance influences the auxiliary time, especially the equipment service operational time. According to Santos et al. (2015a), the service operational time expresses the managerial conditions for the equipment to perform the operation considering several means of execution such as the distance between the field and replenishment pump.
According to Santos et al. (2015a), the service operational time is composed of productive, accessory, auxiliary, inaptitude, lost, and worked time. These times
represent the field efficiency (FE) of the machine in the system. For Araldi et al. (2013); Banchi et al. (2008a); Barbosa et al. (2015); Cervi et al. (2015); Jokiniemi et al. (2012); Oduma et al. (2015); Linhares et al. (2012); Ma et al. (2015); Nascimento et al. (2016); Neres et al. (2012); Rivera et al. (2012); Simões et al. (2011) and Yousif et al. (2013), this is the ratio between effectively used time and total time for equipment operation. The operational time Santos et al. (2015a); Shamshiri & Ismail (2013) and Zhou et al. (2015) and Çanakci et al. (2011); Civelek & Say (2016); Santos et al. (2015b); Santos et al. (2014a) and Zaied et al. (2014) have a participation in the equipment operational performance, which has a direct influence on the economic performance.
However, due to the relevance of the distance between the field and replenishment pump in the operational and economic performance of mechanized spraying system. The aim of this study is to assess the impact caused by the distance between the field and replenishment pump on the operational cost of hydraulic sprayers for sugarcane farming practices.
MATERIAL AND METHODS
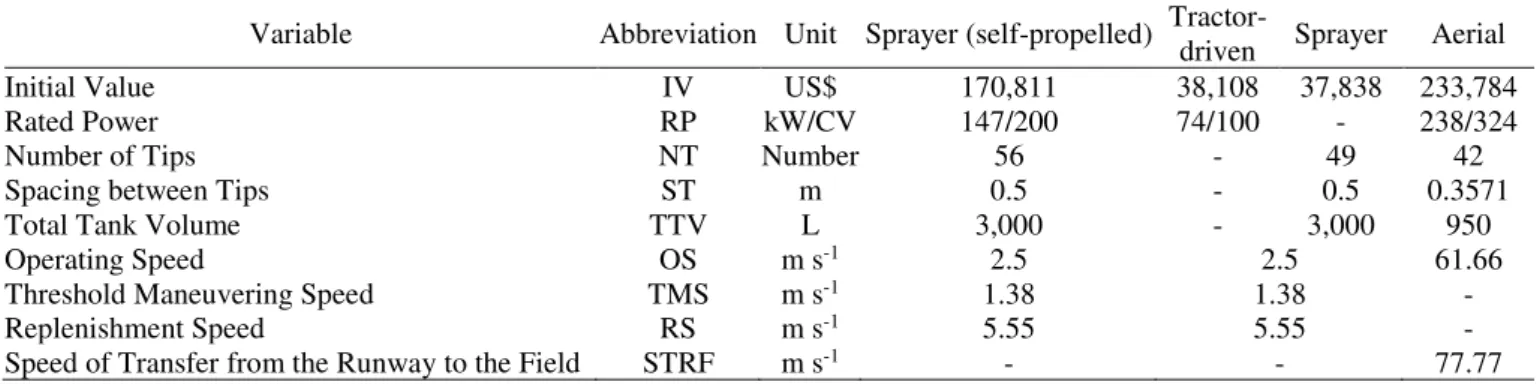
We considered a model scenario for a mill, called Fictitious Mill, with an area of 22,000 ha. Spraying system consisted of self-propelled, tractor-driven, and aerial hydraulic sprayers. The economic, technical, and operational characteristics of the equipment are shown in Table 1.
TABLE 1. Economic, technical, and operational variables of the equipment.
Variable Abbreviation Unit Sprayer (self-propelled)
Tractor-driven Sprayer Aerial
Initial Value IV US$ 170,811 38,108 37,838 233,784
Rated Power RP kW/CV 147/200 74/100 - 238/324
Number of Tips NT Number 56 - 49 42
Spacing between Tips ST m 0.5 - 0.5 0.3571
Total Tank Volume TTV L 3,000 - 3,000 950
Operating Speed OS m s-1 2.5 2.5 61.66
Threshold Maneuvering Speed TMS m s-1 1.38 1.38 -
Replenishment Speed RS m s-1 5.55 5.55 -
Speed of Transfer from the Runway to the Field STRF m s-1 - - 77.77
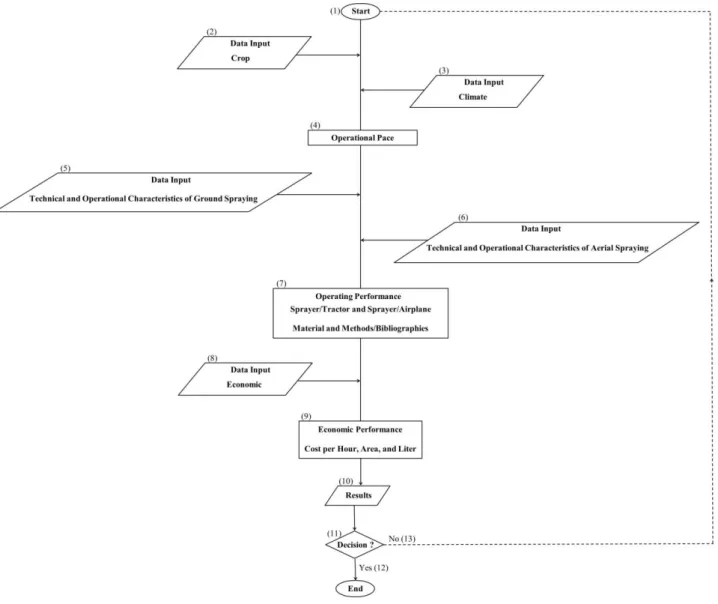
A computational model called “TratoCana” Version 2.0 was developed aiming at meeting the basic characteristics of mechanized spraying for sugarcane cultivation. The model is based on the flowchart shown in Figure 1, elaborated according to the symbology proposed by (Oakland, 2007).
The “TratoCana” Version 2.0 was developed in an
Excel® spreadsheet and Visual Basic® programming language. The model begins its functioning (1)2 with the crop data input (2), such as the area to be sprayed. The item (3) refers to the climate data input total number of days to perform spraying, working day, relative air humidity, air temperature, and wind speed. Crop and climate data resulted in the operational pace (4).
Data input (5) refers to the technical/operational characteristics of ground spraying number of tips, spacing between tips, tip flow, replenishment time, average distance between the field and replenishment pump, average length of cultivation strip, operating speed,
threshold maneuvering speed, replenishment speed, total volume of the sprayer tank, field efficiency, and others.
Data input (6) refers to the technical/operational characteristics of aerial spraying number of tips, spacing between tips, tip flow, replenishment time, average distance between the field and replenishment pump, average distance between the field and runway, average length of cultivation strip, operating speed, speed of transfer from the runway to the field, effective strip width, time of each return curve, ground time between each flight, aerial application rate, total volume of the sprayer tank, field efficiency, and others.
The operational pace associated with technical/operational characteristics of spraying determines the sprayer3 operational performance, tractor-driven sprayer, and airplane (7): time available, operational field capacity (OFC), application volume, total application flow rate, total displacement and replenishment time, total distance traveled, machine-hour, and number of equipment required.
_______________________________________________ 2 The numbers in parentheses refer to the flow chart of Figure 1.
FIGURE 1. General flow chart of the computational model.
The results of the operational performance associated with the economic data input of machines (8)
initial value, final value, useful life in years and hours, interest per year, lodging, insurance, and taxes (LIT), fuel consumption, repair factor and maintenance, among
others, allow calculating the economic performance (9), which refers to the cost per hour, area, and liter.
Model results (10) allow the user to assess the operational and economic performance of mechanized spraying and decide (11) on viability (12) or not. In case the spraying is not feasible for the user (13) or the user choose to assess another scenario, new data should be inserted.
Agroclimatic factors
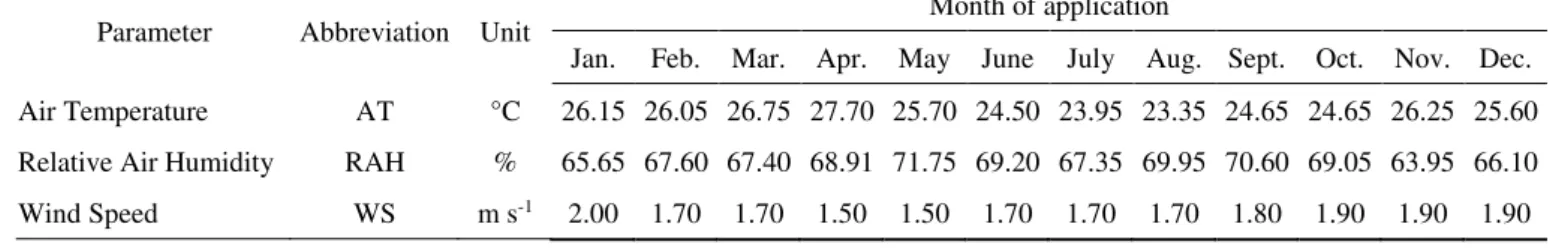
Climate factor in the sugarcane mill was defined as the number of working days inappropriate for spraying (NWDIS), as the methodology proposed by (Santos, 2017). This methodology considers agroclimatic parameters such as relative air humidity (RAH), wind speed (WS), and air temperature (AT).
TABLE 2. Average values of the agroclimatic parameters.
Parameter Abbreviation Unit Month of application
Jan. Feb. Mar. Apr. May June July Aug. Sept. Oct. Nov. Dec.
Air Temperature AT °C 26.15 26.05 26.75 27.70 25.70 24.50 23.95 23.35 24.65 24.65 26.25 25.60
Relative Air Humidity RAH % 65.65 67.60 67.40 68.91 71.75 69.20 67.35 69.95 70.60 69.05 63.95 66.10
Wind Speed WS m s-1 2.00 1.70 1.70 1.50 1.50 1.70 1.70 1.70 1.80 1.90 1.90 1.90
Source: CECA/UFAL
The number of working days inappropriate for spraying (NWDIS) was considered in the time available (TA), as the methodology of (Mialhe, 1974).
Operational performance
The operational performance of the sprayer and tractor-driven sprayer were based on the proposals of (Mialhe, 1974; Santos et al., 2014b). The purpose of these proposals is to define the number of equipment necessary to spray agricultural defensive in the sugarcane of the Mill. The number of machines (NM) was calculated by the ratio between the operational pace (OP) and the operational field capacity (OFC) of the equipment.
The operational pace (OP) was calculated by the ratio between the area to be sprayed (AS) and the time available to perform the agricultural operation (TA).
The operational field capacity (OFC) was calculated by associating the total boom width (TBW), operating speed (OS), and field efficiency (FE).
The volume of spraying solution to be applied is in accordance with the proposal of (Matuo et al., 2010). The application volume (AV) was calculated by the ratio between the tip flow (TF), spacing between tips (ST), and operational speed (OS).
The total application flow rate (TAF) was defined by the association of application volume (AV) and operational field capacity (OFC).
The displacement time for replenishment (DTR) corresponded the round trip time to the field. The displacement time was calculated by the ratio of the average distance between the field and replenishment pump (ADFRP) and the replenishment speed (RS).
The total time for displacement and replenishment (TTDR) corresponded to the time spent on going, replenishing in the pesticide tank, and returning to the field. The total time was calculated by the sum of the displacement time for replenishment (DTR) and replenishment time (RT).
The number of replenishments (NR) was defined by the ratio between the application volume (AV), area to be sprayed (AS), and total tank volume (TTV) of the equipment.
The threshold maneuvering distance (TMD) was determined by the turning radius of the threshold maneuvering (TRTM).
The threshold maneuvering time (TMT) was calculated by the ratio between the threshold maneuvering distance (TMD) and the threshold maneuvering speed (TMS).
The number of threshold maneuvering (NTM) was defined by the ratio between the area to be sprayed (AS), total boom width (TBW), and the average length of cultivation strip (ALCS).
The operational performance of the airplane is also in accordance with the proposal of Mialhe (1974) and Santos et al. (2014b) to define the number of required equipment, as described for the sprayer and tractor-driven sprayer.
The operational field capacity (OFC) of the airplane is in accordance with the adjusted proposal of (Araújo, 2009). It is calculated by associating the total volume of the sprayer tank (TVST), application volume (AV), distance between the runway and the field (DRF), speed of transfer from the runway to the field (STRF), effective strip width (ESW), operating speed (OS), time of each return curve (TERC), average length of cultivation strip (ALCS), and ground time between each flight (GTEF).
Economic performance of sprayer
The total cost of the sprayer (TCS) was determined by the association between the operational cost of the sprayer (OCS) and the area to be sprayed (AS).
The operational cost of the sprayer (OCS) was defined as the ratio between the hourly cost of the sprayer (HCS) and the operational field capacity (OFC).
The operational cost of the sprayer application (OCSA) was determined by the ratio between the hourly cost of the sprayer (HCS) and the total application flow rate (TAF).
The hourly cost of the sprayer (HCS) was calculated by the sum of the fixed hourly cost of the sprayer (FHCS) and the variable cost of the sprayer (VCS). The fixed hourly cost of the sprayer (FHCS) was calculated according to the methodology proposed by ASABE (2011), defined as the ratio between the annual fixed cost (AFC) and the number of hours worked per year (NHWY).
The variable cost of the sprayer (VCS) was defined by the sum of the cost of fuel (CF) and the cost of repair and maintenance (CRM).
The calculation of sprayer fuel consumption was adapted from Banchi et al. (2008b) by adopting the average values of consumption by motor power range of agricultural tractors.
The calculation of cost with repair and maintenance (CRM) and repair factor and maintenance (RFM) of sprayer are in accordance with (ASABE, 2011).
Economic performance of tractor-driven sprayer
The fixed hourly cost of the tractor-driven sprayer (FHCTS) was calculated according to the methodology proposed by ASABE (2011), as the hourly fixed cost was calculated for the self-propelled sprayer.
The variable cost of the tractor-driven sprayer (VCTS) was determined by the sum of the cost of the tractor fuel (CTF) and the repair and maintenance of machines (CRM).
For calculating the tractor fuel consumption, the average values of consumption by motor power range of the tractor were considered as proposed by (Banchi et al., 2008b).
The calculation of cost with repair and maintenance (CRM) and repair and maintenance factor (RMF) of the tractor-driven sprayer are in accordance with (ASABE, 2011).
Economic performance of the airplane
The total (TCA), operational (OCA), application operational (AOCA), and hourly (HCA) costs of the airplane were calculated as for the self-propelled and tractor-driven sprayers.
The fixed hourly cost of the airplane (FHCA) was calculated according to the methodology proposed by ASABE (2011), as calculated for the self-propelled and tractor-driven sprayers.
The variable cost of the airplane (VCA) was determined by the sum of the costs with fuel (CFA) and repair and maintenance of the airplane (CRM).
For airplane fuel consumption, an average value was considered according to the best power to be used and higher working regime, as in (EMBRAER/NEIVA, 2012).
The calculation of cost with repair and maintenance of the airplane (CRMA) is in accordance with (ASABE, 2011). The repair and maintenance factor (RMF) of the equipment is in accordance with the data provided by (PBA AVIATION, 2012).
Validation
The “TratoCana” Version 2.0 was validated by comparing the simulation results with raw (primary) data obtained in the field and with the bibliography data (secondary). The sensitivity and consistency analysis of the computational model was performed by the cost.
RESULTS AND DISCUSSION
Considering the average values of agroclimatic parameters of the Mill, which is related to the agroclimatic conditions of Rio Largo, AL, Brazil, in 2014, the number of working days inappropriate for spraying (NWDIS) and time available (TA) presented values of 257 days and 2,583 hours, respectively.
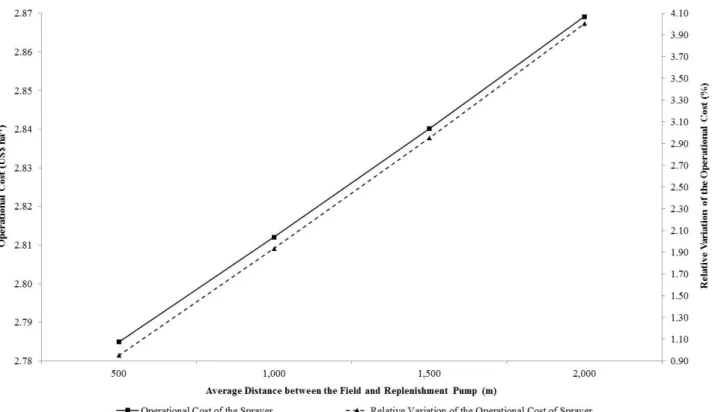
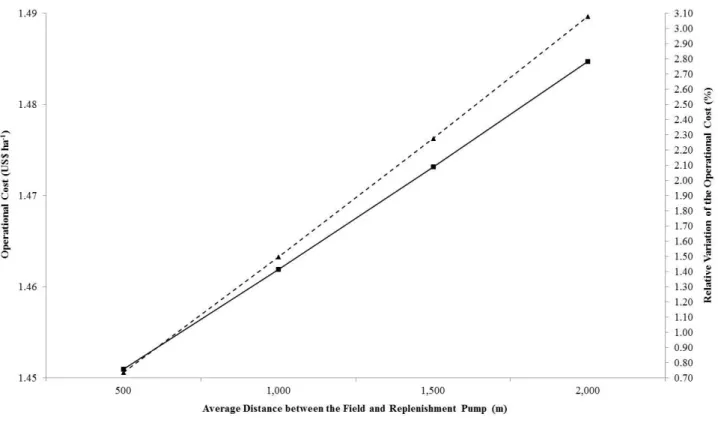
According to the results of the model scenario, the average distance between the field and replenishment pump influences the operational cost of the sprayer (Figure 2). The increased distance led to a linear increase in cost.
FIGURE 2. Operational cost of the sprayer and relative variation of the operational cost as a function of the average distance between the field and replenishment pump.
Although cost has a linear increase as distance increases, it has a slight influence on cost variation as it increases. In the distance of 500 m, operational cost variation was 0.95%, whereas, in 1,000 m, it was 1.93%. In the distance of 1,500 m, cost variation was only 2.95%, while in 2,000 m it was 4.00%, which represents a
difference of 3.05% in relation to 500 m.
FIGURE 3. Operational cost of the tractor-driven sprayer and relative variation of the operational cost as a function of the average distance between the field and replenishment pump.
In the distance of 500 m, operational cost variation was 0.74% and in 1,000 m, it was 1.50%. For the distance of 1,500 m, cost variation was 2.28% whereas, in 2,000 m, it was 3.08%, which represents a difference of 2.34% in relation to the distance of 500 m.
According to the model scenario (Figures 2 and 3), the increased distance has a negative impact (variation) in the cost due to the time required (auxiliary hours) to go
through the distance, which is a direct influence on the worked hours by machines.
The average distance between the field and
replenishment pump has an interference with the operational cost of the airplane (Figure 4). The increased
distance presents a linear increase in the operational cost of the equipment.
In the distance of 10,000 m, cost variation increased by 11.59%, while in 20,000 m, this increase was 23.19%. For 30,000, 40,000, and 50,000 m, cost variation was 34.81, 46.44, and 58.07%, respectively. In this case, the negative impact on the operational cost of the machine occurs because the increased distance reduces the operational field capacity and hence the cost increase.
CONCLUSIONS
The increased average distance between the field and replenishment pump is disadvantageous to the operational cost of the machine.
Mills must adopt an excellent management method in order to facilitate the means of execution for the replenishment of agricultural defensives.
REFERENCES
Araldi PF, Schlosser JF, Frantz UG, Ribas RL, Santos PM dos (2013) Eficiência operacional na colheita mecanizada em lavouras de arroz irrigado. Ciência Rural 43(3):445-451. DOI:
http://dx.doi.org/10.1590/S0103-84782013000300011
ASABE - American Society of Agricultural and Biological Engineers (2011) Agricultural machinery management data ASAE D497.7. In: ______. ASABE Standards, 8p.
Araújo EC (2009) Aviação agrícola: voando alto. Cultivar Máquinas (82):20-24.
Balastreire LA (1990) Máquinas agrícolas. Manole, 307p.
Banchi AD, Lopes JR, Zago CA (2008a)Estudo de eficiência das colhedoras de cana-de-açúcar.Revista Agrimotor (32):8-9.
Banchi, AD, Lopes JR, Zago CA (2008b) Uso anual e consumo de combustível em frotas agrícolas.Revista Agrimotor (39):8-10.
Barbosa LP, Siqueira W da C, Abrahao SA, Conceição JL da, Oliveira CA da C (2015) Desempenho operacional e análise de custo do conjunto mecanizado no preparo do solo para plantio florestal. Enciclopédia Biosfera 11(21):746-763.
Çanakci M, Unal I, Topakci M (2011) Development of computer software for determination of optimum tractor power and machinery sizes. Journal of Agricultural Machinery Science 7(4):415-420.
Cervi RG, Esperancini MST, Silva, HOF, Isler PR, Oliveira PA (2015) Avaliação do desempenho operacional da colheita e transbordo de cana-de-açúcar (Saccharum spp.). Revista Energia na Agricultura 30(3):232-241. DOI: http://dx.doi.org/10.17224/EnergAgric.2015v30n3p232-241
Civelek C, Say SM (2016) A web-based decision support system to select proper machinery size and tractor power. Turkish Journal of Agriculture and Forestry 40(4):512-525.
CONAB - Companhia Nacional de Abastecimento (2018) Acompanhamento da safra brasileira: cana-de-açúcar, primeiro levantamento (área plantada e produção). CONAB. Available:
https://www.conab.gov.br/component/k2/item/download/1 7727_4e54c5103a0ab4a15529e35307c79b2e. Accessed: Jun 29, 2018.
EMBRAER/NEIVA - Empresa Brasileira de Aeronáutica (2012) Especificações: características principais ipanemão 100% etanol. EMBRAER/NEIVA. Available in:
http://www.embraeragricola.com.br/Documents/Spec_FIN AL%20APROVADO.pdf. Accessed: Nov 30, 2016.
Hunt D (1995) Farm power and machinery management. Iowa State University Press, 363p.
Jokiniemi T, Rossner H, Ahokas J (2012) Simple and cost effective method for fuel consumption measurements of agricultural machinery. Agronomy Research 10:97-107.
Linhares M, Sette Júnior CR, Campos F, Yamaji FM (2012) Eficiência e desempenho operacional de máquinas harvester e forwarder na colheita florestal. Pesquisa Agropecuária Tropical 42(2):212-219. DOI:
http://dx.doi.org/10.1590/S1983-40632012000200007
Ma S, Scharf PA, Karkee M, Zhang Q (2015) Performance evaluation of a chopper harvester in Hawaiian sugarcane fields. Transactions of the ASABE 58(2):271-279. DOI: http://dx.doi.org/10.13031/trans.58.10834
Matuo T, Pio LC, Ramos HH, Ferreira LR (2010) Proteção de plantas: tecnologia de aplicação dos agroquímicos e equipamentos. UFV, 73p.
Mialhe LG (1974) Manual de mecanização agrícola. Agronômica Ceres, 301p.
Nascimento EMS, Amorim MQ, Araújo KLB, Chioderoli CA, Oliveira JLP (2016) Desempenho operacional de um conjunto microtrator-rotoencanteirador. Nucleus
13(2):291-300. DOI:
http://dx.doi.org/10.3738/1982.2278.1654
Neres J de S, Santos R de S, Moreira DA, Silva RM da (2012) Desempenho operacional de um trator agrícola e suas implicações de uso em alguns atributos físicos de um latossolo amarelo em Altamira-PA. Engenharia Ambiental 9(3):62-77.
Oakland J (2007) Gerenciamento da qualidade total tqm. Nobel, 459p.
Oduma O, Igwe JE, Ntunde DI (2015) Performance evaluation of field efficiencies of some tractor drawn implements in Ebonyi State. International Journal of Engineering and Technology 5(4):199-204.
PBA AVIATION (2012) Conheça o ipanema. PBA AVIATION. Available in:
http://www.pbaaviation.com.br/index.php?option=com_co ntent&view=article&id=58&Itemid=58&showall=1. Accessed: Feb 3, 2014.
Rivera R, Sánchez N, Ríos G (2012) Determinación de la eficiencia de campo para el sistema de máquinas de alza y transporte en el ingenio pantaleón utilizando diagramas cíclicos, en la zafra azucarera 2010/2011. Nexo Revista Científica 25(2):54-58. DOI:
http://dx.doi.org/10.5377/nexo.v25i2.676
Santos NB, Cavalcante DS, Fernandes HC, Gadanha Júnior CD (2014a) Simulação da eficiência de campo da colheita mecanizada de cana-de-açúcar (Saccharum spp.). Revista Energia na Agricultura 29(1):09-13. DOI: http://dx.doi.org/10.17224/EnergAgric.2014v29n1p09-13
Santos NB dos, Cavalcante DS, Fernandes HC, Gadanha Júnior CD (2015a) Tempo é dinheiro. Cultivar Máquinas (149):36-38.
Santos NB dos, Fernandes HC, Gadanha Júnior, CD (2015b) Economic impact of sugarcane (Saccharum spp.) loss in mechanical harvesting. Científica 43(1):16-21. DOI:
http://dx.doi.org/10.15361/1984-5529.2015v43n1p16-21
Santos NB dos, Silva RP, Gadanha Junior CD (2014b) Economic analysis for sizing of sugarcane (Saccharum spp.) mechanized harvesting. Engenharia Agrícola 34(5):945-954. DOI: http://dx.doi.org/10.1590/S0100-69162014000500013
Simões D, Silva MR da, Fenner PT (2011) Desempenho operacional e custos da operação de subsolagem em área de implantação de eucalipto. Bioscience Journal
27(5):692-700.
Shamshiri R, Ismail WIW (2013) Exploring gps data for operational analysis of farm machinery. Research Journal of Applied Sciences, Engineering and Technology 5(12):3281-3286.
Yousif LA, Dahab MH, El Ramlawi HR (2013) Crop-machinery management system for field operations and farm machinery selection. Journal of Agricultural Biotechnology and Sustainable Development 5(5):84-90. DOI: http://dx.doi.org/10.5897/JABSD2013.0205
Zaied MB, El Naim AM, Mahmoud TE (2014) Computer modeling for prediction of implement field performance variables. World Journal of Agricultural Research 2(2):37-41. DOI: http://dx.doi.org/10.12691/wjar-2-2-1