(Annals of the Brazilian Academy of Sciences)
Printed version ISSN 0001-3765 / Online version ISSN 1678-2690 www.scielo.br/aabc
Fermentation characteristics in stirred-tank reactor of exopolysaccharides with hypolipidemic activity produced by Pleurotus geesteranus 5#
MAO DUOBIN1, MA YUPING2, GENG LUJING1, ZHAO AIJING3, ZHENG JIANQIANG1 and XU CHUNPING1*
1
College of Food and Biological Engineering, Zhengzhou University of Light Industry, 450002, Henan, China 2
China Tobacco Henan Industrial Co. Ltd, Zhengzhou, 450016, Henan, China 3College of Life Sciences, Henan Normal University, 450002, Henan, China
Manuscript received on February 4, 2013; accepted for publication on June 16, 2013
ABSTRACT
In this study, the hypolipidemic effect of exopolysaccharides (EPS) from Pleurotus geesteranus 5# fermenting liquor by the optimal culture conditions in a 5-L stirred-tank reactor was investigated. The hypolipidemic effect of the polysaccharide, investigated in streptozotocin induced diabetic mice, decreased plasma glucose, total cholesterol and triacylglycerol concentrations by 17.1 %, 18.8 % and 12.0 %, respectively. The results of the present investigation strongly demonstrate the potential of this polysaccharide to prevent hyperglycemia in the experimental animals. Under optimal culture conditions, the maximum concentrations of mycelial and EPS were 22.63 g/L after 7 d cultivation and 11.09 g/L after 10 d, respectively. Furthermore, the morphological parameters (i.e. mean diameter, circularity, roughness and compactness) of the pellets and the broth viscosity were characterized. It was proved that compactness of the pellet morphology (R2=0.963, p<0.01) was significantly and positively determined with mycelial biomass. Moreover, mean diameter (R2=93.3, p<0.01) and broth viscosity (R2=0.950, p<0.01) were
significantly and positively determined with EPS content.
Key words: exopolysaccharides, Pleurotus geesteranus, fermentation, hypolipidemic effect, morphology.
Correspondence to: Chun-Ping Xu E-mail: [email protected]
INTRODUCTION
Modern pharmacological studies have shown that polysaccharide from medical fungi with a wide variety of medicinal applications. In particular, hypolipidemic and hpyerglycemic activities of polysaccharide from many fungi have been documented, which are hotspots of research on functional factors of health food and medicines
with high efficiency and low toxicity (Hwang
et al. 2005, Hwang and yun 2010). Recently,
submerged fermentation has received great interest
as a promising technique for efficient production of
exopolysaccharides (EPS) with the hypolipidemic effect extracted from fermentation broth of medicinal fungi (Song et al. 1998, yang et al. 2006).
Filamentous fungal morphology is an important
parameter which influences the physical properties
in submerged fermentation. The rheological
behavior was influenced by the morphology and
key to improved yield of the desired product (Cerri and Badino 2012, yesilada et al. 1998).
Pleurotus geesteranus is a species that is
that is getting the popularity lately because of
its very pleasant flavour, richness of dietary fibre and high quality of proteins. The extract of
P. geesteranus has anticancer and antioxidant
activities (Wang et al. 2011, Zhang et al. 2011). However, to our knowledge, there is no report about the hypolipidemic effect of P. geesteranus
polysaccharide.
The aim of the present work was to evaluate the hypolipidemic activity of P. geesteranus 5# EPS in male Kunming mice. Furthermore, EPS production kinetics by P. geesteranus 5# was investigated in a stirred-tank reactor, and the possible relationship between physical parameters (i.e. mycelial morphology and broth viscosity) and metabolite production (biomass and EPS) during fermentation was revealed.
MATERIALS AND METHODS
MICROORGANISM AND GROWTH CONDITIONS
P. geesteranus 5# was obtained from the Henan
Province Microbiological Culture Collection Center (HPMCC no. 197787-5#) and was used throughout this study. Stock cultures were maintained on potato dextrose agar (PDA) slants. The seed culture was
grown in a 250 mL flask containing 50 mL of GP
medium (0.3% peptone, 3% glucose) at 26 °C on a rotary shaker incubator (150 rpm) for 4 d. Inoculum was prepared by the method as the same as previous works (He et al. 2013).
ANIMAL EXPERIMENTS AND INDUCTION OF DIABETES
5-week old male Kunming mice was obtained from Henan Experimental Animal Center (Zhengzhou, China) were housed individual in stainless steel cages and acclimatized with free access to food and water for at least 1 week in an air conditioned room (23 ± 2°C with 55 ± 5% humidity) and a 12 h cycle of
light and dark. The mice were fed with a commercial pellet diet (Henan Experimental Animal Center) throughout the experimental period.
After one week of acclimatization in the growth room, they were brought into the growth room. Diabetes was induced by intramuscular injection of streptozotocin (Sigma Chemical Co., Louis, MO) dissolved in 0.1 M sodium citrate buffer (pH 4.5) at a dose of 50 mg/kg body weight (Hwang et al. 2008). Two days after injection of diabetogenic agent (streptozotocin), fasting blood glucose was determined and the mice with more than blood glucose >300 mg/dL were included in the group of diabetics. At the end of oral administration, the
animals were fasted for 9 h and then sacrificed.
All procedures were conducted in accordance with the “Guide for the Care and Use of Laboratory Animals” approved by Zhengzhou University of Light Industry.
ANIMAL EXPERIMENTAL DESIGN AND ANALyTICAL MEASUREMENTS
All the animals were randomly divided into three groups with eight animals in each group (Table I): normal group, normal mice received 0.9% NaCl solution; control group, STZ-induced diabetic mice treated with 0.9% NaCl solution; diabetic EPS-treated group, diabetic mice high-EPS-treated with P. geesteranus 5# EPS from a stirred-tank reactor at the level of 200 mg/kg body weight using an oral daily dose for three weeks. On the basis of our preliminary test result (doses of 100 and 200 mg/kg) and other experimental designs by several investigators who used natural sources for diabetic therapy (normal dose ranges: 100-300 mg/kg), 200 mg/kg was chosen as a suitable dose for this experiment (Hwang et al. 2005, Hwang and yun, 2010).
plasma glucose level was measured using glucose oxidase kit (Biosino Bio-technology And Science Inc, Beijing, China). Total cholesterol, triglyceride levels were measured using a CHOD-PAP method (Biosino Bio-technology And Science Inc, Beijing, China) (Henry, 1974). HDL cholesterol was evaluated by enzymatic test kits (Biosino Bio-technology And Science Inc, Beijing, China)
using PEG-modified enzymes (Okada et al. 2001).
LDL cholesterol and atherogenic index (AI) were calculated by the following equations:
LDL cholesterol = total cholesterol – HDL cholesterol – (triglyceride/5)
AI = (total cholesterol – HDL cholesterol)/ HDL cholesterol
HTR = HDL cholesterol/total cholesterol
FERMENTATIONS IN BIOREACTORS
4% (v/v) of mycelial suspensions was carried out in a 5-L stirred-bank (Infors, Switzerland). Unless
otherwise specified, fermentations were performed
under the following optimized conditions: 60.0 g maltose, 5.0 g tryptone, 1 mM NaCl, 5 mM KH2PO4, and initial pH 6.0 at 28 °C, agitation speed 150 rpm, aeration rate 2 vvm, working volume 3 L, cultivation time 11d. Samples were taken aseptically at intervals for analyses (He et al. 2013). All experiments were performed in triplicate to ensure the trends observed were reproducible.
DETERMINATION OF MyCELIAL DRy WEIGHT AND EPS PRODUCTION
The methods to determine mycelial dry weight and EPS concentration were the same as previous works (Bae et al. 2000). The EPS produced from the stirred-tank reactor was used for the animal experiments.
MEASUREMENTS OF THE VISCOSITy AND MORPHOLOGy The viscosity measurements were performed on samples collected from bioreactor at regular intervals
using a Broolfield programmable LVD-VII + digital viscometer fitted with a disc-spindle impeller and
a small sample adapter. For a given sample liquid, the shear rate on the impeller is proportional to the impeller speed. Apparent viscosity was obtained
from the meter reading; shear rate γ was calculated
from its relationship with an impeller speed. For
most fermentation liquids, the shear stress τ is related to the shear rate γ by the simple power law
model of Ostwald–de Waele,
τ = K • γn = η a • γ (1)
where K is the consistency index, and n is the
flow behavior index. K and n were determined from logarithmic plots of ηa versus γ (Sinha et al. 2001).
The morphological properties of the samples collected were evaluated using an image analyzer (DT2000 System, China) with software linked to a light microscope (Nikon, Japan) through a
CCD camera. Samples were fixed with an equal volume of fixative (13 ml of 40% formaldehyde,
5 ml glacial acetic acid, 200 mL of 50% ethanol).
An aliquot (0.1 mL) of each fixed sample was
transferred to a slide, air dried, and then stained with methylene blue (0.3 g of methylene blue, 30 ml of 95% ethanol in 100 mL water). For each sample, the morphology of pellet was characterized by measuring the area and perimeter of the pellet core and the maximum diameter of the pellet.
Normally, a 40-fold magnification was used. The
morphology of the pellets was characterized by their mean diameter, circularity, roughness and
Group Oral administration
Normala None
Controlb 0.9% NaCl
EPSb 200 mg/kg•d P. geesteranus 5# EPS
TABLE I
Experimental groups for dose-dependent hypolipidemic activity of P. geesteranus 5#
EPS.
a
compactness. The circularity was estimated as the ratio of the Fieret’s minimum diameter to the Fieret’s maximum diameter of the pellets or aggregates. The compactness was estimated as the ratio of the projected area of the hyphae in a clump to the projected convex area of that clump,
the latter being the area after filling internal voids
and concavities in the clump’s external perimeter. In addition, the roughness (R) was measured using the following equation: R = (pellet/aggregate
perimeter)2/(4π×pellet area) (Park et al. 2001).
STATISTICAL ANALySIS
Data were expressed as mean ± S.D. Group means were compared by one-way analysis of variance (ANOVA) test using the Statistical Package of the Social Science (SPSS) version 11.0 (SPSS Inc., Chicago, IL, USA). Group means were considered
to be significantly different at P < 0.05. Using the Pearson coefficient analysis was used to analyze the coefficient of determination (R2) and evaluate the relationship between EPS content and mean diameter, circularity, and roughness.
RESULTS AND DISCUSSION
HyPOLIPIDEMIC EFFECT OF EPS
In this study, the hypolipidemic effects of EPS from
P. geesteranus 5# in streptozotocin-induced diabetic mice were evaluated with respect to that of the saline
administered control group. The final organ weights
of the experimental animals are showed in Table II. By the end of the experiment in week 3, the weight
of liver decreased significantly by administration of EPS. However, the EPS treatment had no influence
on kidney, spleen and pancreas weight, compared to the Normal and Control groups. Moreover, oral administration of the EPS caused no changes in gross behavior and none of the animals died, which indicated that there were no harmful effects in the mice cause by oral administration of the EPS of P.
geesteranus 5# . The effect of EPS on the blood
glucose level in streptozotocin-induced diabetic mice over 3 week period is depicted in Table III. The
blood glucose level dropped 17.1 % significantly
when the EPS was administered. It has been reported that the streptozotocin treatment caused degranulation or reduction of insulin secretion by the
pancreas was through selective destruction of β-cells
in the pancreatic islets (Benwahhoud et al. 2001). It seems that EPS repair the damage of the pancreatic
β-cells that initially survived streptozotocin toxicity
or behaving as an insulin-like factor to promote insulin synthesis and thus lowered the level of plasma glucose (yang et al. 2006).
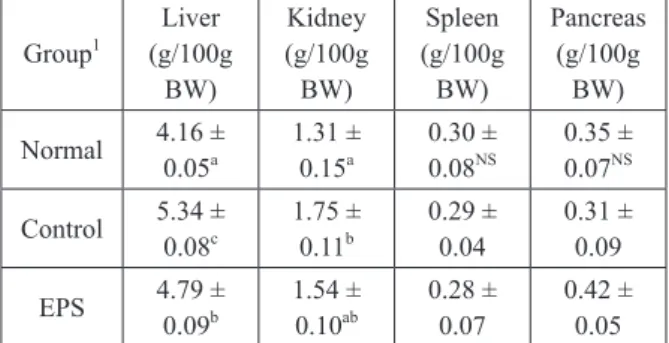
TABLE II
Effect of P. geesteranus 5# EPS on the various organs in streptozotocin-induced diabetic mice for 3 weeks.
Group1 Liver (g/100g BW) Kidney (g/100g BW) Spleen (g/100g BW) Pancreas (g/100g BW) Normal 4.16 ±
0.05a 1.31 ± 0.15a 0.30 ± 0.08NS 0.35 ± 0.07NS Control 5.34 ±
0.08c 1.75 ± 0.11b 0.29 ± 0.04 0.31 ± 0.09 EPS 4.79 ±
0.09b 1.54 ± 0.10ab 0.28 ± 0.07 0.42 ± 0.05 1
See Table I. Each value is the mean ± SE (n = 8). a,b,cValues
with different superscript letters in the same column signifi-cantly different among the groups at p<0.05.
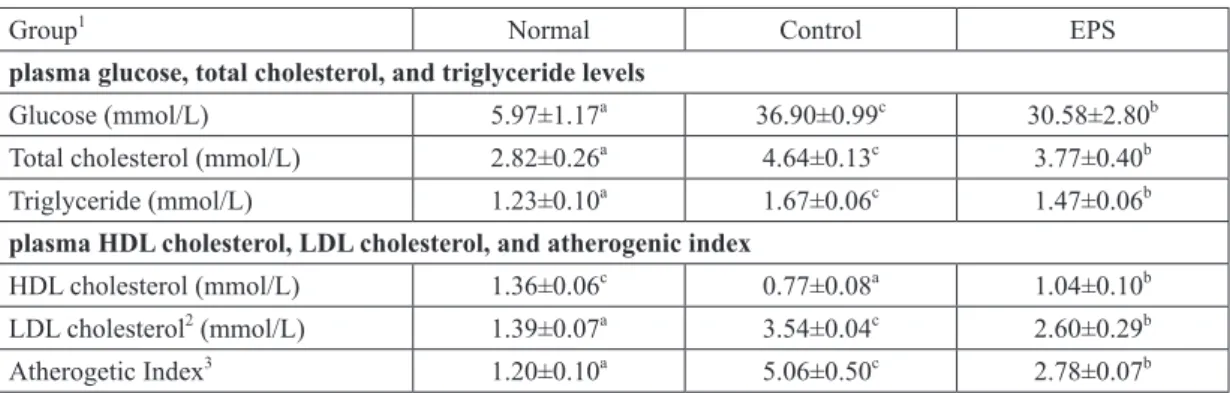
TABLE III
Effect of P. geesteranus 5# EPS on plasma glucose, total cholesterol, triglyceride levels, plasma HDL cholesterol, LDL cholesterol, atherogenic index in streptozotocin-induced diabetic mice for 3 weeks.
Group1 Normal Control EPS
plasma glucose, total cholesterol, and triglyceride levels
Glucose (mmol/L) 5.97±1.17a 36.90±0.99c 30.58±2.80b
Total cholesterol (mmol/L) 2.82±0.26a 4.64±0.13c 3.77±0.40b
Triglyceride (mmol/L) 1.23±0.10a 1.67±0.06c 1.47±0.06b
plasma HDL cholesterol, LDL cholesterol, and atherogenic index
HDL cholesterol (mmol/L) 1.36±0.06c 0.77±0.08a 1.04±0.10b
LDL cholesterol2 (mmol/L) 1.39±0.07a 3.54±0.04c 2.60±0.29b
Atherogetic Index3 1.20±0.10a 5.06±0.50c 2.78±0.07b
1See Table I. 2Total cholesterol - HDL cholesterol - (Triglyceride/5). 3(Total cholesterol - HDL cholesterol)/ HDL cholesterol. Each value is mean ± SE for 8 mice. a,b,cValues with different superscript letters in the same column
significantly different among the groups at p<0.05.
(Van Horn 1996). This hypolipidemic activity might act through the stimulation of pancreas cells, which are able to enhance insulin secretion by binding to
sulfonylureas receptors on the β-cell (Bolkenta et
al. 2000, Hwang et al. 2008).
Table III also shows the effect of EPS on the LDL cholesterol, HDL cholesterol and atherogenic index in streptozotocin-induced diabetic mice. In comparison with the control group, the HDL cholesterol level, LDL cholesterol and atherogenic index were substantially increased by the oral administration of the EPS of P. geesteranus 5# by 35.1 %, 26.6 % and 45.1 %, respectively. These results suggest that P. geesteranus 5# EPS might behavior as a modulator to correct the liver function by promoting insulin synthesis due to its lowering action on apolipoprotein mRNA or its enhancing action on HDL receptor activity, thereby reducing the blood glucose level. In turn, this reduced the level of triacylglycerol and total cholesterol in blood plasma of diabetic animals. In light of the present knowledge, a substantial reduction of LDL and total cholesterol in plasma can be achieved by reduced production of total cholesterol (Gray and Flatt, 1998). Therefore, in the current investigation, the reduced on the LDL cholesterol, HDL cholesterol
and atherogenic index under the influence of the
EPS was consistent with the above supposition.
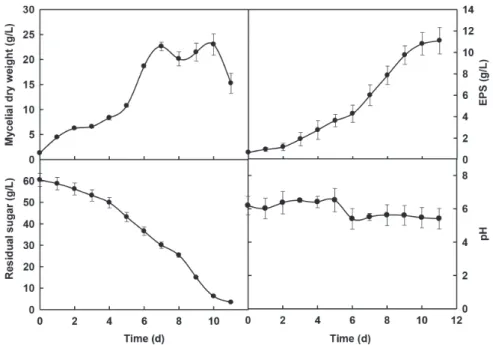
CULTIVATION IN STIRRED TANK REACTOR
The typical time courses of mycelial growth and the yield of EPS in a 5-L stirred-tank bioreactor under optimal culture conditions for the yield of EPS are shown in Figure 1. The maximum mycelial yield was obtained 22.63 g/L after 7 d (Figure 1A), and the yield of EPS indicated 11.09 mg/L after 10 d of fermentation (Figure 1B). As expected, the concentration of residual sugars decreased as the fermentation progressed with corresponding increases in biomass and EPS production (Figure 1C). However, no drastic change in pH value was recorded during course of fermentation (Figure 1D).
CHARACTERIZATION OF BROTH VISCOSITy AND MyCELIAL MORPHOLOGy
The apparent viscosity of the whole broth according to the fermentation period is depicted in Figure 2A. After day 1, the viscosity of the fermentation broth at 300 rpm increased rapidly as the cells entered their exponential growth. This continued
up to day 8 (375.0 mPa•S), which microorganisms
Fig. 2 - Rheological properties of P. geesteranus 5# mycelial broth over the fermentation period: apparent viscosity of whole fermentation broth (A); rheographs for fermentation broth (shear stress vs. shear rate plots) (B), and the variation in consistency
index (K) and flow behavior index (n) of whole fermentation broth (C).
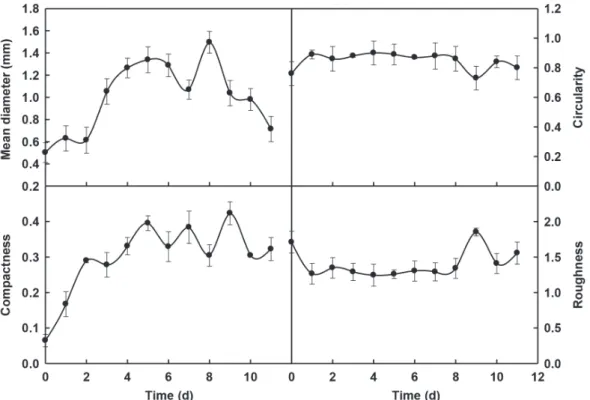
compactness (D) of the pellets during cultivation of P.
geesteranus 5#. The mean diameter and compactness
of the pellets increased during the first 0 and 5 days
of fermentation, respectively, and then vibrated, but no drastic changes in circularity and roughness were revealed during course of fermentation. Further investigation of the EPS accumulation in the mycelial
pellets during the first 5 d of the fermentation period
revealed that compactness of the pellet morphology (R2=0.963, p<0.01) was significantly positively determined with mycelial biomass, moreover, mean diameter (R2=93.3, p<0.01) and broth viscosity (R2=0.950, p<0.01) were significantly positively
determined with EPS content. These results clearly seen that the viscosity and mycelial morphological changes were coincidental with fungal biomass and EPS production, respectively. Park et al. (2002) also reported the compactness of pelleted form of
Cordyceps militaris was related to EPS production.
It is interesting to note that the relationships between the physical parameters and metabolic products become unclear at the later stage of culture (after 5 d). This indicated that the metabolic process become more complicated during and after exponential phase of fermentation.
of the broth, which was proportional to the cell concentration, declined accordingly. As in many fungal fermentations, the fermentation broths dis-played almost a pseudoplastic behavior with the
flow behavior index n<1, indicating a power law
relationship (Figure 2B and 2C). Figure 2C shows the variation in consistency index (K) and flow
behaviour index (n) of the fermentation broth. The consistency index (K) continued to rise from the
early fermentation period; however, a significant
decline was observed at the end of fermentation.
The flow behavior index, n, continued to decrease
until day 8, and thereafter a significant increase
towards the end of fermentation was observed, which was similar to the trend reported for Paecilomyces japonica fermentation (Sinha et al. 2001).
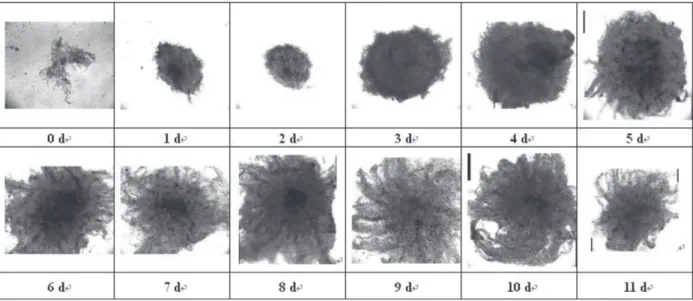
Figure 3 shows the typical morphological changes during the entire fermentation period (0-11d). The cells were observed to form mainly pellets during the entire culture period. The pellet diameter increased rapidly and the outer hairy regions of the
pellets became fluffier. However, as the fermentation
processed, especially the day 11, the outer hairy region of the pellets was shaved off. Figure 4 shows the mean diameter (A), circularity (B), roughness (C), and
Fig. 3 - The morphological changes in P. geesteranus 5# in a stirred-tank fermenter. Representative images were taken at 40-fold
Fig. 4 - Mean diameter (A), circularity (B), compactness (C) and roughness (D) of P. geesteranus 5# pellets growing in a stirred-tank fermenter.
CONCLUSION
In conclusion, P. geesteranus 5# EPS was concluded to have hypolipidemic effects in STZ-induced diabetic mice. Moreover, the pellet formation and viscosity during the fermentation of P. geesteranus
5# were investigated in the STR. The mean diameter and broth viscosity were highly correlated with EPS production. Further comprehensive pharmacological and biochemical investigations are, however, need to elucidate the exact mechanism of hypolipidemic action of the P. geesteranus 5# EPS, and to analyze any active compounds.
ACKNOWLEDGMENTS
This work was financially supported by National
Natural Science Foundation of China (No. 21376227).
RESUMO
Neste estudo, foi investigado o efeito hipolipidêmico de exopolissacarideos (EPS) do licor de fermentação
de Pleurotus geesteranus 5#
em condições de cultura ideais num reator tanque agitado de 5 L. O efeito hipolipidêmico do polissacarídeo, investigado em camundongos com diabetes induzida por estreptozotocina, diminuiu a glicose plasmática, o colesterol total e as concentrações de triacilglicerois em 17,1 %, 18,8 % e 12,0 %, respectivamente. Os resultados do presente estudo
demonstram firmemente o potencial deste polissacarídeo
Palavras-chave: exopolissacarídeos, Pleurotus geeste-ranus, fermentação, efeito hipolipemiante, morfologia.
REFERENCES
BAE JT, SINHA J, PARK JP, SONG CH AND yUN JW. 2000. Optimization of submerged culture conditions for exo-biopolymer production by Paecilomyces japonica. J Microbiol Biotechnol 10: 482-487.
BENWAHHOUD M, JOUAD H, EDDOUKS M AND LyOUSSI B. 2001. Hypoglycemic effect of Suaeda fruticosa in streptozotocininduced diabetic rats. J Ethnopharmacol 76: 35-38.
BOLKENTA Ş, yANARDAĞB R, TABAKOĞLU-OĞUZA A AND öZSOy-SAçAN ö. 2000. Effects of chard (beta vulgaris L. var cicla) extract on pancreatic B-cell in STZ-diabetic rats: a morphological and biochemical study. J Ethnopharmacol 73: 251-259.
CERRI MO AND BADINO AC. 2012. Shear conditions in clavulanic acid production by Streptomyces clavuligerus
in stirred tank and airlift bioreactors. Bioprocess Biosyst Eng 35: 977-984.
GRAy AM AND FLATT PR. 1998. Insulin-releasing and insulin-like activity of Agaricus campestris (mushroom). J Endocrinol 157: 259-266.
HE PX, GENG LJ, MAO DB, WANG Z AND XU CP. 2013. Production, preliminary characterization and bioactivity of exopolysaccharides from Pleurotus geestranus 5#. Preparative Biochemi Biotechnol 43: 1-15.
HENRy RJUM. 1974. Clinical Chemistry, 2nd ed., Harper and Row Publishers, New york, p. 1440-1443.
HWANG HJ, KIM SW, LIM JM, JOO JH, KIM HO, KIM HM AND yUN JW. 2005. Hypoglycemic effect of crude exopolysaccharides produced by a medicinal mushroom
Phellinus baumii in streptozotocin-induced diabetic rats. Life Sci 76: 3069-3080.
HWANG HS, LEE SH, BAEK yM, KIM SW, JEONG yK AND yUN JW. 2008. Production of extracellular polysaccharides by submerged mycelial culture of Laetiporus sulphureus var. miniatus and their insulinotropic properties. Appl Microbiol Biotechnol 78: 419-429.
HWANG HS AND yUN JW. 2010. Hypoglycemic effect of polysaccharides produced by submerged mycelial Culture of Laetiporus sulphureus on streptozotocin-induced Diabetic Rats. Biotechnol Bioprocess Eng 15: 173-181.
OKADA M, MATSUI H, ITO y AND FUJIWARA A. 2001. Direct measurement of HDL cholesterol: Method eliminating apolipoprotein E-rich particles. J Clin Lab Anal 15: 223-229. PARK JP, KIM SW, HWANG HJ AND yUN JW. 2001. Optimization
of submerged culture conditions for the mycelial growth and exo-biopolymer production by Cordyceps militaris. Lett Appl Microbiol 33: 76-81.
PARK JP, KIM yM, KIM SW, HWANG HJ, CHO yJ, LEE yS, SONG CH AND yUN JW. 2002. Effect of agitation intensity on the exo-biopolymer production and mycelial morphology in
Cordyceps militaris. Lett Appl Microbiol 34: 433-438. RISCALDATI E, MORESI M, FEDERICI F AND PERUCIOLI M. 2000.
Effect of pH and stirring rate on itaconate production by
Aspergillus terreus. J Biotechnol 83: 219-230.
SINHA J, BAE JT, PARK JP, KIM KH, SONG CH AND yUN JW. 2001. Changes in morphology of Paecilomyces japonica
and their effect on broth rheology during production of exo-biopolymers. Appl Microbiol Biotechnol 56: 88-92. SONG CH, JEON yJ, yANG BK, RA KS AND KIM HI. 1998.
Anti-complementary activity of endopolymers produced from submerged mycelial culture of higher fungi with particular reference to Lentinus edodes. Biotechnol Lett 20: 741-744.
VAN HORN LV. 1996. Lipid metabolism and choices for persons with diabetes. In: Powers MA (Ed), Handbook of Diabetes Medical Nutrition Therapy. Gaithersburg, MD: Aspen Publishers Inc., p. 336-359.
WANG Q, LI H, CHEN TT AND HAN JR. 2011. yield, polysaccharides content and antioxidant properties of
Pleurotus abalonus and Pleurotus geesteranus produced on asparagus straw as substrate. Scientia Horticulturae 134: 222-226.
yANG BK, JEONG SC, LEE HJ, SOHN DH AND SONG CH. 2006. Antidiabetic and hypolipidemic effects of Collybia
confluens mycelia produced by submerged culture in streptozotocin-diabetic rats. Arch Pharm Res 29: 73-79. yESILADA O, SIK S AND SAM M. 1998. Biodegradation of olive
oil mill wastewater by Coriolus versicolor and Funalia trogii: effects of agitation, initial COD concentration, inoculum size and immobilization. World J Microbiol Biotechnol 14: 37-42.