Chemometric identification and nutritional evaluation
of three species of Lutjanidae (Perciformes) from the
Amazonian Atlantic Coast based on fatty acid profiles
Edilene Santos de ALMEIDA1, Evaldo Martins da SILVA1,*
1Universidade Federal do Pará, Instituto de Estudos Costeiros, Laboratório de Química do Pescado, Alameda Leandro Ribeiro, s/n, Aldeia, CEP 68.600-000, Bragança (PA), Brazil. *Corresponding author Email address: evaldms@ufpa.br
ABSTRACT
The fatty acid (FA) profiles of fish species with a similar genetic or geographic origin are important quality parameters that attract bioecological interest because they are influenced by the nutritional habits of the species. The aim of this study was to determine the proximate compositions and FA profiles of heart, brain and muscle tissues from three fish species (Lutjanus purpureus, Lutjanus synagris and Ocyurus chrysurus) captured from the Amazonian Atlantic Coast. In addition to performing nutritional analysis of the FA profiles, principal components analysis (PCA) was performed as a chemometric tool to discriminate among the species. Lutjanus synagris had the highest protein content (18.23%), while O. chrysurus possessedthe highest lipid content (4.25%). All of the nutritional quality parameters (the n-6/n-3 and Σ polyunsaturated FA/Σ saturated FA ratios and dietary indices of atherogenicity and thrombogenicity) of the FA profiles of the three species are of interest to consumers. In general, the predominant FA in the tissues of all species analyzed was palmitic acid, followed by stearic acid. Oleic acid was predominant among the monounsaturated FAs, while docosahexaenoic acid was the most prevalent polyunsaturated FA. Chemometric analysis was an effective tool for fish identification. PCA showed that the FA profiles of the brain tissues were optimal for discriminating among the species, with O. chrysurus showing the most different FA profile from the others. The muscle FA profile was the most useful for identifying L. purpureus.
KEYWORDS: Multivariate analysis,Gas chromatography, Lutjanus purpureus, Lutjanus synagris, Ocyurus chrysurus
Identificação quimiométrica e avaliação nutricional de três espécies de
Lutjanidae (Perciformes) da Costa Atlântica Amazônica com base no perfil
de ácidos graxos
RESUMO
Perfis de ácidos graxos (AGs) de espécies de peixes com uma origem genética ou geográfica semelhante são importantes parâmetros de qualidade e apresentam interesse bioecológico, uma vez que são influenciados pelos hábitos nutricionais das espécies. O objetivo deste estudo foi determinar a composição centesimal e os perfis de AGs do coração, cérebro e músculo de três espécies de peixes (Lutjanus purpureus, Lutjanus synagris e Ocyurus chrysurus) capturados na Costa Atlântica Amazônica. Além de fornecer uma análise nutricional dos perfis de AGs, uma análise de componentes principais (ACP) foi realizada como uma ferramenta quimiométrica para discriminar entre as espécies. Lutjanus synagris teve o maior teor de proteína (18,23%), enquanto O. chrysurus apresentou a maior concentração de lipídios (4,25%). Todos os parâmetros de qualidade nutricional (as proporções de n-6/n-3 e ΣPUFAs/ΣSFAs, e os índices dietéticos de aterogenicidade e trombogenicidade) dos perfis de AGs nas três espécies se mostraram de interesse para os consumidores. Em geral, o AGs predominante nos tecidos de todas as espécies analisadas foi o ácido palmítico, seguido pelo ácido esteárico. O ácido oléico foi predominante entre os AGs monoinsaturados, enquanto que o ácido docosahexaenoico foi o mais prevalente entre a classe poliinsaturada. A análise quimiométrica foi uma ferramenta eficaz para identificação dos peixes. A ACP mostrou que os perfis de AGs dos tecidos cerebrais foram melhores para discriminar entre as espécies, com O. Ocyurus mostrando o perfil de AGs mais diferente em relação às outras espécies. O perfil de AGs do músculo foi o mais útil para a identificação de L. purpureus.
INTRODUCTION
Recent decades have seen increasing interest in the beneficial effects of a healthy diet on the human body, as well as in foods that contain biologically active substances. Thus, many studies have been conducted on the chemical compositions of fish to determine their nutritional potentials. In assessments of the nutritional contents of fish, it is very important to determine their fatty acid (FA) profiles because this information can be used as a tool for the identification of fish stocks and different species (Mjaavatten et al. 1998).
In addition to the nutritional and biological importance of certain FAs, the FA profiles of fish tissues have been used as an alternative method of species and stock identification through chemometric techniques (Grahl-Nielsen and Mjaavatten 1992). The total lipid compositions and FA profiles of fish can vary according to several factors, such as the fishing season, geographical location, size and sex of the fish and period of the reproductive cycle (Luzia et al. 2003).
Numerous investigations have demonstrated that diet also influences the FA profiles of fish tissues (Sargent et al.
2002). Further, a significant quantity of FAs can be present in a single fish species, and each FA may be used as a variable in analyses of nutritional quality. FA profiling applications with the aim of fish species or stock identification are divided into two categories based on different assumptions. On the one hand, it is believed that diet is the main factor that influences the FA composition of triacylglycerols (storage lipids), which are mainly found in muscle tissue; on the other hand, it has also been suggested that the FA composition of membrane phospholipids is genetically controlled and remains stable over time (Grahl-Nilsen 2005).
The species belonging to the family Lutjanidae (Lutjanus purpureus, Lutjanus synagris and Ocyurus chrysurus) used in this study are highly exploited in the North and Northeast regions of Brazil and have high economic value because of their excellent taste and production mainly for export markets. Lutjanidae species have long life cycles and slow growth rates (Polovina and Ralston 1987); thus, their intense exploitation can result in a state of overfishing, thereby compromising the sustainability of this fish source. Further, studies on the proximate compositions and FA profiles of these species are scarce in the literature.
In this context, the present study aimed to determine the proximate compositions and FA profiles of the three above-mentioned species to evaluate their nutritional potentials for human health and to generate profiles that could be used as tools for species identification based on chromatographic and multivariate data analyses.
MATERIALS AND METHODS
Sampling and tissue preparation
The fish used in this study were recovered from the Amazonian Atlantic Coast (Amapa and Para States, Brazil), and they belong to the Lutjanidae family. A total of 70 individuals were sampled, including 23 specimens of Lutjanus synagris (Linnaeus 1758), 22 of Lutjanus purpureus (Poey, 1875) and 25 of Ocyurus chrysurus (Bloch, 1791). Lutjanus purpureus was captured in June 2012, while the other two species were recovered in September of the same year. The fish specimens were purchased directly from fishermen. To ensure the freshness of the fish, only individuals captured two days before returning to land and held on ice were used in this study. After landing, the fish were immediately transported to the laboratory for subsequent sample preparation.
Upon arrival at the laboratory, morphometric measurements of total length, standard length and weight were performed. Then, each fish was opened to remove its heart, brain and muscle tissues. The heart and brain tissue samples were washed with distilled water to remove excess blood and were then stored and frozen in Eppendorf tubes for subsequent lyophilization. The muscle tissue samples were ground and homogenized in a food multiprocessor. Ten grams of each specimen was obtained to perform determinations of the moisture and ash contents, and the remainder of the sample was placed on an aluminum tray and frozen at -20 °C before lyophilization.
Tissue lyophilization was performed with a L108 Liotop (Liobras, S. Carlos (SP), Brazil) at an internal temperature of −50 °C ± 2 °C and a pressure of less than 100 mbar for 48 hours. Upon removal from the lyophilizer, the samples were immediately weighed to calculate the water loss. To conserve the physicochemical characteristics of the fish, the lyophilized samples were stored at -20 °C ± 2 °C until analysis.
Determination of the proximate compositions of fish fillets
The protein content in muscle tissue was determined using the Kjeldahl method, which consisted of digestion, distillation and titration. During the last step, the total nitrogen present in the sample was multiplied by a factor of 6.25 for conversion to the total protein value (AOAC 1997).
The carbohydrate content was determined by subtracting the % moisture content (U), % ash (C), % protein (P) and % total lipids (L) from 100% (Onyeike et al. 2000) using the following equation: % total carbohydrates = 100 - (C + P + U + L).
Analysis of fatty acid methyl esters (FAMEs)
FAs in the lyophilized samples were transesterified using the one-step transesterification method with 14% BF3 in methanol (Abdulkadir and Tsuchiya 2008). Approximately 200-300 mg of each lyophilized sample was esterified in a mixture of 4 ml of hexane and 2 ml of 14% BF3 in methanol under a nitrogen atmosphere in a sealed tube. This step was performed in a water bath at 99 °C for 120 min, with agitation of each tube for ten seconds every 20 min. Next, the tube was cooled to room temperature, followed by the addition of 1 ml hexane and 2 ml distilled water. The tube was then shaken vigorously for 1 min and centrifuged for 3 min at 2,500 rpm (703 g). Two phases were formed, with the upper hexane phase containing the FA fraction. This phase was removed with a Pasteur pipette and placed in an Eppendorf tube for subsequent analysis by gas chromatography.
The separation and quantification of fish FAs were performed with a Trace GC model 1310 gas chromatograph system (Thermo Scientific, Waltham, MA, USA), using helium as a carrier gas and a TR FAME (Thermo Scientific) capillary column (60 m length x 0.25 mm inside diameter x 0.25 mm film thickness) equipped with a flame ionization detector. The initial oven temperature was 170 °C; a hold was applied for 3 min, and then the temperature was increased by 2 °C/min until it reached 210 °C. Next, the temperature was raised to 240 °C at a rate of 5 ° C/min; then, a hold for 6 min was applied at that temperature until the end of the injection run, for a total of a 32 min of analysis. The temperatures of the injector and detector were set at 260 °C. The amount of sample injected was 1 µl, and a split ratio of 1:20 was used. The FAMEs were identified by comparing the retention times of each sample with those of a standard sample (37-component FAME mix, Supelco, Bellefonte, PA).
Determination of the nutritional qualities of the lipid fractions
Based on the FA profiling data, the nutritional qualities of the lipid fraction of the fish fillets were determined using the indices of atherogenicity (IA) and thrombogenicity (IT) (Ulbricht and Southgate 1991) and the ratio of hypocholesterolemic to hypercholesterolemic FAs (HH = Σ hypocholesterolemic FAs/ Σ hypercholesterolemic
FAs (Santos-Silva et al. 2002), which were obtained using equations 1, 2 and 3, respectively.
(1)
(2)
(3)
Where:
∑AGMI = sum of monounsaturated fatty acids (MUFAs); ∑n6 = sum of n-6 FAs;
∑n3 = sum of n-3 FAs.
Statistical treatment
The data were analyzed using Statistica software, version 10.0 (Statsoft, Tulsa, OK, USA). Data were subjected to analysis of variance (ANOVA) to assess differences among species on chemical compositions. If ANOVA appeared statistically significant (α = 0.05), means were compared by Tukey’s HSD test.
To analyze the FA profiles of the different tissues from the three species, the peak areas were used to calculate the FA concentrations. These values were then normalized as recommended by Sjodin (1984) by dividing each FA concentration by the sum of the concentrations of the minor peaks. Next, these values were subjected to principal components analysis (PCA). Biplot graphs of the sample scores and variables in PCA were generated using Matlab software, version R2015a (Mathworks, Natick, MA, USA).
RESULTS
Characterization of the proximate compositions
The average weights of the fish specimens ranged from 590 (O. chrysurus) to 1,000 g (L. purpureus). These values are within the ranges found for other species of snappers. These observations also indicate that all subjects were in the mature adult stage. Table 1 shows the proximate compositions of the species analyzed. The moisture contents ranged from 76.31% (O. chrysurus) to 79.30% (L. purpureus). The ash contents of the three species were similar. The total protein and total lipid contents significantly differed among the species. O. chrysurus
Fatty acid profiles
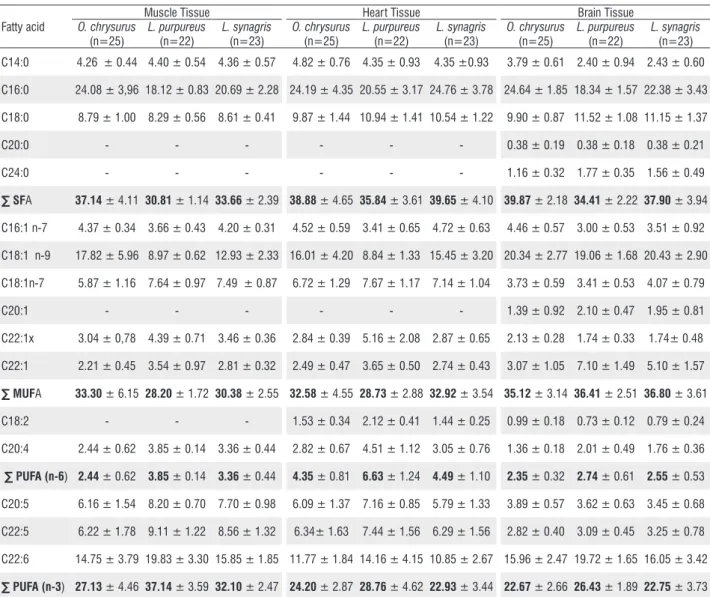
The FA profiles of the three species and the three tissue types studied are described in Table 2. Twelve FAs were identified in the muscle tissues, 13 in the heart tissues and 16 in the brain tissues. Among the saturated fatty acids (SFAs), palmitic acid was predominant, with muscle tissue averages of 24.08% (O. chrysurus), 18.12% (L. purpureus), and 20.69% (L. synagris), and the highest values were found in the three tissues from O. chrysurus. Among the MUFAs, the highest quantities of oleic acid (C18:1 n-9) were found in the brain tissues (19.06% to 20.43%), and the lowest were observed in the muscle tissues (8.97% to 17.82%). Polyunsaturated n-6 FAs identified included arachidonic acid (C20:4 n-6) and linoleic acid (C18:2 n-6); the latter was only detected in the brain and heart tissues.
Table 1. Average weights (g) and proximate compositions on a wet basis (%) of the species studied*
Variable
Species
O. chrysurus
(n=25)
L. purpureus
(n=22)
L. synagris
(n=23) Average weight (g) 0.59 ± 0.19 1.00 ± 0.23 0.735 ± 0.29 Moisture (%) 76.31 ± 0.44a 78.78 ± 0.26b 79.30 ± 0.88b
Ash (%) 0.41 ± 0.04a 0.45 ± 0.04a 0.41 ± 0.04a
Protein (%) 17.52 ± 0.58a 18.04 ± 0.41ab 18.23 ± 0.75b
Lipid (%) 4.25 ± 0.97a 0.34 ± 0.16b 0.94 ± 0.39b
Carbohydrate (%) 1.51 ± 1.21a 2.39 ± 0.51a 1.13 ± 1.22a. *Different letters indicate significant differences among species (p < 0.05).
Table 2. The fatty acid (FA) profiles of tissues of three Lutjanidae species from the Amazonian Atlantic Coast that were captured in June 2012 (L. purpureus) and September 2012 (O. chrysurus and L. synagris). The values are expressed as the mean percentage (%) and standard error of the FA concentrations.
Fatty acid
Muscle Tissue Heart Tissue Brain Tissue
O. chrysurus
(n=25)
L. purpureus
(n=22)
L. synagris
(n=23)
O. chrysurus
(n=25)
L. purpureus
(n=22)
L. synagris
(n=23)
O. chrysurus
(n=25)
L. purpureus
(n=22)
L. synagris
(n=23) C14:0 4.26 ± 0.44 4.40 ± 0.54 4.36 ± 0.57 4.82 ± 0.76 4.35 ± 0.93 4.35 ±0.93 3.79 ± 0.61 2.40 ± 0.94 2.43 ± 0.60
C16:0 24.08 ± 3,96 18.12 ± 0.83 20.69 ± 2.28 24.19 ± 4.35 20.55 ± 3.17 24.76 ± 3.78 24.64 ± 1.85 18.34 ± 1.57 22.38 ± 3.43
C18:0 8.79 ± 1.00 8.29 ± 0.56 8.61 ± 0.41 9.87 ± 1.44 10.94 ± 1.41 10.54 ± 1.22 9.90 ± 0.87 11.52 ± 1.08 11.15 ± 1.37 C20:0 - - - 0.38 ± 0.19 0.38 ± 0.18 0.38 ± 0.21
C24:0 - - - 1.16 ± 0.32 1.77 ± 0.35 1.56 ± 0.49
∑ SFA 37.14 ± 4.11 30.81 ± 1.14 33.66 ± 2.39 38.88 ± 4.65 35.84 ± 3.61 39.65 ± 4.10 39.87 ± 2.18 34.41 ± 2.22 37.90 ± 3.94
C16:1 n-7 4.37 ± 0.34 3.66 ± 0.43 4.20 ± 0.31 4.52 ± 0.59 3.41 ± 0.65 4.72 ± 0.63 4.46 ± 0.57 3.00 ± 0.53 3.51 ± 0.92
C18:1 n-9 17.82 ± 5.96 8.97 ± 0.62 12.93 ± 2.33 16.01 ± 4.20 8.84 ± 1.33 15.45 ± 3.20 20.34 ± 2.77 19.06 ± 1.68 20.43 ± 2.90 C18:1n-7 5.87 ± 1.16 7.64 ± 0.97 7.49 ± 0.87 6.72 ± 1.29 7.67 ± 1.17 7.14 ± 1.04 3.73 ± 0.59 3.41 ± 0.53 4.07 ± 0.79
C20:1 - - - 1.39 ± 0.92 2.10 ± 0.47 1.95 ± 0.81
C22:1x 3.04 ± 0,78 4.39 ± 0.71 3.46 ± 0.36 2.84 ± 0.39 5.16 ± 2.08 2.87 ± 0.65 2.13 ± 0.28 1.74 ± 0.33 1.74± 0.48 C22:1 2.21 ± 0.45 3.54 ± 0.97 2.81 ± 0.32 2.49 ± 0.47 3.65 ± 0.50 2.74 ± 0.43 3.07 ± 1.05 7.10 ± 1.49 5.10 ± 1.57
∑ MUFA 33.30 ± 6.15 28.20 ± 1.72 30.38 ± 2.55 32.58 ± 4.55 28.73 ± 2.88 32.92 ± 3.54 35.12 ± 3.14 36.41 ± 2.51 36.80 ± 3.61
C18:2 - - - 1.53 ± 0.34 2.12 ± 0.41 1.44 ± 0.25 0.99 ± 0.18 0.73 ± 0.12 0.79 ± 0.24 C20:4 2.44 ± 0.62 3.85 ± 0.14 3.36 ± 0.44 2.82 ± 0.67 4.51 ± 1.12 3.05 ± 0.76 1.36 ± 0.18 2.01 ± 0.49 1.76 ± 0.36
∑ PUFA (n-6) 2.44 ± 0.62 3.85 ± 0.14 3.36 ± 0.44 4.35 ± 0.81 6.63 ± 1.24 4.49 ± 1.10 2.35 ± 0.32 2.74 ± 0.61 2.55 ± 0.53
C20:5 6.16 ± 1.54 8.20 ± 0.70 7.70 ± 0.98 6.09 ± 1.37 7.16 ± 0.85 5.79 ± 1.33 3.89 ± 0.57 3.62 ± 0.63 3.45 ± 0.68
C22:5 6.22 ± 1.78 9.11 ± 1.22 8.56 ± 1.32 6.34± 1.63 7.44 ± 1.56 6.29 ± 1.56 2.82 ± 0.40 3.09 ± 0.45 3.25 ± 0.78
C22:6 14.75 ± 3.79 19.83 ± 3.30 15.85 ± 1.85 11.77 ± 1.84 14.16 ± 4.15 10.85 ± 2.67 15.96 ± 2.47 19.72 ± 1.65 16.05 ± 3.42
Three types of polyunsaturated n-3 FAs were found, including eicosapentaenoic acid (EPA; C20:5 n-3), docosapentaenoic acid (DPA; C22:5 n-3) and docosahexaenoic acid (DHA; C22:6 n-3). Among them, C22:6 n-3 was the most prevalent in the three studied species, with quantities of 14.75% (O. chrysurus), 19.83% (L. purpureus) and 15.85% (L. synagris) in the muscle tissues. Notably, higher values were recorded in the brain tissues. The quantities of total n-3 FAs were 27.31%, 37.14% and 32.10% in O. chrysurus, L. purpureus and L. synagris, respectively.
Nutritional qualities of the fatty acid profiles
The nutritional qualities of the lipid profiles were assessed using different indices and are presented in Table 3. The lowest IA and IT values measured were 0.52 and 0.22, respectively, found in L. purpureus as 0.52 and 0.22,
respectively, and the highest observed HH value of the ratio between hypocholesterolemic and hypercholesterolemic FAs (HH) was 2.22.
Multivariate analysis of fatty acid profiles
PCA of the FA profiling data on the studied tissues showed that the first two principal components (PCs) explained 73.13% of the variance in the data matrix (Table 4). A graphical representation of the contributions of the variables (FAs) to the first two PCs and the sample scores for all tissues from the three studied species is provided in Figure 1. PC1 represented 51.17% of the total information and was positively linked to the FAs C18:1 n-9 and C18:0 and negatively linked to C22:5 and C20:5. PC2 (20.95% of the total data variance) was positively related to C14:0.
Table 3. The nutritional qualities of the lipid fractions of fillets of three
Lutjanidae species from the Amazonian Atlantic Coast captured in June 2012
(L. purpureus) and September 2012 (O. chrysurus and L. synagris).
Ratio or Index
Species
O. chrysurus
(n=25)
L. purpureus
(n=22)
L. synagris
(n=23)
∑PUFA (n-6)/ ∑PUFA (n-3) 0.09 0.10 0.10
∑PUFAs/∑SFAs 0.80 1.33 1.05
IA 0.65 0.52 0.57 IT 0.34 0.22 0.20 HH 1.67 2.22 1.93
IA: Index of atherogenicity; IT: index of thrombogenicity; HH: ratio of hypocholesterolemic to hypercholesterolemic fatty acids
Table 4. Eigenvalues of the correlation matrix
Principal
component Eigenvalue
% Total variance
Cumulative
eigenvalue % Cumulative 1 6.14 51.17 6.14 51.17 2 2.51 20.95 8.65 73.13 3 1.34 11.16 9.99 83.28 4 0.68 5.70 10.68 88.99 5 0.50 4.13 11.17 93.12 6 0.37 3.09 11.54 96.21 7 0.20 1.68 11.75 97.89 8 0.12 1.01 11.87 98.89 9 0.07 0.57 11.93 99.46 10 0.05 0.45 11.99 99.91 11 0.01 0.91 12.00 100
A biplot graph of the contributions of the variables (FAs) to the first two PCs and the sample scores, using only the FA profiles of the muscle tissues, is shown in Figure 2. The contributions of the variables to the main components (Figure 2-B) were as follows: the FAs C22:5, C20:4 and C20:5 positively contributed to PC1, while C16:0, C18:0,
C14:0 and C18:1 (oleic) negatively contributed; and C22:6 positively contributed to PC2, while C22:1 X and C18:1 (vaccenic) negatively contributed. In the cerebral tissues (Figure 3), PC1 contributed to 41.62% of the total variance, with C22:1, C24:0 and C20:4 having positive influences and C16:1, C14:0, C16:0 and C22:1 X having negative influences.
Figure 2. Biplot of the contributions of variables (fatty acids) to the principal components and sample scores of muscle tissues from L. synagris, L. purpureus
and O. chrysurus based on the fatty acid profiles. This figure is in color in the electronic version.
Figure 3. Biplot of the contributions of variables (fatty acids) to the principal components and sample scores of brain tissues from L. synagris, L. purpureus
Regarding the ΣPUFAs/ΣSFAs ratio, foods with values of below 0.45 are considered undesirable (DHSS 1994) because they have the potential to induce an increase in blood cholesterol. Among the studied fish, the lowest ratio observed was 0.80 in O. chrysurus, and the highest was 1.33 in L. purpureus; thus, all species had values above the recommended level, indicating that they are suitable for consumption.
IA and IT are related to the potential to stimulate platelet aggregation, i.e., smaller values indicate an elevated amount of anti-atherogenic acids in a given fat or oil, with a correspondingly increased potential for preventing the emergence of coronary heart disease (Turan 2007). In contrast, a higher HH ratio indicates increased nutritional suitability (oil or fat) for human consumption because this index is related to cholesterol metabolism.
In chemometric analysis, the case projections (individual samples) on the first two PCs showed that the brain tissue differed from the other tissues with regard to the FA profile and that the muscle and cardiac tissues exhibited similar FA compositions. Further, the FA compositions of the muscle tissues showed that L. purpureus is distinct from the other species, mainly due to its higher PUFA concentration.
Regarding the identification of species, the brain tissues were effective for discriminating O. chrysurus fromthe other two species because O. chrysurus had higher SFA and MUFA concentrations. Notably, this species belongs to another genus of the Lutjanidae family.
Sample overlapping of L. synagris with the other species in the plane of the first two PCs could have occurred because 15 of the analyzed subjects were female, had mature gonads, and were ready to spawn. According to Joensen and Grahl-Nielsen (2000), the stage of gonadal maturation can influence the FA profiles of tissues and can possibly cause the selective mobilization of FAs among tissues during gonadal maturation.
Tissue analyses revealed that the FA profiles of the muscle and brain tissues had stronger impacts on the discrimination of Lutjanidae species from the Amazonian Atlantic Coast. In contrast, several studies have indicated that heart tissue is the most suitable for differentiating among species (Mjaavatten
et al. 1998; Joensen and Grahl-Nielsen 2000) because it is composed mainly of structural lipids (phospholipids) that do not change in relation to external factors because they are genetically controlled (Grahl-Nilsen 2005).
Diet is a primary factor for the identification of fish stocks based on the FA profile of muscle tissue because this tissue is rich in storage lipids (triacylglycerides) (Grahl-Nielsen 2005). Some investigations have revealed differences in the muscle tissues of fish species and stocks. For example, Seaborn et al. (2000) used muscle FA profiles to differentiate the wild bass Common Snook (Centropomus undecimalis) from cultivated
DISCUSSION
Fish is reputed to be easily digestible and to be a source of high-quality protein, vitamins and minerals, although it is mainly perceived to be a rich source of long-chain omega-3 polyunsaturated fatty acids (PUFAs) (Jabeen and Chaudhry 2011). The fish examined in the present study are category A fish (i.e., low fat content (less than 5%) and high protein content (15-20%)) (Stansby and Olcott 1967) according to their relative protein and lipid contents; therefore, they are considered to have excellent nutritional qualities.
The protein contents determined in the muscle tissues of the three fish species are quite close to those reported by Vila Nova et al. (2005) for L. purpureus (19.30%) captured from the Brazilian Northeast Coast of the Atlantic.
The higher lipid content of O. chrysurus may be due to the fact that this species belongs to another genus of the Lutjanidae family and also that fifteen of the specimens were female and had mature gonads.
Fish lipids include essential PUFAs, such as EPA (C20:5 n-3), DHA (C22:6 n-3), and arachidonic acid (C20:4 n-6), which are only synthesized in the human body following the intake of C18:2 and C18:3. Thus, their dietary inclusion is essential (Kolanowski and Laufenberg 2005), and they have been the main focus of research.
The FA profiles of the studied fish muscle tissues were characterized by a predominance of SFAs and MUFAs, representing approximately 59.01 to 70.14% of the total FAs. The high amounts of SFAs and MUFAs observed in our study are consistent with previous reports in the literature on other fish species. According to Dey et al. (1993), these classes of FAs are typically abundant in fish from warm or temperate regions, while PUFAs are present at high levels in fish from cold regions.
The SFA concentration found in the muscle tissue of L. synagris is similar to that reported by Andrade et al. (2009). However, they recorded a lower SFA concentration in the muscle tissue of O. chrysurus (17.16%) than that we found in this study. Nevertheless, in both studies, palmitic acid was predominant, followed by stearic acid.
hybrids. The FA profiles of muscle lipids differ between cultured and wild sturgeon, Acipenser oxyrinchus desotoi (Chen
et al. 1995). Armstrong et al. (1994) distinguished among five species of temperate fish from Australian waters by PCA based on the FA compositions of fillets. (Rasoarahona et al. 2005) used muscle FA profiles to differentiate among three species of tilapia, in which FA seasonality occurs, during different seasons of the year.
CONCLUSIONS
The three species of fish examined in this study are highly recommended for human consumption because they are good sources of protein and PUFAs. The tissue type that exhibited the best performance for species discrimination was the brain tissue, as determined by PCA of tissues from the three species. The results of this study confirm the importance of the chemometric method for the identification of species and fish stocks.
ACKNOWLEDGEMENTS
We would like to thank to the Environmental Biology Graduate Program of the Federal University of Para for the institutional support to this research.
REFERENCES
Abdulkadir, S. and Tsuchiya, M. 2008. One-step method for quantitative and qualitative analysis of fatty acids in marine animal samples. Journal of Experimental Marine Biology and Ecology, 354: 1–8.
Andrade, Q.; Bispo, S. and Druzian, J.I. 2009. Avaliação da qualidade nutricional em espécies de pescado mais produzidas no Estado da Bahia Quality evaluate nutritional the fisches more consumed in State of Bahia – Brazil. Ciência e Tecnologia de Alimentos, 29: 721–726.
AOAC. 1997. Association of Oficial Analytical Chemists- Official methods of analysis., 16th ed. Washington D.C.
Armstrong, S.G.; Wyllie, S.G. and Leach, D.N. 1994. Effects of season and location of catch on the fatty acid compositions of some Australian fish species. Food Chemistry, 51: 295–305.
Chen, I.C.; Chapman, F.A.; Wei, C.I.; Portier, K.M. and O’Keefe, S.F. 1995. Differentiation of cultured and wild sturgeon (Acipenser oxyrinchus desotoi) based on fatty acid composition.
Journal of Food Science, 60: 631–635.
Connor, W.E. 2000. Importance of n-3 fatty acids in health and disease. The American journal of clinical nutrition, 71: 171S–5S.
Dey, I.; Buda, C.; Wiik, T.; Halver, J.E. and Farkas, T. 1993. Molecular and structural composition of phospholipid membranes in livers of marine and freshwater fish in relation to temperature. Proceedings of the National Academy of Sciences, 90: 7498–7502.
DHSS. 1994. Department of Health and Social Security. Nutritional aspects of cardiovascular disease. Report on Health and Social Subjects, n. 46. HMSO., London, 178p.
Grahl-Nielsen, O. and Mjaavatten, O. 1992. Discrimination of striped bass stocks: A new method based on chemometry of the fatty acid profile in heart tissue. Transactions of the American Fisheries Society, 121: 307–314.
Grahl-Nilsen, O. 2005. Fatty acids profiles as natural marks for stocks identification. Stock identification methods. ,: 239–261. Jabeen, F. and Chaudhry, A.S. 2011. Chemical compositions and
fatty acid profiles of three freshwater fish species. Food Chemistry, 125: 991–996.
Joensen, H. and Grahl-Nielsen, O. 2000. Discrimination of Sebastes viviparus, Sebastes marinus and Sebastes mentella from Faroe Islands by chemometry of the fatty acid profile in heart and gill tissues and in the skull oil. Comparative Biochemistry and Physiology - B Biochemistry and Molecular Biology, 126: 69–79. Kolanowski, W. and Laufenberg, G. 2005. Enrichment of food
products with polyunsaturated fatty acids by fish oil addition.
European Food Research and Technology, 222: 472–477. Luzia, L.A.; Sampaio, G.R.; Castellucci, C.M.N. and Torres,
E.A.F.S. 2003. The influence of season on the lipid profiles of five commercially important species of Brazilian fish. Food Chemistry, 83: 93–97.
Mjaavatten, O.; Levings, C.D. and Poon, P. 1998. Variation in the fatty acid composition of juvenile chinook and coho salmon from Fraser river estuary determined by multivariate analysis; role of environment and genetic origin. Comparative Biochemistry and Physiology Part B: Biochemistry and Molecular Biology, 120: 291–309.
Moreira, A.B.; Visentainer, J. V.; de Souza, N.E. and Matsushita, M. 2001. Fatty Acids Profile and Cholesterol Contents of Three Brazilian Brycon Freshwater Fishes. Journal of Food Composition and Analysis, 14: 565–574.
Onyeike, E.N.; Ayalogu, E.O. and Ibegbulem, C.O. 2000. Evaluation of the nutritional value of some crude oil polluted freshwater fishes. Global Journal of Pure and Applied Sciences, 6: 227–233.
Polovina, J.J. and Ralston, S. 1987. Tropical Snappers and Groupers: Biology and Fisheries Management. Westview Press, Boulder, Colorado, 659p.
Randall, E.L. 1974. Improved method for fat and oil analysis by a new process of extraction. Journal of the Association of Official Analytical Chemists, 57: 1165–1168.
Rasoarahona, J.R.E.; Barnathan, G.; Bianchini, J.P. and Gaydou, E.M. 2005. Influence of season on the lipid content and fatty acid profiles of three tilapia species (Oreochromis niloticus, O. macrochir and Tilapia rendalli) from Madagascar. Food Chemistry, 91: 683–694.
Sargent, J.; Tocher, D. and Bell, J. 2002. The lipids. Fish nutrition (3rd Edition),: 181–257.
Seaborn, G.T.; Jahncke, M.L. and Smith, T.I.J. 2000. Differentiation between Cultured Hybrid Striped Bass and Wild Striped Bass and Hybrid Bass using Fatty Acid Profiles. North American Journal of Fisheries Management, 20: 618–626.
Sjodin, K. 1984. Minimizing Effects of Closure on Analytical Data.
Society, 56: 1685–1688.
Stansby, M.E.; Olcott, H.S. 1967. Composición del pescado. In:
Tecnologia de la Industria Pesquera. (Ed. J.. Stansby, M.E.; Dassow), pp. 391–402. Acribia, Zaragoza.
Turan, H. 2007. Fatty acid profile and proximate composition of the thornback ray (Raja clavata, L. 1758) from the Sinop coast in the Black Sea. Journal of Fisheries Sciences.com, 1: 97–103. Ulbricht, T.L.V. and Southgate, D.A.T. 1991. Coronary heart disease:
seven dietary factors. The Lancet, 338: 985–992.
Vila Nova, C.M.V.M.; Godoy, H.T. and Aldrigue, M.L. 2005. Composição química, teor de colesterol e caracterização dos lipídios totais de tilápia (Oreochromis niloticus) e pargo (Lutjanus purpureus). Ciência e Tecnologia de Alimentos, 25: 430–436.