Assessing the medical waste management
practices and associated risk perceptions in
Algarve hospitals, Portugal
Vera Ferreira1, Margarida Ribau Teixeira2 (1, 2) FCT/UALG
CONTACT
Margarida Ribau Teixeira
Faculty of Sciences and Technology, University of Algarve, Campus de Gambelas, Faro; Portugal Tel: +351 289800900, Fax: +351 2898000069, e-mail: [email protected]
EXECUTIVE SUMMARY
In the past few years, there has been an increase in public concern about the medical wastes management on a global basis and a significant effort has been directed toward proper and safe management of hazardous medical wastes. However, if there is not a clear understanding of the risks, inadequate management practices are often implemented. The objective of this study was to analyse the medical waste management practice of hospitals in Algarve (Portugal), analyse the risk perception of medical staff (nurses, doctors and housekeepers) and assess the risk for medical staff. This study was carried out in the three hospitals, one public and two private. Field visits and questionnaires survey method was implemented to collect information regarding different medical waste management aspects and the perception of risk associated with medical wastes by the medical staff. The risk assessment was based in real injuries data associated with sharps and needles (estimate of infections) and in inadequate wastes separation, i.e. frequency of errors in separation. There are some problems in the medical waste management in all hospitals due to lack of training and resources. Nurse’s group show slightly higher knowledge about medical wastes separation, with 71.6% correct answers, and doctor’s group lower knowledge, with 64.8% correct answers. Only 26% of doctors participated in training programs and this medical staff group evidences a lower perception of risk associated of the infectious wastes (group IV wastes). The separation about pharmaceuticals, cytotoxic and pathological waste has more errors, which in reality can be reflected in a higher percentage of inadequate treatment and final disposal, and has impacts in medical workers and environment. Most injuries from needlestick/sharp occur during patient care, but there are medical wastes risk associated, mainly linked to the deposition in containers and separation errors of this material. However, only HVB is likely to occur in hospitals, in coming years if the prophylaxis is not 100%. Results indicate the waste management is affected by perception of risk and training programs.
INTRODUCTION
Medical wastes are of great importance due to its potential environmental hazards and public health risks. World Health Organization (WHO) has advocated medical wastes as special wastes and it is now commonly acknowledged that certain categories of medical wastes are among the most hazardous and potentially dangerous of all wastes arising in communities (Sawalem et al., 2009), as exposure to hazardous medical waste can result in disease or injury. The hazardous nature of medical wastes may be due to one or more of the following characteristics (Pruss et al., 1999): it contains infectious agents, toxic or hazardous chemicals or pharmaceuticals, and sharps, and it is
genotoxic and radioactive. Infectious medical wastes, particularly sharp ones, have been responsible for most of the accidents reported in literature. WHO estimated that, in 2000, injections with contaminated syringes caused 21 million hepatitis B, 2 million hepatitis C and 260,000 HIV infections (WHO, 2005a).
In the past few years, there has been an increase in public concern about the medical wastes management on a global basis (Shinee et al., 2008) and a significant effort has been directed toward proper and safe management of hazardous medical waste. However, as there is not yet clear understanding of the risks, and as consequence, inadequate management practices are often implemented. Some studies have been conducted around the world to assess the medical wastes management practices (Silva et al., 2004; Blenkharn, 2006; Blenkharn, 2007; Mostafa et al., 2007; Tsakona et al., 2007; and Coker et al., 2008). All of them referred that planning and implementation of waste management reduce health and environmental risks. In addition, good medical waste management in a hospital depends on a dedicated waste management team, good administration, careful planning, sound organization, underpinning legislation, adequate financing, and full participation by trained staff (WHO, 2005a).
Medical wastes definitions and classifications taken by various countries directly affect their management (Gonçalves, 2005). For instances, Portuguese legislation settles the following four groups of medical wastes:(i) Group I – wastes similar to municipal wastes; (ii) Group II – nonhazardous medical wastes that do not require specific treatment and can be considered similar to municipal wastes; (iii) Group III – medical wastes with, or suspicious biological hazard that must be pre-treated before elimination as municipal wastes or, otherwise must be incinerated; (iv) Group IV – specific medical wastes with compulsory incineration.
In Portugal, in 2005, the production of medical wastes was approximately 54,000 t. Algarve region, in the south of Portugal, contributed with 1.6% of the total production, which corresponded to the region that contributed with the lowest medical wastes production in Portugal. Data from the governmental health institutions in Portugal (DGS, 2006) demonstrated that between years 1999 – 2005, there was an increase in medical wastes production, especially after 2002, as well as an increase of hazardous wastes production compared to non-hazardous wastes, both in Portugal and Algarve. The amount of medical wastes declared in 2005 by the Algarve hospitals corresponded to 1.3 kg/bed.day for group I/II wastes, 0.78 kg/bed.day for group III, and 0.11 kg/bed.day for group IV. According with (DGS, 2006) the national average is 3.5 kg/bed.day for the total of medical wastes and 1.38 kg/bed.day for the hazardous wastes. These indicators are in correspondence with those estimated in high-income countries (Pruss et al., 1999; Rahman and Ali, 2000).
The objectives of this study are: i) analyse the medical wastes management practice in hospitals in Algarve (Portugal), ii) evaluated the risk perception and knowledge, and iii) assess health risks for medical staff (doctors, nurses and housekeepers), in public and private hospitals.
EXPERIMENTAL
The study covered one public and two private hospitals, which corresponds to 50% of the Algarve’s hospitals and 40.6% of the total beds capacity (Table 1).
Several methods were used to collect data, namely site visits, interviews and survey questionnaires.
Data collection regarding waste generation, separation, collection, storage, transportation and disposal of medical wastes were carried out during site visits to the hospitals. These visits were conducted to provide information about the medical wastes management and working conditions, as
well as identify the main hazards to safety health and to the environment, resulting from the existing practices. Observation checklists were used during site visits, which were based on the Portuguese legislation and the recommendations of the WHO for assessment of hospital wastes management practices (Pruss et al., 1999). To support and supplement information collected in site visits, interviews were conducted with the managers responsible for environmental healthcare in each hospital, and with the personnel involved in collection, handling and disposal of hospital wastes.
Table 1 Hospitals and beds in Algarve and included in this study.
Algarve Studied Nº Nº % Public 2 1 50.0 Private 4 2 50.0 Hospitals Total 6 3 50.0 Public 822 333 40.5 Private 123 51 41.5 Beds Total 945 384 40.6
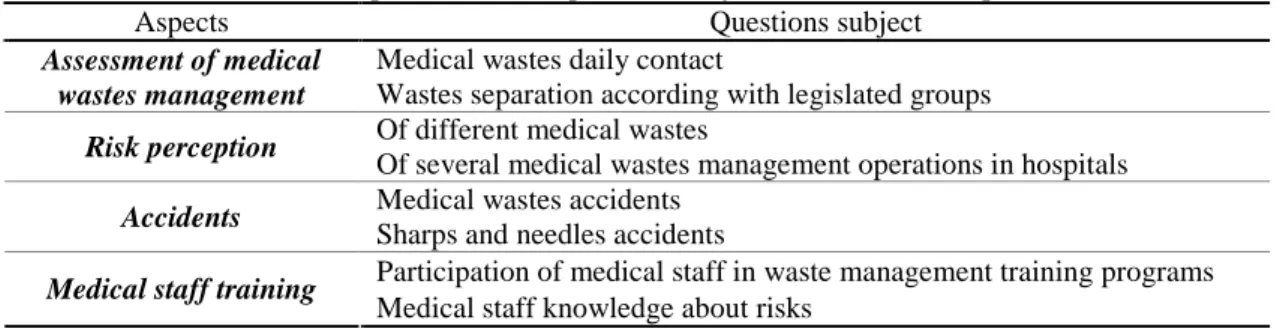
The questionnaires were made to evaluate the knowledge and wastes management practices among doctors, nurses and housekeepers, and their risk perception associated with medical wastes. Questionnaires were distributed to various departments in each hospital. Confidentiality was ensured and all forms were anonymous. The questionnaires involved twelve questions grouped in four aspects: assessment of medical wastes management, risk perception, accidents with medical waste, and medical staff training related with the risks of medical waste manipulation. Table 2 summarizes the aspects and the subjects related to each aspect. Data from the questionnaires were stored and coded in a database for further analysis. The data from the survey was checked for consistency and completeness, and then statically analyzed with SPSS 16 software.
Table 2 Aspects and some questions subject related to each aspect.
Aspects Questions subject
Medical wastes daily contact
Assessment of medical
wastes management Wastes separation according with legislated groups
Of different medical wastes
Risk perception
Of several medical wastes management operations in hospitals Medical wastes accidents
Accidents
Sharps and needles accidents
Participation of medical staff in waste management training programs
Medical staff training
Medical staff knowledge about risks
In this study, risk assessment focuses on the risks with sharps and needlestick manipulation, and risks from inadequate waste separation, which were chosen according to the hazards identified in literature regarding medical wastes. The estimate of infection frequency was based in data collected in hospitals from annually injuries with this material and from literature (namely probability of presence of infectious agents, of seroconversion, and of vaccination and effectiveness). The risk assessment from inadequate separation was determined using the frequency of wrong classification and separation, as evidenced in questionnaires.
The method to estimate the frequency of infections from needlestick/sharps is based on the model developed by EA (2002) and presented in Equation 1.
It was assumed that the probability of presence of infection (A) in Portugal is the same as the prevalence of HIV, Hepatitis B (HVB) and Hepatitis C (HVC), namely 0.34% of HIV (UNAIDS, 2008), 1.2 % of HVB and 1.5% of HVC (SOS Hepatite, 2008). The probability of seroconversion (C) for HIV, HVB and HVC used was based on data from CDC (2001): 0.3% of HIV, 37% of HVB and 1.8% of HVC. For the probability of vaccination (D), three scenarios were studied for HIV and HVB namely 100%, 50% and 0% of prophylaxis these injures, because HVB and HIV prophylaxis is available, but not always prescribed or taken. Prophylaxis of HVB, can be given either before or after exposure, and tends to be effective. The probability of vaccination not being effective (E) considered was 0% for HVB, and 21% for HIV since post exposure prophylaxis for HIV is available and is approximately 79% effective (CDC, 1995).
RESULTS AND DISCUSSION
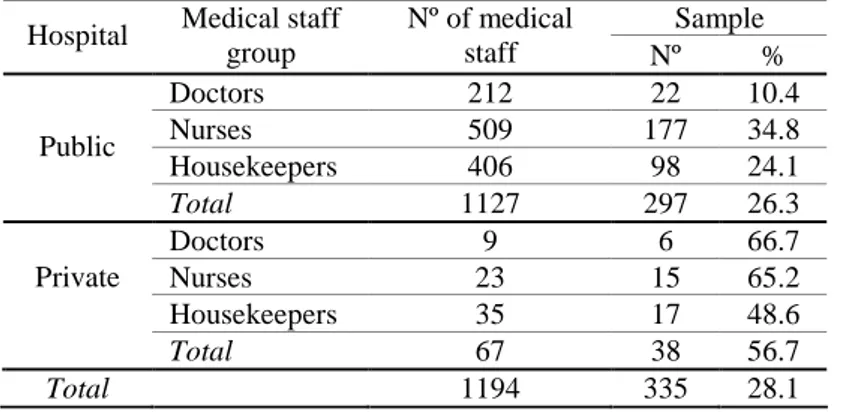
Table 3 presents the answers to the questionnaires by the medical staff groups, which represents c.a. 28% of the total of medical professionals in the studied hospitals. Nurses were the group that answered more to the questionnaires (36%, Figure 1) and the doctors the group with less number of answers (12%, Figure 1). Between public and private hospitals studied, private hospitals gave more answers (56.7% vs. 26.3%, Table 3) and were the doctors and the nurses that answered more to the questionnaires. This difference is related with the dimension of the medical population between hospitals groups (Table 3).
Table 3 Nº of medical staff in hospitals and answers received (sample).
Sample Hospital Medical staff
group Nº of medical staff Nº % Doctors 212 22 10.4 Nurses 509 177 34.8 Housekeepers 406 98 24.1 Public Total 1127 297 26.3 Doctors 9 6 66.7 Nurses 23 15 65.2 Housekeepers 35 17 48.6 Private Total 67 38 56.7 Total 1194 335 28.1 0,0 10,0 20,0 30,0 40,0 50,0
Doctors Nurses Hous ekeepers Total
%
Figure 1 Percentage of the medical staff
that answers to the questionnaires.
Medical wastes management assessment
In the studied hospitals, the medical wastes separation is made according to the groups defined in legislation. Wastes from groups I / II are non-hazardous wastes, separation and collection must be into black bags and final disposal is similar to municipal wastes. Wastes of groups III and IV are hazardous wastes. Separation and collection must be made into white bags for group III, and in red bags for group IV. Sharps and needles (group IV) must be collected in appropriate plastic sharps boxes. Table 4 presents some of the problems identified in the medical wastes management in all hospitals, due to lack of training and resources. Differences between public and private hospitals are mainly due to the size of the units. In the public hospital there is a company responsible for collecting waste in the services (on-site storage), on-site transport, central storage, off-site transport and final disposal. In private hospitals, the housekeepers perform all operations on-site before the off-site transport is made by a company responsible for the final disposal.
Nurses and housekeepers are the medical groups with a higher daily contact with medical wastes, respectively 83.8% and 84.2%. The doctors show lower daily contact, only 25.0% referred contact with medical waste. From the total of the medical staff in hospitals that answers to the questionnaires (335), 77.6% are daily in contact with medical wastes.
Table 4 Summary of problems identified.
Wastes management operations Problems Hazards
Generation and separation
- Inadequate bags (colors) for separation - Lack of information
- Inadequate utilization of personal protection equipment (PPE)
- Errors in separation - Higher exposition to
contaminated wastes Collection and transport - Inadequate transport (manually)
- Inadequate utilization of PPE
- Higher exposition to contaminated wastes
Storage - The sites are not properly marked - Expose visitors and patients to possible contamination
Figure 2 and Table 5 illustrate the medical staff knowledge about wastes separation in the legislated groups. Results indicate that, in general, the medical staff in hospitals in Algarve has some knowledge about separation of medical wastes according to the legislated groups (Figure 2). However, these percentages should be 100% to minimize the risk of waste manipulation. There are some differences between the medical staff groups. Nurse’s group shows slightly higher knowledge about medical wastes separation, with 71.6% correct answers, and doctor’s group the lowest knowledge, with 64.8% correct answers (Figure 2). The highest percentage of satisfactory separation knowledge is related to groups I/II, and more doubts occur in group IV (specific wastes), with cytotoxic and pharmaceutical, sharps and pathological wastes, for all medical staff groups (Table 5). For groups I/II, similar to municipal wastes, and group III, the infectious waste, no significant differences are obtained between medical staff groups (Table 5). However, for group IV, nurses presented more knowledge than doctors or housekeepers and doctors the lowest (Table 5). These results are related with the daily contact with the medical wastes and daily management operations, since doctors are the group that daily contacts less with wastes (25.0%). Similar results were obtained by Gonçalves (2005) in other Portuguese hospitals, between 2001 and 2004, where the medical staff knowledge and risk perceptions was also assessed.
Figure 2 Medical waste separation by different
medical staff groups.
Table 5 Correct answers about waste separation by different
medical staff groups.
Doctors Nurses Housekeepers Waste Groups Nº % Nº % Nº % Group I / II 85 75.9 612 79.7 374 81.3 Group III 98 70.0 655 68.2 393 68.3 Group IV 53 47.3 519 67.6 277 60.2 Total 236 64.8 1786 71.6 1044 69.8
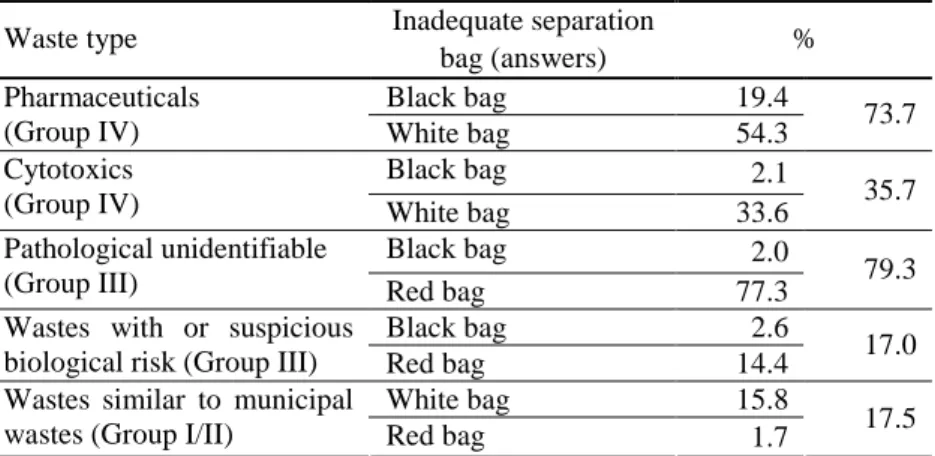
These results are also reflected in Table 6 where it is evidenced the wrong answers which mean the inadequate wastes separation.
Table 6 Inadequate wastes separation and frequency of uncorrected answers.
Inadequate separation Waste type
bag (answers) %
Black bag 19.4
Pharmaceuticals
(Group IV) White bag 54.3 73.7
Black bag 2.1
Cytotoxics
(Group IV) White bag 33.6 35.7
Black bag 2.0
Pathological unidentifiable
(Group III) Red bag 77.3 79.3
Black bag 2.6
Wastes with or suspicious
biological risk (Group III) Red bag 14.4 17.0
White bag 15.8
Wastes similar to municipal
The separation regarding pharmaceuticals and cytotoxic wastes (Group IV) presents 73.7% and 35.7%, respectively, of wrong answers. The adequate treatment for pharmaceuticals and cytotoxic wastes are incineration according with national legislation, and should be colleted in red bags. However, most medical staff (87.9 %) separates these wastes in white bags, which will lead to a pre-treatment (e.g. autoclaving) (Table 6). The autoclave of these wastes is inadequate and it will result in negative impacts to the workers, because of the workers exposition to volatile compounds between treatment cycles (WHO, 2005b). Some pharmaceutics wastes are collected in black bags and, therefore, follows to landfill as municipal wastes (inadequate disposal), which could lead to contamination of soil and water resources. Inadequate waste separation has negative impacts in medical workers and environment.
No significant differences were obtained between public and private hospitals for waste separation in the legislated groups (68.6% of correct answers for private hospitals and 70.6% for public).
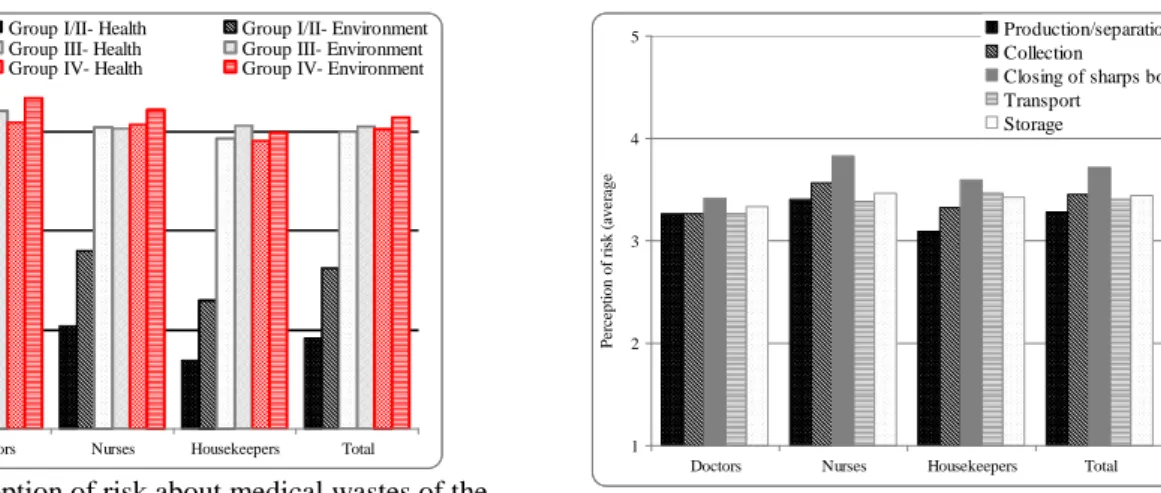
Risk perception
Figures 3 and 4 illustrate the average risk perception of medical staff groups, respectively for legislated groups and waste management operations. The risk perception of the several wastes groups and wastes management operations were evaluated on a scale from 1 to 5, being 1 the lowest perception of risk and 5 the highest.
1 2 3 4 5
Doctors Nurses Housekeepers Total
P er ce p ti o n o f ri sk (a v er ag e)
Group I/II- Health Group I/II- Environment
Group III- Health Group III- Environment
Group IV- Health Group IV- Environment
Figure 3 Perception of risk about medical wastes of the
medical staff groups.
1 2 3 4 5
Doctors Nurses Housekeepers Total
P e rc ep ti o n o f ri sk ( av e ra g e) Production/separation Collection Closing of sharps box Transport Storage
Figure 4 Perception of risk about wastes management
operations between medical staff groups.
Perception of environment risk is usually higher than the perception of health risk. This could be related to a lower knowledge about the health risks associated to incorrect handling of wastes. Groups I/II present the lowest risk perception, and groups III and IV the highest (between 3.9 and 4.3, Figure 3). The risk perceptions of groups III and IV are similar, because there is lower knowledge about the separation between these groups (Table 5). Data show that some wastes of group IV (e.g. pharmaceuticals) are put in white bags (for group III waste), and as a consequence the risk perception is lower for group IV wastes (data not shown).
The doctors group evidences a slightly higher perception of risk for all wastes groups, however shows lower health risk perception for wastes of group IV compared with group III. The housekeepers show also similar risk perception for waste of these groups (III and IV). This result coincides with lower knowledge about separation for group IV wastes by these medical staff groups (Table 5). The nurses have a higher perception of risk mean for group IV, relatively for group III, which reflects the results from Table 5. Similar results were obtained by Gonçalves (2005).
In what concerns wastes management operations, for all medical staff groups, the average perception of risk is higher for the operation of closing of sharps boxes than for any other operation (Figure 4), result also obtained by Gonçalves (2005). Nurses are the group with the highest risk perception to waste management operations, except for transport where the highest risk perception
is by the housekeepers (Figure 4). These results also evidenced that the risk perception of management operations are related with the responsibilities of each medical staff groups. Housekeepers show higher risk perception for operations of their responsibility (closing of sharps box, transport and storage) and lower for production and separation. Doctors’ perceptions of risk are identical for all management operations, because this group has the lowest daily waste contact (only 25.0%).
Private hospitals present higher risk perceptions than public hospital by medical staff for all groups of medical wastes and wastes management operations (data not shown). This result may be related with the fact that in private hospitals wastes management operations are mainly a responsibility of housekeepers, and is not made by external companies as in public hospitals. Again, more contact with wastes leads to higher perception of risk.
Training
The training program participation in hospitals is illustrated in Figures 5 and 6, for medical staff groups and hospitals groups. The doctors have the lowest participation rates in medical wastes training, and the housekeepers have the highest participation (Figure 5). These results may explain the results obtained in waste separation by groups (Table 5 and Figure 2), because housekeepers have similar percentage of correct answers despite their lower scholarship. Higher participation in training programs for public hospitals is presented in Figure 6.
Figure 5 Participation of different medical staff
groups in training programs.
Figure 6 Participation of medical staff in different
hospital groups in training programs.
These results coincide with opinion of medical staff about their own knowledge of risks associated with wastes, since 80.0% doctors admit low knowledge. For housekeepers only 47.7% admit low knowledge. According to the medical staff surveyed only 63% participated in training programs that were associated with medical wastes risks.
Risk assessment: Needlestick and sharps injuries
The percentage medical waste injury and needlestick/sharps injury reported by medical staff are shown in Figures 7 and 8, respectively. Only 21.8% of medical staff show medical waste injuries, higher percentage for housekeepers (23.4%) and lower for doctors (12.0%) (Figure 7). The doctors and nurses show more needlestick/sharps injuries because most of the injuries occur during patient care (Figure 8). The result was also obtained by Lichtveld et al. (1992) and IHWSC (2009).
To determine the infections from needlestick/sharps, the annually injuries with potentially contaminated material reported in a hospital were used. Table 7 shows data from the studied hospital, in 2008, namely the injuries with potentially contaminated material and the injuries associated with medical waste. The number of potentially contaminated material (54) is much higher than medical wastes, only five medical waste injuries occurred (9.3%), all resulting from puncture, three associated with material after disposal and two while preparing the needle for disposal. As referred in literature (Lichtveld et al., 1992) most medical injuries occur during patient care, before is considered as waste. The group more exposed to medical wastes injuries is housekeepers, since they are responsible for wastes collection. The housekeepers are the group with
more medical waste injuries (23.4%, Figure 7), and doctors and nurses the group with the highest needlestick/sharp injuries (53.8% and 41.8%, respectively, Figure 8). This is related to the daily tasks of each medical staff group – the doctors and nurses provide patient care and the housekeepers collect and transport the medical wastes.
Figure 7 Percentage of medical staff who show
medical waste injury.
Figure 8 Percentage of medical staff who show
needlestick/sharps injury.
Table 7 Medical injuries with all potentially contaminated material and the injuries associated with medical waste.
Number of injuries
Type Potentially
contaminated material Medical wasted
Puncture 39 5
Cut 5 0
Blood and body fluids splash 8 0
Others 2 0
Total 54 5
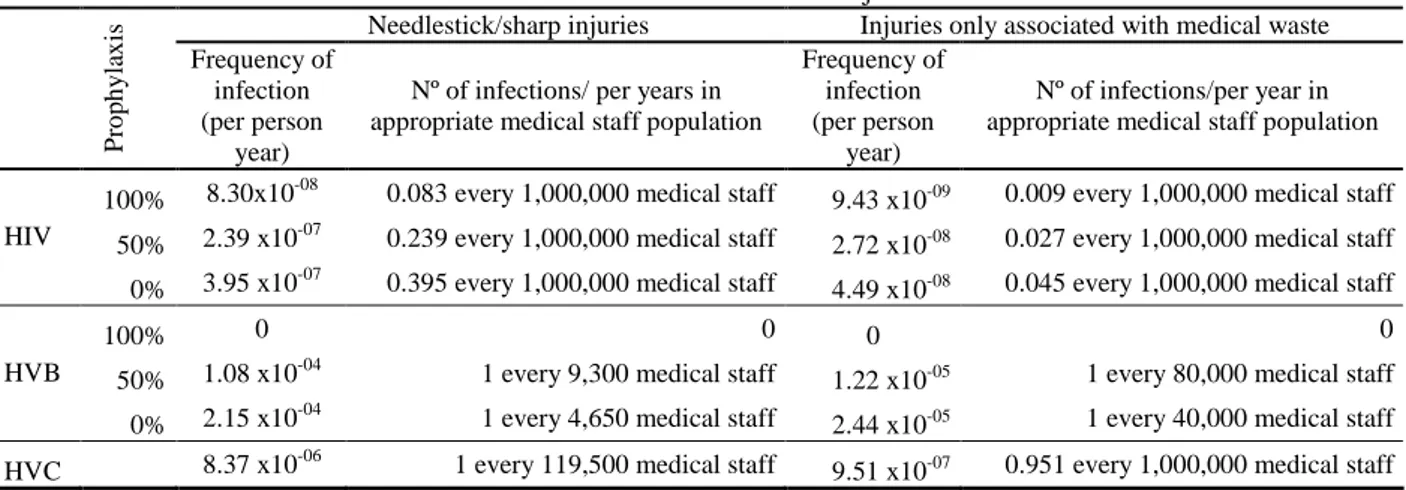
Table 8 shows the estimate of the frequency and number of annual infections based on the described methodology (EA, 2002). The risk of infection with waste needlestick/sharps injuries is higher than the risk for medical waste, and is higher for HVC and HVB transmission than for HIV. EA (2002) also evaluated the frequency of these infections at different stages in the medical waste handling and disposal processes, and obtained for 1.51x10⁻⁹ – 1.21x10⁻⁷ for HIV, 0 – 6.53x10⁻⁶ for HVB, and 1.44x10⁻⁷ – 2.53x10⁻⁶ for HVC per person/year. Therefore, the results obtained for the hospital studied are in accordance with EA (2002) results. All infection frequency of needlestick/sharp infections obtained (Table 8) are below the maximum tolerable risk for workers within the Health and Safety Executive (HSE) criteria from UK, namely 10-3 per year (1 in 1000 workers per year) (EA, 2002). In addition, IHWSC (1998) stated that according to surveys conducted in 6 hospitals in 1996-1997, 39% of incidents not reported.
Table 8 Estimated frequency and number of annual infections associated with all needlestick/sharp injuries and only
associated with medical wastes injuries.
Needlestick/sharp injuries Injuries only associated with medical waste
P ro p h y la x is Frequency of infection (per person year)
Nº of infections/ per years in appropriate medical staff population
Frequency of infection (per person
year)
Nº of infections/per year in appropriate medical staff population
100% 8.30x10-08 0.083 every 1,000,000 medical staff 9.43 x10-09 0.009 every 1,000,000 medical staff
50% 2.39 x10-07 0.239 every 1,000,000 medical staff 2.72 x10-08 0.027 every 1,000,000 medical staff HIV
0% 3.95 x10-07 0.395 every 1,000,000 medical staff 4.49 x10-08 0.045 every 1,000,000 medical staff
100% 0 0 0 0
50% 1.08 x10-04 1 every 9,300 medical staff 1.22 x10-05 1 every 80,000 medical staff
HVB
0% 2.15 x10-04 1 every 4,650 medical staff 2.44 x10-05 1 every 40,000 medical staff
The frequency of infection can be analysed by estimating the numbers of years until is likely to occur one infection in the studied medical staff population. In this way, the HVB infection is likely to occur in 4 years (0% prophylaxis) and 8 years (50% prophylaxis) for needlestick/sharp injuries, but is likely to occur in 36 years (0% prophylaxis) and 73 years (50% prophylaxis) for injuries associated with medical waste. EA (2002) compared the obtained results with real data of UK and 1 HIV infection in 20 years was estimated, whereas it occurred 4 HIV cases due to occupational exposure, and 8 HIV due to occupational exposure, in that period.
CONCLUSIONS
This study evaluates the medical waste management practices and associated risk perceptions in three hospitals from Algarve, Portugal.
The main conclusions are:
− Correct waste separation in legislated groups are associated with daily contact with the medical wastes, daily management operations and training programs;
− The wastes groups with more difficulty in separation are group IV and group III (pathological unidentifiable);
− Higher perception of risk about medical wastes, as well as the lower perception, are associated with lower knowledge about waste separation and with the management operations responsibility of each medical group;
− The frequency of injuries are associated with daily tasks of each medical group, being the housekeepers the group that have the highest frequency of injuries with medical wastes, since this groups collects these wastes;
− The estimative of frequency of injuries shows higher for needlestick and sharps than for medical wastes, but 39% of incidents with medical wastes not reported.
REFERENCES
Blenkharn J. I. (2006). Standards of clinical waste management in UK hospitals. Journal of Hospital Infection 62, pp. 300-303.
Blenkharn J. I. (2007), Standards of clinical waste management in hospitals – Second look, Journal of Hospital Infection 121, pp. 540-545.
CDC (1995). Case control study of HIV seroconversion in health care workers after percutaneous
exposure to HIV-infected blood – France, United Kingdom and United States, January 1988 – August 1994. Centers for Disease Control and Prevention. MMWR; 44, pp. 929–933.
CDC (2001).Updated US Public Health Service Guidlines for the Management of Occupational
Exposures to HBV, HCV and HIV, and Recommendations for Postexposure Prophylaxis.
Centers for Disease Control and Prevention. Morbidity and Mortality Weekly Report (MMWR) 50(RR11), pp. 1-42.
Coker, A.; Sangodoyin, A.; Sridhar, M..; Booth, C.; Olomolaiye, P.; Hammond, F. (2008). Medical
waste management in Ibadan, Nigeria: Obstacles and prospects. Waste Management, 29(2), pp.
804-811.
DGS (2006). Resíduos hospitalares 2005 – Relatório. Direcção Geral da Saúde, Divisão de Saúde Ambiental.
EA (2002). Risk assessment for handling and disposal of clinical wastes. R&D Technical Report P4-073/TR. Environment Agency. United Kingdom.
Gonçalves, M. G. (2005). Gestão de resíduos hospitalares: Conhecimentos, opções e percepções
IHWSC (1998). Annual number of occupational percutaneous injuries and mucocutaneous
exposures to blood or potentially infective biological substances. International Healthcare
Worker Safety Center, University of Virginia, EUA.
IHWSC (2009). Summary report for needlestick and sharp object Injuries (2000 to 2006). International Healthcare Worker Safety Center, University of Virginia, EUA.
Lichtveld, M.; Rodenbeck, S.; Lybarger, J. (1992). The findings of the agency for toxic substances
and disease registry Medical Waste Tracking Act Report. Environmental Health Perspectives
98, pp. 243-250.
Mostafa, G.M.A.; Shazly, M.M.; Sherief, W. I. (2007), Development of a waste management
protocol based on assessment of knowledge and practice of healthcare personnel in surgical departments. Waste Management 29 (1), pp. 430-439.
Pruss,A.; Giroult, E.; Rushbrook, P. (1999). Safer management of wastes from health care
activities. World Health Organization, Geneva.
Rahaman, H.; Ali, M. (2000). Healthcare waste management in developing countries. 26th WEDC Conference - Water, sanitation and hygiene: challenges of the millennium. Dhaka, Blangladesh. Sawalem, M.; Selic, E.; Herbell, J.-D. (2009). Hospital waste management in Lybia: A case study.
Waste Management 29, pp. 1370-1375.
Silva, C.E., Hoppe, A.E., Ravanello, M.M., Mello, N. (2004). Medical wastes management in the
south of Brazil. Waste Management. 25(6), pp. 600-605.
Shinee, E.; Gombajav, E.; Nishimura, A.; Hamajima, N.; Ito, K. (2008). Health waste management
in the capital city of Mongolia. Waste Management 28, pp. 435-444.
SOS Hepatites (2008). Números em Portugal. SOS Hepatites Portugal:
http://soshepatitesportugal.multiply.com/ (Apr. 20, 2009).
Tsakona, M. Anagnostopoulou, E. and Gidarakos, E. (2007). Hospital waste management and toxicity evaluation: a case study. Waste Management, 27 (7), 912-920.
UNAIDS (2008). Report on the global AIDS epidemic. Joint United Nations Programme on HIV/AIDS. Geneva.
WHO (2005a). Healthcare waste management. World Health Organization:
www.healthcarewaste.org (Feb. 26, 2009).
WHO (2005b). Management of solid health-care waste at primary health-care centres: A