Contents lists available atScienceDirect
Journal of Membrane Science
journal homepage:www.elsevier.com/locate/memsciA novel time lag method for the analysis of mixed gas di
ffusion in polymeric
membranes by on-line mass spectrometry: Method development and
validation
S.C. Fraga
a, M. Monteleone
b, M. Lan
č
c, E. Esposito
b, A. Fuoco
b, L. Giorno
b, K. Pilná
ček
c, K. Friess
c,
M. Carta
d, N.B. McKeown
e, P. Izák
f, Z. Petrusová
f, J.G. Crespo
a, C. Brazinha
a,⁎, J.C. Jansen
b,⁎ aLAQV/Requimte, Faculdade de Ciências e Tecnologia, Universidade Nova de Lisboa, Campus de Caparica, 2829-516 Caparica, PortugalbInstitute on Membrane Technology (ITM-CNR), Via P. Bucci 17/C, 87036 Rende, CS, Italy
cUniversity of Chemistry and Technology, Department of Physical Chemistry, Technická 5, Prague 166 28, Czech Republic
dDepartment of Chemistry, College of Science, Swansea University, Grove Building, Singleton Park, SA2 8PP Swansea, United Kingdom eEastChem, School of Chemistry, University of Edinburgh, David Brewster Road, EH9 3FJ, United Kingdom
fInstitute of Chemical Process Fundamentals, Czech Academy of Sciences, v.v.i., Rozvojová 135, 165 02 Prague 6– Suchdol, Czech Republic
A R T I C L E I N F O Keywords:
Gas separation membrane Mixed gas diffusion Time lag method Diffusion coefficient On-line mass spectrometry
A B S T R A C T
A novel method to determine the individual diffusion coefficients of gases in a mixture during their permeation through polymeric membranes is described. The method was developed in two independent laboratories, using rubbery Pebax®and glassy Hyflon®AD60X membrane samples as standards, and validated using the Tröger's base containing Polymer of Intrinsic Microporosity, PIM-EA-TB. Monitoring of the permeate composition in real time by a quadrupole mass spectrometer allowed the analysis of the permeation transient for gas mixtures. Two operation modes, either with a vacuum in the permeate and a direct connection to the mass spectrometer via a heated restriction, or using a sweeping gas and a heated capillary sample inlet, give excellent agreement with the traditional time lag method for single gases. A complete overview of the method development, identification of the critical parameters, instruments calibration, data elaboration and estimation of the experimental accuracy are provided. Validation with PIM-EA-TB, shows that the method can also successfully detect anomalous phe-nomena, related to pressure and concentration dependency of the transport properties, physical aging or pe-netrant-induced dilation. Rapid online analysis of the permeate composition makes the method also very suitable for routine mixed gas permeability measurements.
1. Introduction
In the search for more competitive technologies in terms of process economy, reduced environmental impact or energy consumption [1], membrane separations are emerging for various applications, like nat-ural gas sweetening, biogas upgrading or carbon capture fromflue gas or industrial waste gas. Increasingly challenging separation problems, involving particularly difficult olefin/paraffin separations or particu-larly voluminous flue gas and natural gas streams, has spurred the development of novel materials with improved selectivity and/or per-meability [2]. Materials that have received considerable attention in the last 1–2 decades include glassy perfluoropolymers[3–5], polymers of intrinsic microporosity (PIMs)[6–10], microporous organic polymers (MOP)[10], thermally rearranged (TR) polymers[11–13], ionic liquids and poly(ionic liquid)s[14–16]. The development of such sophisticated
novel membrane materials inevitably requires the development of im-proved methods to study their transport properties.
Since the transport in dense polymeric membranes is governed by the solution-diffusion mechanism, the most common approach to study their transport properties, is the so-called time lag method. It allows the determination of both the permeability coefficient and the diffusion coefficient of pure gases in the polymeric matrix, and indirectly, the solubility coefficient [17,18]. This is one of the simplest and most versatile methods for determination of the diffusion coefficient and it is applicable to porous media exhibiting surface diffusion or glassy polymers with strongly nonlinear sorption behaviour[19]. The feed pressure decay in pseudo-steady state conditions[20]or the simulta-neous measurement of the feed pressure decay and the permeate pressure increase[21]were proposed to study the transport properties of materials with concentration dependent diffusion or with a strongly
https://doi.org/10.1016/j.memsci.2018.04.029
Received 9 February 2018; Received in revised form 13 April 2018; Accepted 17 April 2018 ⁎Corresponding authors.
E-mail addresses:[email protected](C. Brazinha),[email protected](J.C. Jansen).
Available online 24 April 2018
0376-7388/ © 2018 The Authors. Published by Elsevier B.V. This is an open access article under the CC BY-NC-ND license (http://creativecommons.org/licenses/BY-NC-ND/4.0/). T
nonlinear sorption isotherm, respectively. Complex problems like cluster formation may require different solutions, assuming for instance the simultaneous existence of different diffusion coefficients[22,23]. Despite the simplicity of the time lag method, a problem for highly condensable vapours like water is that sorption of the vapour at the wall of the permeate compartment may lead to a dramatic under-estimation of the permeability and an error in the diffusion coefficient [24]. In such cases, gravimetric sorption kinetics studies may provide a better method for the determination of the diffusion coefficient, while the equilibrium sorption yields the solubility.
Most available methods to measure permeability involve single gas or vapour species, which is a strong limitation considering that in many applications the individual gas species influence each other in a mix-ture. Relatively few papers discuss mixed gas sorption, providing so-lubility data of the individual gases in a mixture, e.g.[25–27]. Mixed gas permeation measurements are not straightforward because of complications in the analysis itself, and due to interactions between the species in the gas mixture, especially when dealing with polymers with nonlinear sorption behaviour, strong physical aging or slow dilation [9]. Normally, these measurements are carried out in a cross-flow cell configuration by the variable volume method, using gas chromato-graphic (GC) analysis of the gas composition. This is a relatively slow technique with a sampling time of several minutes per point for normal GC or slightly less than a minute for micro-GC, which may yield steady state permeation data but it does not allow the analysis of transient phenomena in‘fast’ materials, and thus the determination of the mixed gas diffusion coefficients. A combination of 1H and 13C NMR
spectroscopy and pulsed-field gradient NMR, studied for this purpose, allowed the determination of the solubility and diffusion coefficients of pure carbon dioxide and its mixtures with other gases[28]. However, this method is not suitable for routine analysis. Chen et al. proposed a rather laborious time lag method for gas-vapour mixtures, where one component was selectively condensed [29]. Instead, on-line mass spectrometry (MS) was proposed as an advanced on-line analytical method for process monitoring and control thanks to its high analysis speed and the possibility to provide real-time information on the pro-cess parameters[30]. The fast analysis makes it also suitable to follow Isotopic-Transient Kinetics in chemical reactions [31]. Interestingly, bothflat and hollow fibre membranes are proposed as an alternative for the direct capillary inlet to the MS[30], not taking into account the dynamics of the membrane itself in the mass transport. Indeed, mem-brane inlet mass spectrometry (MIMS) is considered as a special tech-nique, where the high permeability of the membrane should guarantee a quick response and its selectivity should enhance the sensitivity to-wards specific species, in particular vapours[32]or dissolved gases [33]. Instead of using membranes for the sake of the analysis, Schäfer et al. proposed to follow the mass transport in pervaporation mem-branes on-line by MS analysis[34]. Similarly, Zhang et al. determined the relative humidity dependence of H2and O2permeation in ionomer membranes for polymer electrolyte fuel cells [35]. Isotopic-transient permeation experiments under the steady-state pervaporation opera-tion of rubbery polymer membranes allow the determinaopera-tion of con-centration-dependent diffusion coefficients of penetrants [36]. Re-cently, the group of Crespo analysed the transient phenomena related to Abbreviations and symbols
Abbreviations
AMU Atomic mass unit BPC Back pressure controller GC Gas chromatography
HFE 1-methoxy-perfluorobutane (mixture of n-butyl and iso-butyl isomers)
MFC Massflow controller
MIMS Membrane inlet mass spectrometry or Membrane in-troduction mass spectrometry
MS Mass Spectrometer, Mass Spectrometry PC Personal computer
PDMS Polydimethylsiloxane PI Pressure indicator
PIM Polymer of intrinsic microporosity PPA Partial pressure analyser
PTFE Polytetrafluoroethylene RGA Residual gas analyser SEM Secondary Electron Multiplier STP Standard temperature and pressure
Vol Volume
Wt Weight
Symbols unit
A Membrane area, m2
c Penetrant concentration, mol m−3 D Diffusion coefficient, m2s−1
I Mass spectrometer signal intensity, Torr or mA
J Flux, cm3
STPcm−2s−1 l Membrane thickness, m or µm M Molar mass, g mol−1
p Pressure or partial pressure, Torr or mbar
P Permeability coefficient, Barrer or m3STPm m−1h−1bar−1
Q Amount of penetrant (in Eq.(30)), mol m−2 Q Volumetricflow rate, cm3
STPmin−1
R Universal gas constant, 8.314·10−5m3bar mol−1K−1 RS Relative sensitivity/Relative sensitivity factor, (–) S Solubility, m3 STPm−3bar−1 t Time, s T Absolute temperature, K V Volume, cm3or m3 x Molar fraction, (–) or %
x Number of analyses (in Error calculations), (–) y Volume concentration, (–) or %
Greek symbols
α Selectivity, (–) Θ Time lag, s
ɸ Volumetricflow rate, cm3s−1or cm3min−1(at given p, T)
π Permeance, cm3
STPcm−2min−1bar−1 Subscript/Superscript
0 Instrumental (for the time lag)
Ar Argon
Atm Atmospheric
BG Background
F Feed
i Component i, gas species i Int.St. Internal standard j Component j, gas species j
m Molar
Mem Membrane
MS (inside) Mass Spectrometer P, Perm Permeate
Raw Raw, uncorrected signal
the membrane transport by on-line, quantitative monitoring of the or-ganophilic pervaporation[37,38]and gas separation[35,39]processes. In addition, Mass Spectrometric Residual Gas Analyser (MS-RGA) has been used to study permeate under steady state permeation conditions of various Polymers of Intrinsic Microporosity (PIMs) [40–43] or for analysis of solute-membrane interaction in conventional materials via transient permeation [44]. Tremblay et al. previously described a method based on a MS-RGA for the analysis of permeability and dif-fusivity of pure He, N2, CO2and CH4in four different rubbers. How-ever, the much lower CO2permeability and CO2/N2selectivity, in for instance polydimethylsiloxane (PDMS), as compared to the literature values raises serious concerns about the accuracy of their method[39]. Here we describe a reliable method to study the transient phe-nomena during mixed gas membrane permeation and to determine the permeability and diffusion coefficient of the individual components in the mixture. We will discuss the use of MS-RGA for the continuous online analysis of the permeate gas composition, identifying all relevant instrumental and operational parameters and comparing the mixed gas transport data with those obtained with the classical time lag method in afixed volume setup for pure gases. The technique was developed using two different well-established membrane materials (Pebax® rubbery polymer and Hyflon®glassy perfluoropolymer), and validated with the glassy high performance polymer PIM-EA-TB (Scheme 1). This study illustrates the technique's wide applicability for permeability and dif-fusivity measurements and the capacity to identify fundamental trends, such as absolute and partial pressure dependence and gas composition dependence of the transport parameters. Finally, analysis of the ex-perimental error will show that the method can be used to calculate the gas diffusion coefficient with a reasonably small error for membranes with a time lag of some ten seconds or higher.
2. Materials and methods
2.1. Materials
Ethanol, absolute AnalaR NORMAPUR®ACS was supplied by VWR Chemicals (Italy). 1-Methoxy-perfluorobutane (HFE 7100) was pur-chased from 3 M. Hyflon®AD60X was purchased from Solvay-Solexis (Italy) and Pebax®2533 was kindly provided by Arkema (Italy). All products were used without further purification, unless specified otherwise.
The Tröger's base containing polymer of intrinsic microporosity, PIM-EA-TB, was synthesized as described previously [41] and the membrane was prepared in the form of a dense self-standingfilm by solvent casting and very slow evaporation of the solvent. Since PIMs are known to undergo strong physical aging[45,46], afilm sample aged for more than 6 months following methanol treatment was used for the permeation tests to minimize this performance variable.
2.2. Gases
Pure gases were supplied by Pirossigeno (Italy) at a minimum purity of 99.9995% and by Praxair (Portugal) at a minimum purity of 99.99%. Certified gas mixtures (CO2/CH4with 47.89 mol% CH4, and N2/CO2/O2 with 10.10 mol% CO2 and 10.02 mol% O2) were supplied by Sapio (Italy). The purity was ± 0.01 mol% from the certified concentration. 2.2.1. Massflow controller calibration
Custom-made gas mixtures were prepared in situ by mixing of the pure gases using calibrated EL-Flow electronic mass flow controllers (MFC) (Bronkhorst, STV Portugal). For optimum accuracy, the MFCs were calibrated periodically to check for deviations from the factory standard and to guarantee precise gas dosage. The gasflow rates were determined at ca. 10 different flow rates in the range used for the future measurements. The measurement of theflow rate was performed with a bubbleflow meter or with a digital flow meter (ADM2000 Universal
Gas Flowmeter, Agilent Technologies), appropriately correcting for at-mospheric temperature and pressure.
2.3. Membrane preparation
Hyflon®AD60X membranes were prepared as described previously, from a 5 wt% solution of the polymer, prepared by magnetic stirring of the polymer powder in the solvent HFE 7100 for 24 h at room tem-perature, normally 23 ± 2 °C[47,48]. The homogenous solution was filtered through a 0.45 µm Teflon PTFE syringe filter and poured into a stainless steel casting ring resting on a glass plate and partially covered with a petri dish to slow down the evaporation. Dense membranes were obtained by solvent evaporation for 72 h at room temperature and the membranes were used as such for the permeation tests.Pebax®2533 membranes were prepared according to the procedure reported pre-viously[49], dissolving Pebax®2533 at a concentration of 10 wt% in ethanol under slight reflux, while magnetically stirring for at least 2 h. The solution was cast into a stainless steel casting ring placed on a Teflon plate and covered with a Petri dish to slow down evaporation. The solution was left for 48 h to allow complete solvent evaporation at room temperature. After this time, self-standing dense membranes were obtained.A PIM-EA-TB membrane was cast from chloroform, dried in air and then methanol treated to remove residual solvent and to reset the casting history as described previously[41]. The sample was stored for over six months to allow significant initial aging and reach a more stable and time-independent performance[43].
For all membranes, a proportionally larger amount of solution was used to obtain thickerfilms.
2.4. Experimental set-up and operating conditions
2.4.1. Fixed volume time lag system for pure gases
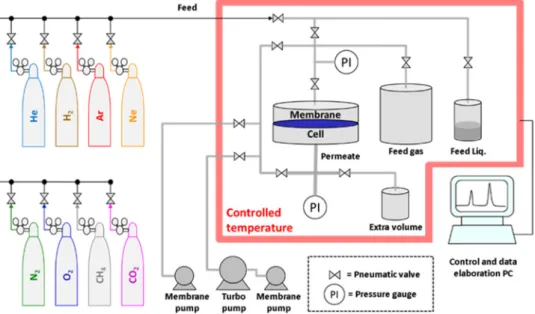
All gas permeability measurements were performed at 25.0 ± 0.5 °C and at 1 bar, unless specified otherwise, comparing three different instruments, based on either the fixed volume or the variable volume method. Thefixed volume-pressure increase instrument, con-structed by EESR is an improved version of the instrument described previously[48]and is schematically displayed inFig. 1. The instrument is equipped with afixed feed volume of about 2 l and a fixed permeate volume. The permeate volume is expandable from 91.6 cm3to 260 cm3 if it is necessary to reduce the pressure increase rate and to prolong the time available to reach steady state. A set of two membrane pumps and a turbo molecular pump (Pfeiffer), guarantee a high and oil-free va-cuum (< 10−3mbar) for effective degassing of the samples. The in-strument is provided with eight gas connections and an additional li-quid flask for vapour transport measurements. The maximum feed pressure of 2 bar is read with an accuracy of 0.1 mbar; the maximum permeate pressure of 13.3 mbar is read with a resolution of 10−4mbar.
The 75 mm circular membrane can befitted with appropriate alumi-nium masks to reduce the effective test area. Pneumatic valves auto-maticallyfill the feed volume at the desired pressure and alternate the gases in subsequent measurements. All valves are computer controlled, guaranteeing extremely short response times. The crucial parts of the setup are placed in a thermostatic chamber to perform measurements at a fixed or a stepwise changing temperature. The feed pressure,
permeate pressure and temperature are continuously monitored and exported to a datafile for subsequent analysis of the time lag, diffu-sivity, permeability and gas or vapour solubility.
The measurement is carried out on circular membranes, typically with an effective exposed area of 13.84 cm2. Smaller samples down to 1.77 cm2are prepared by masking with adhesive aluminium foil both for highly permeable membranes, to reduce the effective area, or for Fig. 1. Scheme of thefixed volume/pressure increase time lag setup.
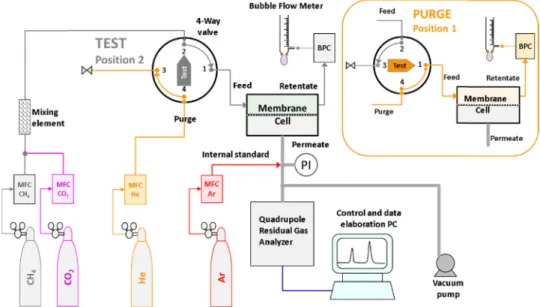
Fig. 2. Scheme of the mixed gas permeation setup in the test mode, with quadrupole gas analyser optimized for operation with a sweeping gas at the permeate side of the membrane. In the purge mode, with the 6-way valve in the 1-position (insert), argon purge gasflows from connection 3–4 through the feed side of the membrane cell and the feedflow is bypassed via connections 2-1-6-5.
fragile samples to prevent cracking under the sealing ring. At the be-ginning of each test, the membrane is degassed under high vacuum inside the permeation cell for sufficient time to remove all absorbed species (usually > 1 h). Evacuation is stopped if the baseline drift is significantly below the expected steady state pressure increase rate with the relevant gases[48]. After every run, the membrane is evacuated for a period of at least 10 times the time lag in order to completely remove the previous penetrant from the membrane. The entire permeation curve is determined, including the initial transient, to allow the de-termination of the diffusion coefficients of the penetrants by the time lag method (Annexure A), and the determination of the permeability coefficient from the steady state pressure increase rate.
2.4.2. Variable volume system using mass spectrometry for pure and mixed gases with the permeate under sweeping gas conditions
The instrumental setup for the mixed gas permeation measurements with sweeping gas is displayed inFig. 2. The key element of the system is a mass spectrometric residual gas analyser (Hiden Analytical, HPR-20 QIC Benchtop residual gas analysis system) equipped with a quadrupole massfilter (max. 200 AMU) and a heated sampling capillary with a typicalflow rate of ca. 12 cm3
STPmin−1argon at atmospheric sampling pressure. The electron ionization energy is 70 eV and the gases at low partial pressures are generally detected with the Secondary Electron Multiplier (SEM) ion detector. The Faraday detector is used for gases at higher partial pressures.
The permeation setup consists of a custom made constant pressure/ variable volume system, equipped with a modified Millipore permea-tion cell (diameter 47 mm). The feed and retentate connecpermea-tions at the upstream side, and the sweep and permeate connections at the down-stream side, are positioned in such a way to promote a spiral-likeflow profile and to minimize tangent regions or polarization phenomena inside the cell. The cell is fed with the pure and mixed gases by means of EL-FLOW electronic massflow controllers for each gas (Bronkhorst), and the pressure is controlled with an EL-PRESS electronic back pres-sure controller (Bronkhorst) in the retentate line. Two independent massflow controllers provide argon continuously to the permeate side of the cell as a sweeping gas, and periodically to the feed side of the cell when it is in purge mode between two measurements. The measure-ment cell and part of the connections are located in a thermostated chamber to guarantee operation at controlled temperature. The MS-RGA is connected to the permeate via a heated capillary and excess of the permeate/sweeping gas freely flows via a T-connection to the
atmosphere. Theflow rates are frequently checked by two glass bubble flow meters in the retentate line and in the permeate line, which are also used for the periodic calibration of the massflow controllers. The actual temperature and pressure are recorded to convert the measured bubble flow rates to standard temperature and pressure conditions (STP, 273.15 K and 1.01325 bar).
The mixed gas permeation experiments were carried out at a feed flow rate of 100–200 cm3
STP min−1and a controlled feed pressure of 0–5 bar(g). The argon sweeping gas was normally set at a flow rate of 30 cm3
STPmin−1. The permeate composition was determined via Mass Spectrometric analysis of the permeate/sweep stream, using the36Ar signal as the internal standard. Since too high humidity is known to affect the other signals and reduce the sensitivity to detect other gases by chemical reactions taking place at the filament [50], only high purity dry argon is used. Highly permeable samples were masked to limit the total permeateflow rate and to keep the stage cut close to or below 1%.
Before each analysis, the membrane wasflushed for at least 1 h at both sides with two independent argon streams until the MS signal was sufficiently stable, and this signal was taken as the background. Subsequently, the argonflux at the feed side was instantaneously re-placed by the pure gas or the gas mixture at atmospheric pressure (absolute pressure 1 bar(a)) via the 6-way valve, and the gas con-centrations in the permeate were followed as a function of time for a sufficiently long time to reach steady state. Thus, the time lag (Section 2.4.1andAnnexure A) and the permeation rate were determined after reaching steady state, and no special approximations or procedures were needed, like when only part of the transient curve is used to calculate the transport parameters[23,51]. If desired, in a second ex-periment, the feed pressure was stepwise changed from 1 to 5 bar(g) and back, with sufficiently long time intervals to reach steady state permeation in each step.
2.4.3. Variable volume system using mass spectrometry for pure and mixed gases with the permeate under vacuum conditions
The setup for performing pure and mixed gases separation experi-ments with mass-spectrometric analysis of the permeate under vacuum conditions is displayed inFig. 3. The main difference compared to the sweeping gas setup is the direct connection of its permeate side with the mass spectrometer via a restriction. The permeate side is kept at low pressure using a dry and oil-free diaphragm vacuum pump (Pfeiffer vacuum, MVP 015) and a low constant argonflux is used as an internal
Fig. 3. Scheme of the mixed gas permeation setup with quadrupole MS-RGA optimized for vacuum operation at the permeate side of the membrane in test mode and during purge with helium (Insert).
standard (1 cm3STPmin−1). The unit comprises a membrane permeation cell and mass flow controllers (EL-FLOW electronic mass flow con-trollers, Bronkhorst) for each gas, and the pressure is controlled with an EL-PRESS electronic back pressure controller (Bronkhorst). The permeate composition is monitored on-line with a frequency of ap-proximately one second, using a mass spectrometer connected directly to the permeate. The mass spectrometer (Prisma Plus QMG 220 M2, Pfeiffer Vacuum) was used in an axial beam ion source, emission cur-rent 1 mA, electron energy 70 eV, single quadrupole, secondary elec-tron multiplier SEM detection. In each permeation experiment with a defined feed gas/mixture of gases, the following operating parameters were controlled and measured: the gas feed pressure gas was main-tained at 1.05 bar(a), the totalflow rate of the inlet feed stream was 50 cm3min−1 of the gas/mixture of gases and aflow rate of 1 cm3 min−1of40Ar (internal standard) was fed directly to the permeate. The temperature of the system was kept at 17 ± 1 °C.
Before each permeation experiment, the feed side of the membrane cell was purged with helium in order to clean the membrane and the system from other gases (purge mode, position 1 inFig. 3). Following the concentrations of all gases under study in the permeate through the MS, and ensuring that all of them are at the noise level, the gas under study is introduced into the feed side, using a 4-way valve (test mode, position 2 inFig. 3) and the permeation of each gas/mixture of gases through the membrane is monitored over the time in terms of volume fraction concentration and partial pressure in the permeate compartment.
2.5. Mass spectrometric permeability measurements 2.5.1. Analysis of the gas composition
The mass spectrometer gives a characteristic spectrum for com-pounds and their fragments after ionization, according to their specific mass to charge ratio (m/z) and intensity. For the light gases used in the present work, the molecular peak or one of the fragments is normally used, and occasionally a characteristic isotope. In the absence of hy-drocarbons, nitrogen is detected here at m/z = 14 amu (AMU), to avoid overlap of N2with the CO fragments from CO2at m/z = 28 AMU in CO2/N2mixtures; methane is detected at m/z = 15 AMU (as CH3) to avoid overlap of the molecular CH4peak with the O fragment from CO2 at m/z = 16 AMU in the case of CO2/CH4mixtures. All sensitivity ratios are previously calibrated against the weaker36Ar isotope at m/z = 36 AMU (ca. 0.3% abundancy) for the sweeping gas system, and40Ar m/ z = 40 AMU for the vacuum system, both used as internal standards.
In the first step, the background signal, IBG, is measured while purging the membrane with argon at the feed and permeate side. This signal is subtracted from the raw data signal in all experiments:
= −
Ii Iraw i, IBG i, (1)
All measurements in the unit working under sweeping gas condi-tions were recorded with the MASsoft software package supplied with the mass spectrometer (Hiden), while the FlowPlot software (Bronkhorst) supplied with the pressure and massflow controllers re-gistered the pressure and gasflow rates. The raw partial pressure data were elaborated by a macro in MS Excel after synchronization of the time scales of the two sources of data. Multiplication of the background-corrected signal with the relative sensitivity, RSi, yields the partial pressure in the gas analyser, pMS,i,
=
pMS i, I RSi/ i (2)
For the sweeping gas system with an open connection of the permeate side to the air, normalization for the atmospheric pressure yields the partial pressure in the permeate/sweep stream:
= ⋅ ∑ p p p p P i Atm MS i i MS i , , , (3)
The measurements in the unit working under vacuum conditions were recorded using QUADERA software provided with the mass
spectrometer and the pressure and flow rates were acquired with FlowPlot software provided with the pressure andflow controllers. The output of the mass spectrometer is the electrical signal, Ii(A), used to calculate the volume concentration of each gas yi (vol%), and the partial pressure of each gas pi (mbar) from the total pressure in the permeate, ptotal(mbar):
= y y RS I I / · i Ar i Ar i (4) = ⋅ pi y pi total (5)
2.5.2. Determination of the permeability coefficient
When using sweeping gas conditions, the permeation rate of each species follows directly from the known sweepflow rate, QAr, and the ratio of partial pressures of the gas of interest (Eq.(3)) and of argon, pAr:
= ⋅ Q Q p p P i Ar P i Ar , , (6) This yields the permeability coefficient, Pi, and permeance,Πi, for each component: = ⋅ − P Q l p p A ( ) i P i F i P i , , , (7) = − Π Q p p A ( ) i P i F i P i , , , (8)
where l is the membrane thickness, A is the membrane area and pP,iis the partial pressure of gas i in the feed:
= ⋅
pF i, x pi F (9)
where xi is the mole fraction of gas i in the feed and pFis the feed pressure. The mixed gas selectivity is calculated as the ratio of the permeability coefficients or permeances:
= = α P P Π Π i j i j i j / (10) An important parameter is the stage cut, defined as the fraction of each component in the feed gas which permeates the membrane, and it is given by: = × = ⋅ × Stage cut Q Q Q x Q 100% 100% i P i F i P i i F , , , (11) where QF is the total feed flow rate. This value should be low to guarantee that no significant polarization phenomena occur.
The data evaluation procedure is similar for the gas permeation under vacuum conditions. In this case, the volumetricflows of the gas (es) under study and the argon in the downstream circuit of the per-meation cell, respectively Qi and QAr (cm3STP min−1) and the partial pressure of each gas, piand pAr(mbar), are related to each other ac-cording to equation: = Q Q p p i Ar i Ar (12)
Theflux of each gas in the permeate, Ji, (cm3
STPcm−2min−1) is the ratio of theflow rate of the gas through the membrane and the mem-brane area (cm2), and can be written as:
= J Q A p p · i Ar i Ar (13)
The permeability coefficient and selectivity are the same as in Eqs. (7) and (10).
3. Results and discussion 3.1. Membrane preparation
The thicknesses of the membranes prepared in this work are listed in SI Table 1. Both for the Pebax®and for the Hyflon®membranes, there is a slight variation in the properties depending on the casting procedure and the membrane thickness. Pebax® is a semi-crystalline rubbery polymer with microphase separation of the polyether and polyamide domains, and the evaporation rate affects to some degree the micro-domain size and the crystallinity. On the other hand, Hyflon®is known to retain residual solvent upon evaporation [47,48], and since the evaporation speed is thickness dependent, this will influence gas transport properties. Both effects may thus lead to variation of the transport properties and therefore more samples were prepared, and
only the ones with the most constant properties were selected for fur-ther evaluation. The PIM-EA-TB sample was solvent-cast and then methanol treated to reset the thermomechanical history, and subse-quently aged for over six months to reach a stable performance. Aging took place under atmospheric conditions without control of humidity, air exposure or any other special treatment.
3.2. Pure gas permeation in thefixed volume time lag system
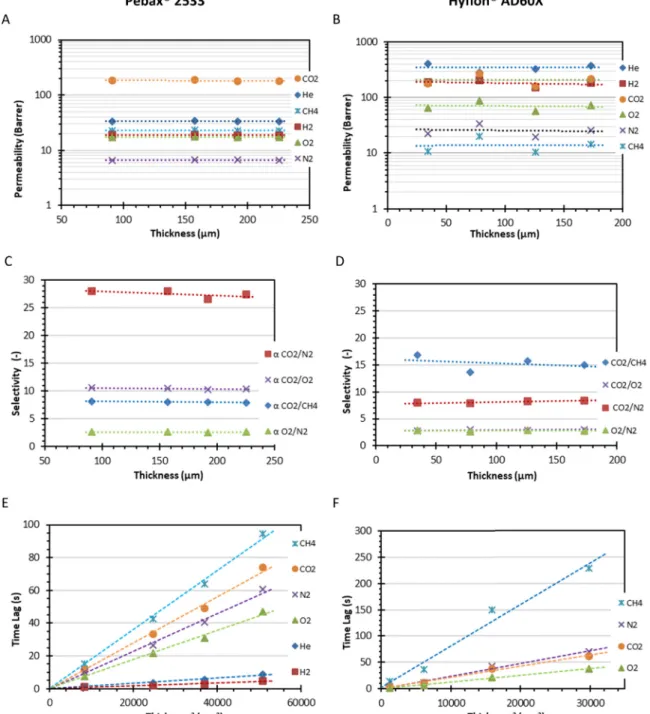
For all measurements, the results of thefixed volume time lag setup were used as a reference. For this purpose, two well-defined and re-producible samples were tested, namely the rubbery Pebax®2533 and the glassy Hyflon®AD60X.Fig. 4A and C show the permeability and ideal selectivity for several gas pairs infive Pebax®2533 samples with different thicknesses and,Fig. 4B and D show the same data for four
Fig. 4. Thickness dependence of permeability (A,B) for Pebax®2533 (left) and Hyflon®AD60X (right) with their ideal selectivity (C, D) for selected gas pairs. Determination of the diffusion coefficient for membranes with different thicknesses according to Eq.(14), D = l2/6Θ (E, F).
samples of Hyflon®AD60X. Beyond some random scatter in the data due to experimental error, there is no significant impact of the thickness on the permeability and selectivity. For this system, the diffusion coeffi-cient is determined by the well-known time lag procedure based on the penetration theory[17,18]. A detailed description of the calculation procedure is given inAnnexure A. Under normal conditions, the time lag,Θ, is proportional to the square of the membrane thickness, l, and inversely proportional to the diffusion coefficient, as in the simple equation: = Θ l D 6 2 (14) Fig. 4E and F show the dependence of the time lag on the square of the thickness for both polymers, confirming that for all tested gases the time lag follows Eq.(14)with only few seconds of experimental error (SeeAnnexure C). This means that the diffusion coefficient is essentially thickness-independent. For a microphase separated semi-crystalline block copolymers such as Pebax®2533 this is not obvious because the microdomain formation[49], and indirectly the transport properties, may depend on the evaporation rate and thus on the thickness of the castfilm. In any case, the present tests confirm that these four samples are suitable standards for the evaluation of the mixed gas transport properties. The same is valid for the Hyflon®samples, although these samples show slightly more scattering in both the permeability and the time lag values, probably because their transport properties are known to be dependent on traces of trapped residual solvent in the polymer [47,48]. For this reason, the data for Hyflon®are suitable for validation of the method, but they are not accurate enough to be used as a re-ference material for determination of the instrumental time lag (Section 3.3.3). Due to their glassy nature, the Hyflon®samples show a much stronger size selectivity than Pebax®, resulting in a higher helium per-meability than the CO2permeability and in a much longer time lag for the relatively bulky CH4than for the smaller molecules.
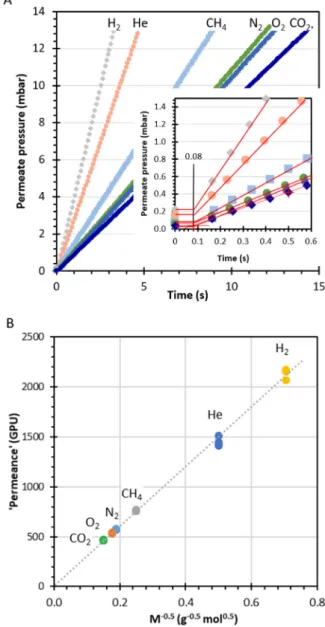
As an additional check,Fig. 5shows the response of the instrument for an aluminium foil sample with a single pinhole. In spite of the very tiny hole, the pressure increase rate of thisfilm is extremely fast, be-cause poreflow is orders of magnitude faster than diffusion through densefilms. All six tested gases show a very short delay of less than 0.1 s (inset) in the pressure increase curve, and the pressure of thefirst point is insignificant compared to the increase rate during the experiment. This confirms that the instrumental time lag for this machine is negli-gible compared to the time lags observed in the Pebax®samples in Fig. 4E and F. The pressure increase rate and thus the apparent per-meance of the pinhole show the typical Knudsen behaviour, for which the permeance is inversely proportional to the square root of the molar mass, Mi, of the permeating species and the linear regression curve passes through the origin:
∝ P M 1 i i (15)
3.3. Gas permeation in the variable volume mixed gas systems 3.3.1. Notes on the instrumental time lag in the mixed gas system
In contrast to the extremely fast pressure measurement described above, the response of most other gas analysers depends not only on the time lag of the membrane itself, but there may be an additional in-strumental time lag related to setup, representing the total delay of the permeating gas in the system before reaching the analyser. If we assume both contributions independent from each other, then the measured time lag is given by:
= +
Θi Θ0 ΘMem i, (16)
whereΘ0is the instrumental time lag andΘMem,iis the time lag induced by the diffusive transport across the membrane itself for each gas spe-cies i. For the constant pressure/variable volume systems in the present
work,Θ0reflects the total residence time of the permeating gas in the system, and is indeed not negligible. Substituting Eq.(14)in Eq.(16) yields: = + Θ Θ l D 6 i i 0 2 (17) Thus, for a set of membranes with different thicknesses, a plot of Θ versus l2should yield a straight line with slope 1/6D, intersecting the vertical axis at the valueΘ0. Once the value ofΘ0is known, the dif-fusion coefficient can be determined for any membrane by a single measurement, after subtraction of the instrumental time lag from the overall time lag:
= − D l Θ Θ 6( ) i i 2 0 (18)
The residence time of the gas in the analyser and in all tubing of both mixed gas setups (Figs. 2 and 3) contributes to the overall time lag. The individual sections contributing to the residence time are high-lighted inFig. 6. Only the sections directly after the four- or six-way
Fig. 5. (A) Determination of the instrumental time lag by an aluminium foil sample with a pinhole defect. (B) Evidence of Knudsenflux in a plot of apparent permeance versus M−0.5at different pressures according to Eq.(15). The ap-parent permeance of different gases calculated on the basis on a hypothetical active area of 2.14 cm2.
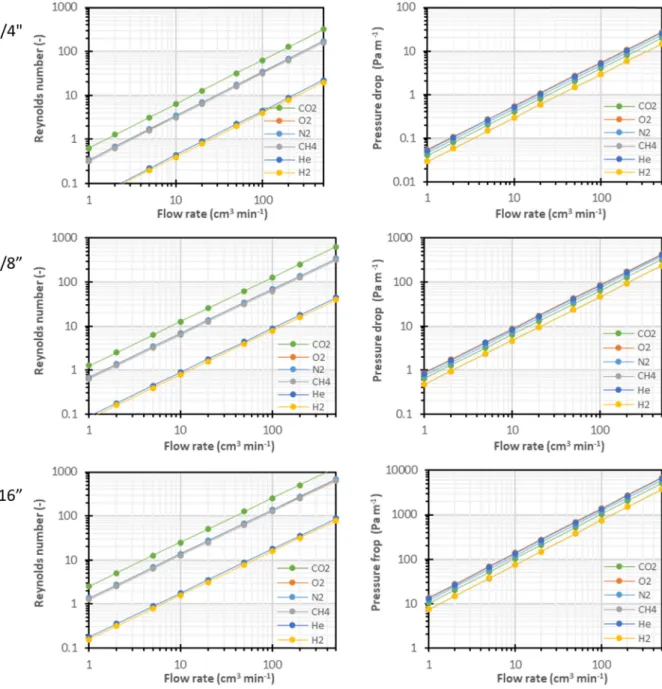
valve are relevant forΘ0, because the feed stream is alreadyflowing before switching this valve from the purge position to the test position. To optimize the method, each part of the system should have a minimum residence time, and thus thin tubes, so thatΘ0remains small. On the other hand, the pressure drop in the lines should be low too, which prohibits the use of very thin tubes. For the given system, 1/8″ tubes offer the best compromise between small volume and low pres-sure drop (SeeAnnexure B). Under the operation conditions generally used, namely a sweepflow rate from 30 cm3min−1up to 50 cm3min−1 and a feedflow rate of ca. 200 cm3min−1, theflow regime is laminar. This means that the transient related to the gas permeation through the membrane is further widened in the tubes. However, the time lag can still be determined by the tangent method as for the pure gas per-meation in thefixed volume setup.
For our systems, we can define instrumental time lag as the sum of the contributions of the feedflow reaching the membrane surface, the downstreamflow (permeate plus sweep, if used) reaching the inlet of the mass spectrometer, and the sampled gasflow reaching the analyser across the capillary or the restriction:
= + + Θ V ϕ V ϕ V ϕ Feed Feed Downstream Downstream Inlet Inlet 0 (19) where VFeed, VDownstream, and VInletare the volume of the feed side, the volume of the permeate side until the sampling point, and the volume of the injection line, respectively. Note that these volumes are obviously constant, and the term‘variable volume method’, used for this system, refers to the fact that the permeate gasflows away from the system. The terms ϕFeed, ϕDownstream, and ϕInlet indicate the respective total volu-metric flow rates in that part of the setup at given temperature and pressure: = ⋅ ⋅ ϕ Q p p T T 0 0 (20)
For the downstream side in the sweeping gas setup:
= +
ϕDownstream ϕPerm ϕSweep (21)
whereϕPermandϕSweepare theflow rates of the permeating gas and of the sweeping gas, respectively. For the vacuum setup:
= +
ϕDownstream ϕPerm ϕInt std. . (22)
whereϕInt std. . is theflow rate of the internal standard. With the as-sumption that all terms are independent, for a membrane with a given thickness, the total time lag becomes:
= + = + + + Θ Θ Θ V ϕ V ϕ V ϕ l D 6 i Mem i Feed Feed Downstream Downstream Inlet Inlet i 0 , 2 (23) In the case of a barrierfilm with pinhole defect, the membrane time lag becomes negligible and Θ=Θ0. Thus, Eq. (23) offers two in-dependent ways to determine the instrumental time lag, directly for porous membranes without time lag, or via extrapolation of a set of membranes with different thicknesses via:
= → Θ lim( )Θ l i 0 0 (24)
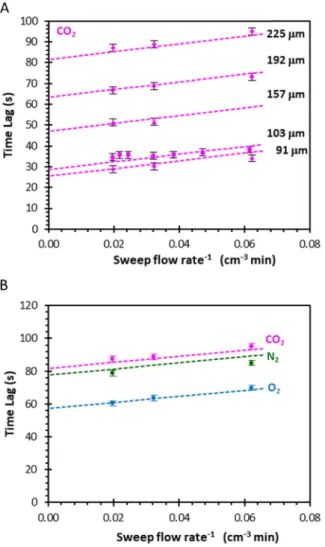
In the sweeping gas system, the value of VInletisfixed for the in-strument and that of ϕInletis dictated by the capillary used, the type of gas, and the pressure at the permeate side (atmospheric pressure in the current setup). IfϕPerm≪ϕSweep, then the gasflowing at the downstream side is nearly pure Argon and ϕInlet becomes independent of the per-meating gas. Theoretically, ϕInlet depends also on the atmospheric pressure, which defines the pressure drop over the capillary, but since atmospheric pressure is constant within a few percent, this is believed to cause negligible variation in the overall time lag. The values of VFeed and VDownstreamdepend on the membrane size, valves and various con-nections in the experimental setup. If the stage cut is negligible, then for a series of experiments with differentϕFeedandϕSweep, VFeedcan be de-termined experimentally from the slope of the curve ofΘi versus 1/ ϕFeed, and ifϕPerm≪ϕSweep, then VDownstreamcan be calculated from the slope of the curve of Θi versus 1/ϕSweep. Alternatively, the different parameters can be solved simultaneously by a least squares fitting procedure (Section 3.4).
In the vacuum system, VDownstreamisfixed and should be determined measuring the volume of the tubing. On the other hand, ϕDownstream depends on the permeate pressure and on the pumping speed of the vacuum pump, as well as theflow rate of the internal standard, which must all be kept as constant as possible. Both MS setups have their advantages and disadvantages. Watson and Baron argue that the low-pressure vacuum measurement device is preferable because it avoids interference of the sweeping gas with the permeation process[24]. On the other hand, operation at room temperature with an excess of sweeping gas allows a more stable analysis because the virtually con-stant composition (> 99% argon) guarantees a concon-stant gas sampling rate through the heated capillary. An advantage of the constant argon flow is also that it can be used as an internal standard.
3.3.2. Sensitivity factor calibration
The relative sensitivities of the different gases specified by the in-strument supplier or tabulated in the literature are not universal en-ough to be used as a standard for high precision analysis [52]and therefore both mass spectrometric instruments were periodically cali-brated for the relevant gases. In the present work, full calibration was performed by mixing each gas of interest with argon in the same con-centration range expected during the permeability measurements[53]. The relative sensitivity was then determined at different gas ratios to check that it is independent of the composition of the mixture, as it should ideally be. Therefore, the gas mixture was fed into the MS and the relative sensitivity was determined from the ratio of the Fig. 6. Scheme showing for both setups the contributions of theflowing gas to
the total time lag of the system just after switching from purge to test mode. The feedflow (thick green arrows), permeate/sweep flow (thick red arrows) and flow through the injection port into the analyser (thick blue arrows) each contribute to the instrumental time lag given by Eq.(19). Note the fundamental difference between the sweep gas setup with minimum volume lines in the permeate and analysis section, and the vacuum operated setup with voluminous vacuum connections but with low pressure.
background-corrected signals and the ratio of the gasflow rate, Qi, and the argonflow rate, QAr:
= ⋅ RS I I Q Q i Ar Ar i (25)
This procedure was repeated for each gas or gas mixture of interest, using the membrane cell with a perforated aluminium disc as a mixing element. It gives a better quantitative calibration of the partial pres-sures then the variable leak method used by Tremblay et al.[39]for a single gas, followed by correction of the ionization for different gases. The instrument with sweeping gas was calibrated against the con-centration of36Ar, which is with 0.3% natural abundance small enough to be then in the same range as the permeating gases. The instrument operating under vacuum was calibrated against the40Ar signal, because operating at much lower pressure this signal remains small enough to use the SEM ion detector for all gases. The relative sensitivity factor of each gas against argon is determined to convert the characteristic in-tensity of each gas present at the permeate compartment (44CO2,15CH4, 4He,40Ar) in its corresponding concentration (vol%) or partial pressure (mbar). A method of calibration was set using the software Quadera to obtain the calibration factor of each gas in relation to the Argon internal standard. To perform this calibration, the permeate side is evacuated for 3 h to ensure that it is clean and free from traces of gases. After this time, the permeate compartment is fed using the massflow controllers with the internal standard gas (Argon) at 1 cm3min−3and the gas to be studied with aflow rate of 50 cm3min−1, which allows to calculate of the volume concentration of each gas. Having the volume concentration of each gas, Quadera software generates the corresponding sensitivity factor of the gas under study in relation to the internal standard gas. The resulting values of the relative sensitivities in relation to argon for both methods are listed in Table 1. The values of ionization factor correction given by the supplier or given in the literature are typically represented in relation to nitrogen[39]. Recalculated values are given in Table 1as well. Although, the ionization of different gases under specific experimental conditions (ionization current and ionization energy) should in principle be very reproducible, and although the relative sensitivities are tabulated by the various producers, the dif-ferent instruments and operation conditions introduce too large de-viations to use these values for the calculation of the gas concentrations in the permeation experiments. Lieszkovszky et al. found that in dif-ferent partial pressure analysers (PPA) the response of a trace gas in argon and that of an argon trace in that same gas may depend
differently on the partial pressures of each gas[52]. This confirms that calculations cannot rely on tabulated sensitivity factors, and that cali-bration must necessarily be performed for each experiment in a specific way that most closely resembles the analysis conditions.
3.3.3. Instrumental and membrane time lag determination
A typical measurement curve for the sweeping gas setup (Fig. 2) is displayed inFig. 7A. In contrast to thefixed volume setup, where the pressure in the permeate volume represents the total amount of per-meated gas, the standard signal of the MS is the concentration of the gases in the permeate, which must be converted into the gasflow rate for each component, according to Eq.(6). Integration of this signal yields the cumulative permeated gas volume [54]. Thus, the total permeate volume, VP,i, is obtained by integration of theflow rate:
∫
= = VP i Q dt t τ P i , 0 , (26)or for discrete measurement intervals:
∑
= ⎛ ⎝ + ⎞ ⎠⋅ = + V Q Q t 2 Δ P i t τ P i t P i t t , 0 , , , , Δ (27) An example of this procedure is given inFig. 7B.The unique feature of this procedure is that the online analysis of the gas composition by the MS signal is fast enough to allow simulta-neous analysis of all components as a function of time, in contrast to analysis by gas chromatography, which may take up to several minutes
Table 1
Typical relative sensitivity factors for different gases and their selected frag-ments obtained experimentally in this work and calibrated with reference to argon.
Relative sensitivity Gas Signal Sweeping gas
setupa Vacuum setupa Reference valuesb Reference valuesc Ar 40Ar n.d. 1.00 1.2 n.d. 36Ar 1.00 n.d. n.a. 1.00 CO2 44CO2 266.2 0.59 1.4 198 28CO n.d. 0.01 122.8 22.5 O2 32O2 202.8 n.d. 0.86 321 N2 28N2 n.d. n.d. 1.00 277 14N 29.7 n.d. 13.9 19.9 CH4 15CH3 254.2 1.02 1.88 173 He 4He n.d. 0.87 0.14 1980
a Experimentally determined under normal operating conditions. Values need periodic calibration.
b From MASsoft 7 library and Application note 282: Relative Sensitivity Measurements of Gases, Hiden Analytical.
c From MASsoft 7 library and Application note 282: Relative Sensitivity Measurements of Gases, Hiden Analytical. Values normalized for36Ar.
Fig. 7. A) Example of the N2, CO2and O2permeateflow rates as calculated by Eq.(6)from the start of the experiment, including 10 min for determination of the baseline. B) Corresponding cumulative permeate volumes after switching from purge mode to test mode, as determined by Eq.(27), allowing for the simultaneous determination of all components in the gas mixture. Gas mixture: N2/CO2/O280/10/10 vol%, Membrane: 126 µm Hyflon® AD60X densefilm. Red crosses indicate thefitting interval of the tangent.
for each single point.
After integration of the volumetricflow rate, the procedure for the determination of the overall time lag is then fully equivalent to that described for the pure gases. The instrumental time lag was determined by measuring the time lag for a number of Pebax®2533 and Hyflon® AD60X membranes with different thicknesses. Fitting of the experi-mental data with Eq.(17)in a plot of the time lag as a function l2yields
Θ0as the intercept with the vertical axis, and 1/6Dias the slope of the curve (Fig. 8). The Pebax®data extrapolate to an instrumental time lag of ca. 21 s in the sweeping gas unit for mixed gas, and to a value of ca. 13 s in the vacuum gas unit, for both pure and mixed gas (50 vol% CO2 in CH4). The scatter is somewhat large for the Hyflon® sample set, and the intercept with the vertical axis yields too large differences with the different gases to be sufficiently reliable as the instrumental time lag. Fig. 8. Determination of the instrumental time lag for membranes with different thicknesses according to the equationΘi=Θ0+l2/6Difor Pebax® 2533 (A) and Hyflon®AD60X (C) in the sweeping gas setup at a sweepflow rate of 30 cm3
min−1and with gas mixture N2/O2/CO280/10/10 vol%. Dashed lines describe thefit according to the procedure inAnnexure C. Analogous results in the vacuum permeate setup (B, D) with pure CO2and CH4and in the 50/50 vol% CH4/CO2mixture. Lines correspond to a linear least squaresfit of the individual points. Comparison with the instrumental time lag determined by an aluminium foil sample with a pinhole defect in the sweeping gas setup (E) and the vacuum setup (F), respectively. In all cases the error bars are close to the size of the symbol.
Nevertheless, even for these samples, the diffusion coefficient of the different gases can still be determined with reasonable accuracy from the slope of the curves by Eq.(17). The slope of CO2is higher for the vacuum operated system than for the sweeping gas system, but this is mainly a result of the lower measurement temperature and the diffusion coefficients correspond rather well after a temperature correction (Table 2).
As an independent method for the determination of the instrumental time lag, the permeation curve of an aluminium foil with a pinhole is analysed as well. For both instruments the aluminium sample accu-rately reproduces the instrumental time lag extrapolated from mem-branes with different thicknesses, and the flux follows Knudsen beha-viour (SI Fig. 1). Flaconneche et al. who anticipated this method for determination of the diffusion coefficient[54], overlooked the necessity to introduce an instrumental time lag, correcting for the average re-sidence time of the gases in the pipes, as discussed inSection 3.3.1and implemented correctly in the present work. Instead, Watson and Baron use a slightly different setup, and determine the instrumental response from the pressure increase in the permeate chamber when a bypass valve to the pump is suddenly closed[24].
3.4. Calculation of diffusivities via simultaneous fitting procedure of all parameters
As shown inFig. 8B and D, least squaresfitting of the experimental data with Eq.(23) is somewhat sensitive to scatter in the individual data series. Therefore, slightly different values of the instrumental time lag are found for different gases and for different sets of polymers, in particular for the Hyflon®
AD60X samples. Obviously, at constant temperature and pressure, the instrument-related parameters VFeed, VDownstream and VInlet in Eq. (23) should be independent of the experi-mental conditions and the gas species. For very low permeation rates and high sweepflow rate, the sweep stream is essentially pure argon and thus also ϕInlet and VInlet/ϕInlet are constants. Thus, a calculation procedure was designed tofit all experimental data simultaneously with Eq.(23)against the independent variablesϕFeed,ϕSweepand l2, yielding the values of the instrumental parametersVFeed, VDownstream, VInlet/ϕInlet and the diffusion coefficients Difor each gas. Details of the procedure are given inAnnexure C(Fig. 13). The results of the simultaneous fit-ting of the results of ca. 30 mixed gas permeation experiments as a function of the sweepflow rate for Pebax®2533 and Hyflon®AD60X, and as a function of the feedflow rate for Pebax®2533 are given inSI
Figs. 3–5, respectively. The resulting values of the instrumental time lag, Θ0, and the standard deviation of the individual time lags 21.0 ± 1.7 s for Pebax®2533 and 23.8 ± 3.1 s for Hyflon®AD60X. The error of Pebax®2533 is low enough for accurate determination of the instrumental time lag and, subsequently, of the diffusion coefficient in new membranes. On the other hand, the slight scatter in the Hyflon® AD60X data results in a relatively large error in the instrumental time lag. In this case, the variations in the Hyflon®
AD60X results are most likely due to differences in the properties of the membranes due to residual solvent and the casting history. The variation in the results is an effective difference in the properties and not an experimental error in the determination of the time lag. Therefore, the method is reliable for any sample, but for further evaluation of unknown samples, it is best to rely on the instrumental time lag determined with Pebax®2533 or with an aluminiumfilm with pinhole defect. The calculated diffusion coefficients are listed in Table 2 and the values determined by the sweeping gas setup deviate less than 10% from the values determined by thefixed volume setup. This indicates in the first place the good accuracy of the method, and further confirms that for these two poly-mers no anomalous behaviour or significant coupling effect occurs at the given conditions, so that the pure and mixed gas diffusion coeffi-cients are essentially the same. The diffusion coefficients obtained for CO2and CH4in Pebax®2533 by the vacuum setup deviate around 23% from the values determined by the classical single gas time lag method. This difference is mostly due to the lower temperature in the vacuum-operated mixed gas instrument, vacuum-operated at 17 °C. The values of Pebax were recalculated using the van’t Hoff–Arrhenius equation:
= −
D D e0· RTE d
(28) After temperature correction, using the activation energy of diffu-sion, there is much better agreement of the values on vacuum-operated mixed gas setup with those of the other setups. The activation energy for CH4 was not available but was estimated by that of ABS (Acrylonitrile-butadiene-styrene copolymer). This choice seems justi-fied, given the very close resemblance of the activation energy reported for CO2in Pebax and in ABS (Table 2).
3.5. Validation experiments: effect of the CO2partial pressure on the CO2/ CH4mixed gas transport in the polymer of intrinsic microporosity PIM-EA-TB
In order to verify the developed method for materials with Table 2
Gas diffusion coefficients (10−12m2s−1) in Pebax®2533 and Hyflon®AD60X determined by different methods.
Fixed volume setupa Mixed gas variable volume setup
Sweep modeb Vacuum modec
Polymer Gas Pure gases (N2/CO2/O280/10/10 vol%) Mixed gases Pure gases (50 vol% CO2in CH4) Mixed gases
Pebax®2533 N2 145 ± 3.9 138.0 ± 4.6 n.d. n.d. O2 188 ± 4.5 196.8 ± 15.6 n.d. n.d. CO2 119 ± 3.0 121.8 ± 6.4 85.8 ± 3.5 (115.6)d 83 ± 2.4 (112.4)d CH4 92.5 ± 2.0 n.d. 60.6 ± 1.3 ( 98.6)d 62 ± 1.4 (100.3)d Hyflon®AD60X N 2 69.0 ± 2.8 68.2 ± 6.2 n.d. n.d. O2 131 ± 3.7 129.2 ± 10.7 n.d. n.d. CO2 78.1 ± 3.0 64.4 ± 1.7 70.8 79.0 CH4 20.9 ± 1.2 n.d. 17.8 18.6 a
Data at 25 ± 1 °C obtained from the slope of the curves inFig. 4E and F with Eq.(14). The indicated error is the standard deviation from the individually calculated diffusion coefficients for each thickness.
b Data at 23 ± 2 °C obtained from thefitting procedure described inSection 3.4andAnnexure C. c Data at 17 ± 1 °C obtained from the slope of the curves inFig. 4B and D.
dValues between parentheses are recalculated for 25 °C by the Arrhenius equation, using E
d CO, 2= 27.2 kJ mol
−1reported for Pebax[55]and estimating E d CH, 4 = 43.17 kJ mol−1, reported for ABS[56], along with Ed CO, 2= 26.6 kJ mol
nonlinear sorption and transport behaviour, the permeation of CO2/ CH4gas mixtures in the polymer of intrinsic microporosity PIM-EA-TB [41,43]was studied.Fig. 9A shows a weak negative effect of the CO2 partial pressure on the permeability coefficient of CO2both gases in an experiment with stepwise increase and decrease of the feed pressure (SI Fig. 6). In addition, this experiment shows weak hysteresis between the run with increasing CO2partial pressure (closed symbols) and subse-quently decreasing CO2 pressure (open symbols). This is due to CO2 induced swelling of the aged matrix, leading to a slightly higher per-meability and lower selectivity, as it also affects the CH4permeation. On the other hand, permeation of CO2in the CO2/CH4mixture on the vacuum setup is nearly pressure-independent, probably because the total pressure in this experiment is only 1.05 bar and thus the methane concentration is considerably lower. Therefore, the present analysis is sufficiently accurate, whereas in the case of stronger pressure (and
concentration) dependence, more complex approaches are needed to determine the transport parameters [57]. Remarkably, the CO2 meation curves on the vacuum setup show considerably faster per-meation kinetics and thus a higher diffusion coefficient with increasing CO2concentration in the mixture (SI Fig. 1). The nearly pressure-in-dependent permeability means that the increase in diffusivity (Fig. 9C) must be accompanied by decrease in the solubility (Fig. 9D). This is typical for PIMs, which usually have a strong dual mode sorption be-haviour[58]. In the sweeping gas setup, the dual mode sorption be-haviour affects CO2 more than CH4, causing a slight decrease in permselectivity with increasing pressure (Fig. 9A).
The results are in fair agreement with those reported previously for single gases[41], the differences being related to physical aging and to the mutual influence of the two gases in the membrane, either on the solubility or on the diffusivity, or both. The latter confirms the Fig. 9. Dependence of the mixed gas CO2and CH4permeability and selectivity of an aged sample PIM-EA-TB as a function of the total pressure in the sweeping gas setup (A) and as a function of the mixture composition in the vacuum setup (B) of sample PIM-EA-TB as a function of the gas mixture composition in the vacuum system. Sweeping gas system operating with mixture of 51/49 vol% CO2/CH4in the pressure range from 1 to 6 bar(a) and vacuum system operating at a total feed pressure of 1.05 bar(a) and a composition in the range of 10–50 vol% CO2. Concentration-dependence of CO2and CH4diffusivity and related selectivity (C) and indirectly calculated solubility (D). Filled symbols represent the runs with increasing pressure (A) or increasing CO2concentration (B–D) and open symbols represent the subsequently decreasing pressure or CO2concentration.
importance of being able to measure not only the permeability but also the diffusion coefficient of gas mixtures.
4. Conclusions
A novel method to determine the diffusion coefficient of individual components of gas mixtures in polymeric membranes was developed. The method, based on online analysis of the permeate composition during the transient stage of permeation, is much more powerful than the traditional time lag method in afixed volume setup because of its unique capacity to detect different gases simultaneously. Rapid sam-pling by online mass spectrometry of the permeate composition allows accurate determination of the transient behaviour.
The samples used for the method development were first fully characterized on the classical fixed volume time lag instrument. Calibration of the response of this instrument by two independent methods confirms its virtually negligible instrumental time lag of ca. 0.08 s, independent of the gas type. Thefirst method measures the time lag directly from the permeation transient of different gases through an aluminiumfilm with pinhole, and the second method extrapolates the time lag of polymerfilms with different thicknesses to zero thickness. This method also confirmed the thickness-independent properties of the Pebax test samples. In contrast, the same approach yields afinite in-strumental time lag for the mixed gas permeation setup, which re-presents the average residence time of the gases in the setup between gas exposure of the membrane and detection of the gases by the mass spectrometer. Rubbery Pebax®2533 was found to be more suitable than glassy Hyflon®AD60X for the method development and calibration of the instrumental parameters, requiring time- and history-independent membrane properties. Boundary conditions for accurate and re-producible determination of the mixed gas diffusion coefficients require that the time lag is independent of the permeation rate, and thus the latter must be negligible compared to the sweepflow rate. A low stage cut, by setting the feedflow rate much higher than the permeation rate,
then guarantees that the measured transport properties only depend on the gas composition and pressure and not on other operation condi-tions.
The instrumental time lag depends on theflow rates, the gas pres-sure, and/or the pumping efficiency in the various parts of the system, and under the usual measurement conditions, it is approximately 20 s in the sweeping gas setup and approximately 10 s in the vacuum operated setup. After correction for the instrumental time lag, the novel method can determine the mixed gas diffusion coefficients with reasonably low error for any gas mixture and any polymeric membrane with an in-trinsic time lag of some ten seconds and higher.
Thefirst validation experiments on the polymer of intrinsic micro-porosity, PIM-EA-TB, not only demonstrate the success of the method, but show also the ability to detect the concentration and pressure de-pendency of the transport parameters, and other anomalous phe-nomena related to CO2-induced dilation.
Finally, the method may easily be extended to step changes in the (partial) pressures during a running permeation experiment to study the effect of competitive sorption. The possibility to extend the studies to virtually any gas mixture, dry or humidified gases, or even gas-vapour mixtures, highlights its great potential for the investigation of mixed gas transport in polymeric membranes.
Acknowledgements
The work leading to these results has received funding from the European Union's Seventh Framework Program (FP7/2007–2013) under Grant agreement no. 608490, project M4CO2. This work was further supported by the CNR/FCT Italian/Portuguese Bilateral Project 2015–2016 “Advanced studies of the transport properties and gas se-paration by polymers of intrinsic microporosity (PIMs) and Ionic Liquid Gel Membranes via novel methods” and the CNR-CAS Bilateral Agreement 2016–2018 “Innovative polymeric membranes for perva-poration and advanced gas and vapour separations”.
Appendix A. Description of the time lag concept
The diffusion coefficient of the gases in the membranes was determined by the well-known time lag procedure, based on the penetration theory, and the instrument shown inFig. 1. If a penetrant-free membrane is exposed to the penetrant at the feed side at t = 0 and the penetrant concentration is kept very low at the permeate side, then the total amount of penetrant, Qt, passing through the membrane in time t is given by[17,18]:
∑
⎜ ⎟ ⋅ = ⋅ − − − ⎛ ⎝ − ⋅ ⋅ ⋅ ⎞ ⎠ ∞ Q l c D t l π n D n π t l 1 6 2 ( 1) exp t i n 2 2 1 2 2 2 2 (29) in which ci is the penetrant concentration at the membrane interface at the feed side, l is the membrane thickness (m) and D is the diffusion coefficient (m2s−1). For long periods of time the amount of permeant is given by:
⎜ ⎟ = ⋅ ⋅⎛ ⎝ − ⎞ ⎠ Q D c l t l D 6 t i 2 (30) For thefixed volume/pressure increase setup in the present work, Eq.(29)becomes:
∑
⎜ ⎟ = ⋅ ⋅ ⋅ ⋅ ⋅ × ⎛ ⎝ ⎜ ⋅ − − − ⎛ ⎝ − ⋅ ⋅ ⋅ ⎞ ⎠ ⎞ ⎠ ⎟ ∞ p RT A l V V p S D t l π n D n π t l 1 6 2 ( 1) exp t P m f n 2 2 1 2 2 2 2 (31) in which ptis the permeate (bar) pressure at time t (s), R is the universal gas constant (8.314·10−5m3bar mol−1K−1), T is the absolute temperature (K), A is the exposed membrane area (m2), VPis the permeate volume (m3), Vmis the molar volume of a gas at standard temperature and pressure (22.41·10−3m3STPmol−1at 0 °C and 1 atm), pfis the feed pressure (bar) and S is the gas solubility (m3STPm−3bar−1). At long times, the exponential term approaches to zero and Eq.(31)reduces to:⎜ ⎟ = ⋅ ⋅ ⋅ ⋅ ⋅ ⎛⎝ ⋅ − ⎞ ⎠= ⋅ ⋅ ⋅ ⋅ ⋅ ⎛ ⎝ − ⎞ ⎠ p RT A l V V p S D t l RT A V V p S D l t l D 1 6 6 t P m f P m f 2 2 (32) Thus, at long times a plot of ptversus time describes a straight line which, upon extrapolation, intersects the time axis at t = l2/6D, defined as the time lag,Θ (s).