Producers in Turkey*
Mail Address
Keywords Author(s)
Arrived: June/2009 Approved: September/2009
ABSTRACT
This study determined the economic effects of avian influenza on the egg-production sector of Afyon Province, Turkey. Economic indicators were compared before and during the avian influenza outbreak. A questionnaire was conducted with 75 poultry farmers. Farms were divided into three groups according to their size. The profitability of the three farm size groups was compared during two study periods: before and during the avian influenza outbreak. The results indicate that, as compared to previous levels, farms experienced significantly reduced incomes during the avian influenza episode. While net income and profit margin were found to be negative in all three farm groups during the avian influenza period, only group I showed economic loss prior to avian influenza. Average net income per group was -19,576.14, -39,810.11, and -112,035.33 YTL respectively during the avian influenza outbreak, compared with prior incomes of -5,665.51, 8,422.92, and 16,3873.71 YTL (1 USD=1.43 YTL). The profit margin per egg during avian influenza was -0.029, -0.016, -0.010 YTL in group I, II, III, respectively, as compared to -0.007, 0.003, and 0.014 YTL/egg before avian influenza. It was found that, whereas larger farms were more profitable than small farms prior to the avian influenza period, larger farms suffered greater economic losses than small farms during avian influenza outbreak in the participating farms.
INTRODUCTION
Ensuring food safety should be primary focus of national agricultural policies, irrespective of the level of economic development of agriculture. As proteins of animal origin are an important part of many people's diets, meeting the demand for animal protein is a crucial part of the food safety policy. Turkey's rapidly increasing population presents some challenges in providing for balanced nutrition, and this situation requires rational use of resources in the national economy. Even though geographical and ecological conditions in Turkey favor animal agriculture, the level of production and consumption of animal products is not sufficient to fully supply the required protein level. It is evident that many people in Turkey do not currently consume sufficient animal protein. Thus, it has been recommended that measures should be taken to increase consumption of animal protein (State, 2001).
Chicken production has an important role in Turkey's animal production sector. It significantly contributes to the Turkish economy through employment and the economic value of its products. Chicken meat and eggs have a high nutritional value and short production times. The egg-production sector presents opportunities to improve dietary quality at a relatively low economic cost. For these reasons, the egg-production sector has a central role in terms of increasing
Demircan V1**
Yilmaz H1
Dernek Z1
Bal T1
Gül M1
Koknaroglu H2
1 Department of Agricultural Economics,
Faculty of Agriculture, Süleyman Demirel University, Isparta-Turkey.
2 Department of Animal Science, Faculty
of Agriculture, Süleyman Demirel University, Isparta-Turkey.
Vecdi Demircan
Department of Agricultural Economics Faculty of Agriculture
Süleyman Demirel University Isparta-Turkey
E-mail: vecdem@ziraat.sdu.edu.tr
Avian influenza, economic analysis, laying hens.
*Supported by the Research Fund of Suleyman Demirel University (Project No. 1375-M-06)
and developing animal production (Bayaner, 1999). In recent years, important developments have been achieved in the egg-production sector in Turkey, particularly in terms of the number of hens, production, yields, production technology, and marketing cooperation. As a result of these developments, traditional village laying hens have been replaced by commercial and industrial-scale egg-production farms. Likewise, there was a 5.4 fold increase in the total number of hens in Turkey, from 64,078,000 in 1990 to 344, 819,845 in 2006. Between 1990 and 2006, egg production in Turkey increased from 384,930 to 733,348 ton/year, corresponding to a 1.9 fold increase. The total number of layers in Turkey in 2006 was 58,698,485 in 2006, representing 17% of the total laying hens (Turkish, 2006). According to 2006data, Turkey was ranked 11th in the world in terms of egg production (Food, 2006). Although these data demonstrate the progress of this sector, hen farming has several problems and its current potential cannot be completely assessed. The production system is foreign-dependent in terms of genetics. Several technologically-dependent production processes (vaccines, antibiotics, biologic and chemical elements, feed additives, growth promoters, etc.), poultry houses, hatcheries, feed mills, and processing plants have also largely been supplied by overseas companies. In addition, several feed raw materials, especially maize and soybean, have been purchased from abroad. All these factors considerably increase production costs and negatively affect the international competitiveness of Turkish egg industry. The volatility of international egg prices, due to supply-demand instabilities, means that egg prices are sometimes lower than production costs. Such fluctuations have been identified as the most significant challenge for egg-producers (State, 2001).
The first confirmed cases of avian influenza in Turkey occurred in the Manyas district of Balikesir province. The spread of disease can generally be limited by following a series of containment measures, but, as these measures were not implemented in the entire country, avian influenza appeared in the DoÅubeyazit district of AÅri province at the end of December in 2005. Across Turkey, 20 people were infected with avian influenza, 4 of whom died, and 2.5 million birds were destroyed (Yenen, 2006). The egg sector was considerably affected by avian influenza. Since the demand for chicken meat and eggs declined, producers experienced important economic losses. Producers had to sell their products below cost price, and some farms closed as a result (Demir, 2006). In the study area avian
influenza was not observed, but it affected layer farms due to a reduction in egg demand in egg price. In the study area some preventive measure instructions were given to producers, who were required to follow them by municipalities and the Ministry of Agriculture and Rural Affaires. The preventive measures included entrance restrictions in layer farms, detailed sanitation measures, and preventing the access of wild birds into the poultry houses. The additional costs resulting from these measures were paid by municipalities and Ministry of Agriculture and Rural Affaires.
The purpose of this study was to determine the economic effects of avian influenza on layer farming in Afyon province, Turkey. Afyon province has an important role in egg production and marketing, and therefore the province's production has the potential to directly affect prices throughout Turkey. Afyon is the main egg-producing and exporting province in Turkey (Under, 2007). In 2006, there were 6,183,223 layers in Afyon province, producing 87,839 tons of eggs, representing 10.5% and 12% respectively of national totals (Turkish, 2006). The value of egg exports from Afyon province is $12 millions, 17.6% of Turkey's total egg exports.
The economic effects of avian influenza were determined by comparing economic indicators during the period of avian influenza with those prior to the outbreak. It is expected that the results of the study will assist policy makers to establish compensation for producer losses and to develop solutions to problems of the egg industry.
Few studies have been published on the determination of the economic effects of avian influenza on poultry farming in Turkey. In this context, the present study helps to improve the understanding of the economic implications of avian influenza and will act as an important guide to further studies.
MATERIAL AND METHODS
between the two sampling periods. Therefore, data were obtained for the same 6-month periods in 2005 and 2006, covering the period of December-May. Numerical data on costs and income obtained in the 6-month period of 2006 are adjusted for inflation.
Surveyed areas were selected following discussion with the personnel of the Ministry of Agriculture branch in Afyon province. Based on registrations of egg-producing farms, Afyon province, Baþmakçi, Bolvadin, and ÿuhut districts were selected as questionnaire sites due to the high proportion of egg-production in those areas. According to the registration data, there are 126 layer farms in the researched area. We initially hoped to survey all registered farms. However, some farms had closed their facilities due to avian influenza, whereas other farmers chose not to participate in the survey. The questionnaires were therefore completed by 75 farmers. Due to the wide range of sizes of the participating enterprises, farms were divided into three groups, according to the number of layers. The three groups included Group I: farms with 1-10,000 birds (37 farms); Group II: farms with 10,001-30,000 birds (21 farms); and Group III: farms with more than 30,001 birds (17 farms). Information obtained from the farmers by questionnaire were evaluated using Microsoft Excel program. The data were analyzed using the General Linear Model procedure of SAS, and PDIFF statements were used to compare farm groups.
Depreciation of buildings, machinery, and livestock was calculated. Depreciation rates were 2, 4, 1.5, and 5% for concrete buildings, mud brick and wood buildings, stone buildings, and capital for machinery, respectively (Erkus et al., 1995). The following formulae
were used to calculate the interest of capital invested in machinery and buildings (Kiral et al., 1999).
ê~íÉ ÉêÉëí áåí G O
î~äìÉ ÄìáäÇáåÖ çê
ã~ÅÜáåÉêó
fåíÉêÉëí= (1)
Since end of year values were considered for machinery and building capital, real interest rates were used (Kadlec, 1985):
(
)
(
N Ñ)
N ê Ná −
+ +
= (2)
Where:
i : real interest rate r : nominal interest rate
f : inflation rate (wholesale price index)
During the surveyed period, annual nominal interest was 23.5% and the inflation rate was 11.58%; therefore, the real interest rate was found to be 10.68%.
There is plural production activity on some of the participating farms. Therefore, some variable costs for machinery were common to those production branches. When distributing common costs, the proportion of machinery use by the egg-production part of the business was evaluated. Management expenses were assumed to be 3% of variable costs. When calculating the equivalence of labor cost of the family work, the wage rate of hired workers was used as basis. In cost calculations relative to the egg-production activity, since eggs are produced and sold on a daily basis, calculation of revolving fund interest was not required, because there is very short period between production and sale periods. (Kiral et al., 1999).
However, revolving fund interest was calculated for the replacement pullet rearing period. Revolving fund interest was considered as half the interest rate (3.5 %) applied by the Turkish Republic Agricultural Bank to variable costs for laying hen production credits.
Revenue from total sales of the egg-production activity constituted gross product value. By subtracting variable costs and production costs from gross product value, gross profit and net profit were obtained, respectively. Relative return was calculated by dividing gross product value by total production costs (Erkus et al., 1995; Rehber, 2005; Inan, 1998).
RESULT AND DISCUSSION
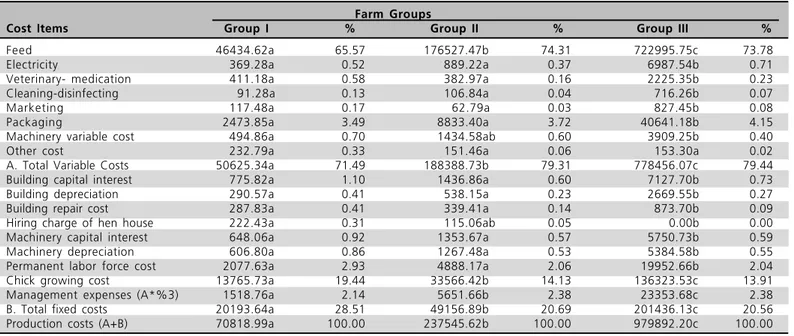
the investigated farms consisted of variable costs in both periods. During the avian influenza period, variable costs were 71.78% in group I, 77.34% in group II, and 75.09% in group III, of the total costs. In comparison, in the period before avian influenza, variable costs represented 71.49%, 79.31%, and 79.44%, respectively, of the total costs. The main reason for the high proportion of variable costs is the cost of poultry feed. Between 2000 and 2006, the price of layer feed in Turkey increased in approximately 300%
(State, 2007; Turkish, 2008). Feed is the main cost amongst the cost items of the investigated farms. During the period of avian influenza, the cost of feed represented 65.62%, 71.92%, and 68.80% of the total costs for groups I, II, and III, respectively. During the period before the avian influenza outbreak, feed costs represented 65.57%, 74.31%, and 73.78% of the total costs for groups I, II, and III, respectively. Similar results were found in other studies. Sariözkan and Sakarya (2006) reported that the share of feed cost in the total
Table 1. Egg production costs during avian influenza period in farms (YTL).
Farm Groups
Cost Items Group I % Group II % Group III %
Feed 46638.94a 65.62 147156.71b 71.92 544059.53c 68.80 Electricity 511.73a 0.72 973.57a 0.48 9023.51b 1.14 Veterinarian- medication 411.61a 0.58 461.09a 0.23 2684.51b 0.34 Cleaning-disinfecting 92.72a 0.13 247.55a 0.12 746.58b 0.09 Marketing 92.82a 0.13 180.47a 0.09 949.89b 0.12 Packaging 2293.71a 3.23 7602.05b 3.72 31229.25c 3.95 Machinery variable cost 775.66a 1.09 1214.61a 0.59 4925.19b 0.62 Other cost 196.43a 0.28 411.75a 0.20 229.65a 0.03 A. Total Variable Costs 51013.63a 71.78 158247.80b 77.34 593848.12c 75.09 Building capital interest 830.73a 1.17 1649.88a 0.81 9008.06b 1.14 Building depreciation 311.13a 0.44 617.93a 0.30 3373.81b 0.43 Building repair cost 258.87a 0.36 410.07a 0.20 997.02b 0.13 Hiring charge of hen house 233.05 0.33 147.40 0.07 0.00 0.00 Machinery capital interest 812.31a 1.14 1449.08a 0.71 7141.90b 0.90 Machinery depreciation 760.59a 1.07 1356.82a 0.66 6687.18b 0.85 Permanent labor force cost 2872.79a 4.04 5245.43a 2.56 24467.29b 3.09 Chick growing cost 12449.84a 17.52 30735.63b 15.02 127459.26c 16.12 Management expenses (A*%3) 1530.41a 2.15 4747.43b 2.32 17815.44c 2.25 B. Total fixed costs 20059.73a 28.22 46359.68b 22.66 196949.97c 24.91 Production costs (A+B) 71073.36a 100.00 204607.48b 100.00 790798.09c 100.00
1 USD=1.43 YTL. abc - Means with different superscripts in the same row differ (P<0.05).
Table 2. Egg production costs before avian influenza period in farms (YTL).
Farm Groups
Cost Items Group I % Group II % Group III %
Feed 46434.62a 65.57 176527.47b 74.31 722995.75c 73.78 Electricity 369.28a 0.52 889.22a 0.37 6987.54b 0.71 Veterinary- medication 411.18a 0.58 382.97a 0.16 2225.35b 0.23 Cleaning-disinfecting 91.28a 0.13 106.84a 0.04 716.26b 0.07 Marketing 117.48a 0.17 62.79a 0.03 827.45b 0.08 Packaging 2473.85a 3.49 8833.40a 3.72 40641.18b 4.15 Machinery variable cost 494.86a 0.70 1434.58ab 0.60 3909.25b 0.40 Other cost 232.79a 0.33 151.46a 0.06 153.30a 0.02 A. Total Variable Costs 50625.34a 71.49 188388.73b 79.31 778456.07c 79.44 Building capital interest 775.82a 1.10 1436.86a 0.60 7127.70b 0.73 Building depreciation 290.57a 0.41 538.15a 0.23 2669.55b 0.27 Building repair cost 287.83a 0.41 339.41a 0.14 873.70b 0.09 Hiring charge of hen house 222.43a 0.31 115.06ab 0.05 0.00b 0.00 Machinery capital interest 648.06a 0.92 1353.67a 0.57 5750.73b 0.59 Machinery depreciation 606.80a 0.86 1267.48a 0.53 5384.58b 0.55 Permanent labor force cost 2077.63a 2.93 4888.17a 2.06 19952.66b 2.04 Chick growing cost 13765.73a 19.44 33566.42b 14.13 136323.53c 13.91 Management expenses (A*%3) 1518.76a 2.14 5651.66b 2.38 23353.68c 2.38 B. Total fixed costs 20193.64a 28.51 49156.89b 20.69 201436.13c 20.56 Production costs (A+B) 70818.99a 100.00 237545.62b 100.00 979892.20c 100.00
production cost was 67.46% for small farms, 70.89% for medium-size farms, and 70.05% for larger farms. Bayaner (1991) reported that the share of feed cost in the total cost was 67.82%. Bostan (1980) found that the share of feed cost in the total production cost was 73.4%.
In order to minimize feed cost , which is the most significant economic cost in egg production, some measures are required. As Turkey produces little maize and soybeans, which are the basic components of chicken feeds, 30% of maize and 90% of soybean are imported (Ministry 2004). Higher premiums should be paid to incentive sufficient domestic maize and soybean production, thereby reducing dependence from imports. On the other hand, the other important cost item in the egg-production cycle is pullet rearing costs. The share of pullet rearing costs in the total production costs of groups I, II, and III were determined as 17.52%, 15.02%, and 16.12% for the period of avian influenza and 19.44%, 14.13%, and 13.91% for the period before avian influenza, respectively.
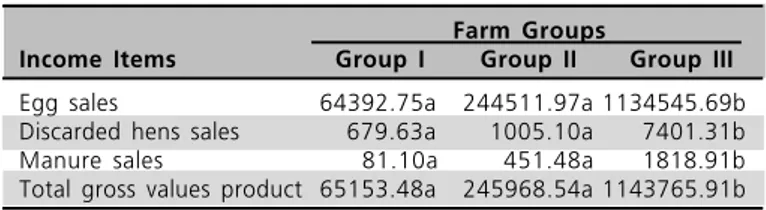
Income items during both survey periods are given in Tables 3 and 4. Gross product values per farm group during the avian influenza outbreak for farms of all sizes were significantly lower than in the period before avian influenza, as shown in Tables 3 and 4. Gross product values per farm for groups I, II, and III were 51,497.21, 164,797.37, and 678,762.76 YTL during the avian influenza period, down from 64,392.75, 244,511.97, and 1,134,545.69 YTL in the period before avian influenza, respectively. The reason for the lower gross product values during the avian influenza period could be the low egg prices obtained during that period. While the egg price during the avian influenza period was 0.059 YTL/egg, it was 0.088 YTL/egg before the avian influenza period (Registrations, 2006). During both periods, the most important part of gross product values consisted of egg sales. However, the income from egg sales as a proportion of the total gross values was lower during the avian influenza period. This can be explained by including in the gross product value, the value of the that were destroyed during the avian influenza period. Within the surveyed regions, infected and cull layers (60 weeks or older) were sacrificed, for which farmers received a compensation payment of 1.1 YTL/head from the Ministry of Agriculture and Rural Affairs (Og, 2005). The compensation payments received by groups I, II, and III made up 10.99%, 6.26%, and 5.56%, respectively, of the gross product value during the avian influenza period. The value of egg sales as a proportion of the total gross value product
during the avian influenza period therefore accounted for 88.0%, 92.46%, and 93.32% for groups I, II, and III, respectively. This compares to the 98.83%, 99.41%, and 99.19% share of egg sales during the period before avian influenza.
Table 3. Egg sales income during avian influenza period in farms (YTL).
Farm Groups
Income Items Group I Group II Group III
Egg sales 45329.79a 152378.72b 633391.51c Discarded hens sales 401.17a 1294.65a 5620.09b Destroyed hen value 5658.06a 10311.88a 37752.56b Manure sales 108.20a 812.12a 1998.60b Total gross values product 51497.21a 164797.37b 678762.76c
abc - Means with different superscripts in the same row differ (P<0.05).
Table 4. Egg sales income before avian influenza period in farms (YTL).
Farm Groups
Income Items Group I Group II Group III
Egg sales 64392.75a 244511.97a 1134545.69b Discarded hens sales 679.63a 1005.10a 7401.31b Manure sales 81.10a 451.48a 1818.91b Total gross values product 65153.48a 245968.54a 1143765.91b
ab - Means with different superscripts in the same row differ (P<0.05).
gained from a cost to the business of each monetary unit (1 YTL). Relative return should be higher than 1 in order to ensure profitability. The relative return for groups I, II, and III was 0.72, 0.81, and 0.86 during the avian influenza period, and 0.92, 1.04, and 1.17 before the avian influenza period (Tables 5 and 6). The losses recorded by all farm size groups during the avian influenza period can be explained by the reduced prices caused by reduced demand during this period. Data of the Afyon Province Office of the Ministry of Agriculture and Rural Affairs show that 35 egg-producing farms closed down due to avian influenza (Ministry, 2006). In the period prior to avian influenza, only group I lost money, but farms in group II and III were profitable. It may be explained by the fact that, although farms in group I lost money, they continued to operate because the gross product value could compensate its entire variable cost. Producers' family labor salaries, interests, and building and machinery deprecation were calculated in the cost analysis, and were included in the production costs. In other words, even when producers lost money, production continued to be economically rational because they received compensation for their labor and own capital.
Table 5. Gross profit, net profit, and relative return during avian influenza period in farms.
Farm Groups
Values (YTL/ Farms) Group I Group II Group III
Gross product value 51497.21a 164797.37b 678762.76c Variable costs 51013.63a 158247.80b 593848.12c Production costs 71073.36a 204607.48b 790798.09c Gross profit 483.58a 6549.57a 84914.64b Net profit -19576.14a -39810.11a -112035.33b Relative return 0.72a 0.81b 0.86b
Values (YTL/hen)
Gross product value 9.99a 9.30a 9.18a Variable costs 9.90a 8.93a 8.03a Production costs 13.79a 11.54ab 10.70b Gross profit 0.09a 0.37a 1.15a Net profit -3.80a -2.25b -1.52b Relative return 0.72a 0.81b 0.86b
abc - Means with different superscripts in the same row differ (P<0.05).
Cost and income factors per farm were analyzed on per hen basis. Gross profit per hen during the avian influenza period was lower than in the period before avian influenza. Gross profit per hen during the avian influenza period was determined as 0.09, 0.37, and 1.15 YTL for groups I, II, and III, as compared to 2.81, 3.01, and 4.08 YTL, respectively, in the period before avian influenza. Gross profit per hen increased as farm size increased during both studied periods. Gross profit per hen was determined to be negative for all farm
groups during the avian influenza period, but negative only for group I before avian influenza. Net profit per hen during the avian influenza period was found to be -3.80, -2.25, and -1.52 YTL for groups I, II, and III, respectively, whereas it was 1.10, 0.44, and 1.83 YTL before avian influenza. According to these results, it can be said that losses per hen decreased as farm size decreased during the avian influenza period, but increased in the period before avian influenza (Tables 5 and 6).
Table 6. Gross profit, net profit and relative return before avian influenza period in farms.
Farm Groups
Values (YTL/ Farms) Group I Group II Group III
Gross product value 65153.48a 245968.54a 1143765.91b Variable costs 50625.34a 188388.73b 778456.07c Production costs 70818.99a 237545.62b 979892.20c Gross profit 14528.13a 57579.81a 365309.84b Net profit -5665.51a 8422.92a 163873.71b Relative return 0.92a 1.04b 1.17c
Values (YTL/hen)
Gross product value 12.62a 12.85a 12.78a Variable costs 9.81a 9.84a 8.70a Production costs 13.72a 12.41ab 10.95b Gross profit 2.81a 3.01a 4.08a Net profit -1.10a 0.44b 1.83c Relative return 0.92a 1.04b 1.17c
abc - Means with different superscripts in the same row differ (P<0.05).
more profitable. The calculated profit margin was negative for all farm size groups during the avian influenza period. In comparison, the profit margin was negative for group I, but positive for groups II and III before avian influenza. Since demand for eggs dropped during the avian influenza period, the price of eggs also dropped, causing economic losses for farms. The results indicate that small producers experienced greater losses than larger producers. The profit margin for groups I, II, and III were -0.029, -0.016, and -0.010 YTL/egg during the avian influenza period, and 0.007, 0.003, and 0.014 YTL/egg before avian influenza, respectively (Tables 7 and 8).
CONCLUSIONS
This study determined the economic effects of avian influenza by comparing economic indicators of 2 periods of study - before and during the avian influenza period. The study location of Afyon Province has a significant role in egg production and marketing in Turkey. According to the results, while net profit and profit margins during the avian influenza period were found to be negative for all farm size groups, only the smallest producers (group I) made a loss in the period prior to avian influenza. It was also found that larger farms suffered lower economic losses than small farms
during the avian influenza period. Larger farms were also more profitable than smaller producers during the period before avian influenza. For this reason, new policies should be developed, focusing on enhancing farm capacity. In addition, in order to reduce the cost of feed for producers, additional support should be provided for the domestic production of raw materials of poultry feed (maize, soybean, sunflower, etc.). In order to compensate the losses of egg farmers due to avian influenza, feed and electricity inputs should be subsidized and low-interest credit facilities should be provided. In addition to these economic measures, it is necessary to create in Turkey a network to address animal health and diseases, especially those of layers. An important factor in establishing such a network would be the provision of sufficient resources for the creation and staffing of an animal health laboratory.
REFERENCES
Bayaner A. Economic analyses of laying hen farms in Çorum Province. Ankara: Research Institute for Agricultural Economics; 1999. Publications 23.
Bostan M. Economic structure of main method problems in laying hen farms in Istanbul Province [thesis]. Beyazit: Istanbul University, the Faculty of Veterinary, Department of Biostatistics and Animal Managerial Economics; 1980.
Table 7. Egg cost and margin of profit in farms during avian influenza period.
Farm Groups
Group I Group II Group III
A. Production costs (YTL/ farm) 71073.36a 204607.48b 790798.09c B Discarded hens sales (YTL/ farm) 401.17a 1294.65a 5620.09b C. Destroyed hen value (YTL/ farm) 5658.06a 10311.88a 37752.56b D. Manure sales (YTL/ farm) 108.20a 812.12a 1998.60b E. Number of eggs per farm during laying period 737420a 2566157b 10781262c F. Egg cost (YTL/egg) (A-B-C-D/E) 0.088a 0.075ab 0.069b
G. Egg cost (YTL/kg) 1.408a 1.198ab 1.106b
H. Egg sales price (YTL/egg) 0.059a 0.059a 0.059a I. Margin of profit (YTL/egg) (H-F) -0.029a -0.016ab -0.010b
abc - Means with different superscripts in the same row differ (P<0.05).
Table 8. Egg cost and margin of profit in farms before avian influenza period.
Farm Groups
Group I Group II Group III
A. Production costs (YTL/ farm) 70818.99a 237545.62b 979892.20c B. Hen discarded sales (YTL/ farm) 679.63a 1005.10a 7401.31b C. Manure sales (YTL/ farm) 81.10a 451.48a 1818.91b D. Number of eggs per farm during laying period 735682a 2764237a 13036864b E. Egg cost (YTL/egg) (A-B-C /D) 0.095a 0.085ab 0.074b
F. Egg cost (YTL/kg) 1.524a 1.367ab 1.191b
G. Egg sales price (YTL/egg) 0.088a 0.088a 0.088a H. Margin of profit (YTL/egg) (G-E) -0.007a 0.003ab 0.014b
Demir C. Protection ways from avian influenza. Journal of Science and Utopia 2006; 140(12):19-22.
Erkuþ A, Bülbül M, Kiral T, Açil A.F, Demirci R. Agricultural economics. Ankara: Agricultural Faculty of Ankara University; 1995.
Food and Agriculture Organization; 2006. Available from: http:// www.fao.org/
Inan IH. Agricultural economics and management. Tekirdag: Agricultural Faculty of TekirdaÅ, 1998.
Kadlec CE. Farm Management, decisions, operation, control. London: Prentice-Hall; 1985.
Kiral T, KasnakoÅlu H, Tatlidil F, Fidan H and GündoÅmuþ E. data base guide and production cost methodology for agricultural products. Ankara: Agricultural Economics Research Institute; 1999. Publication 37.
Ministry of Agriculture and Rural Affaires. II. Conclusion Report of Agricultural Commission of Turkey. Ankara; 2004.
Ministry of Agriculture and Rural Affaires. Reports of Afyon Province Office of the Ministry of Agriculture and Rural Affaires. Afyon; 2006.
Registrations ff Baþmakçi Laying Hen Agricultural Development Cooperative, Baþmakçi. Afyon; 2006.
Rehber E. Declaration regarding the destruction of ex-layer hens and supporting of growers [Declaration 2006/4]. Bursa: Agricultural Management and Planning; 2005. Official Gazette 26059.
Sariozkan S, Sakarya E. The profitability and productivity analyses of layer hen enterprises in Afyon Province. Journal of Lalahan Livestock Research Institute 2006; 46(1):29-44.
State Planning Organization. Animal Husbandry Commission Report. Ankara; 2001.
State Planning Organization. Animal Husbandry Commission Report. Ankara; 2007.
Statistical Analysis Systems) User's guide. 8th ed. Raleigh: SAS Institute; 1999.
Turkish Egg Producers Association [cited 2008 set 09]. Available from: http://www.yumbir.org.tr/.
Turkish Statistical Institute. Agricultural structure: production, price, value. Ankara; 2006.
Under secretariat of Foreign Trade. Registrations of Under secretariat of Foreign Trade. Ankara; 2007.