Alisson Jadavi Pereira da Silva(1), Eugênio Ferreira Coelho(2), Jarbas Honorio de Miranda(3) and Stephen Ray Workman(4)
(1)Universidade de São Paulo (USP), Escola Superior de Agricultura Luiz de Queiroz (Esalq), Departamento de Engenharia Agrícola, Avenida Pádua Dias, no 11, CEP 13418-900 Piracicaba, SP, Brazil. E-mail: ajpsilva@esalq.usp.br (2)Embrapa Mandioca e Fruticultura Tropical, Rua Embrapa, s/no, CEP 44380-000 Cruz das Almas, BA, Brazil. E-mail: eugenio@cnpmf.embrapa.br (3)USP, Esalq, Departamento de Ciências Exatas. E-mail: jhmirand@esalq.usp.br (4)Biosystems and Agricultural Engineering, Department of Biosystems and Agricultural Engineering, 105 C.E. Barnhart Bldg, Lexington, KY, USA 40546-0276. E-mail: sworkman@bae.uky.edu
Abstract – The objective of this work was to evaluate root and water distribution in irrigated banana (Musa sp.), in order to determine the water application efficiency for different drip irrigation emitter patterns. Three drip emitter patterns were studied: two 4-L h-1 emitters per plant (T1), four 4-L h-1 emitters per plant (T2), and five
4-L h-1 emitters per plant (T3). The emitters were placed in a lateral line. In the treatment T3, the emitters formed
a continuous strip. The cultivated area used was planted with banana cultivar BRS Tropical, with a 3-m spacing between rows and a 2.5-m spacing between plants. Soil moisture and root length data were collected during the first production cycle at five radial distances and depths, in a 0.20x0.20 m vertical grid. The experiment was carried out in a sandy clay loam Xanthic Hapludox. Soil moisture data were collected every 10 min for a period of five days using TDR probes. Water application efficiency was of 83, 88 and 92% for the systems with two, four and five emitters per plant, respectively. It was verified that an increase in the number of emitters in the lateral line promoted better root distribution, higher water extraction, and less deep percolation losses.
Index terms: Musa spp., root distribution, rootzone processes, TDR, water use efficiency.
Estimativa da eficiência de aplicação de água em bananeira
com diferentes sistemas de gotejamento
Resumo – O objetivo deste trabalho foi avaliar a distribuição de água e raízes de bananeira (Musa sp.) irrigada, para determinar a eficiência de aplicação de água por diferentes sistemas de irrigação por gotejamento. Foram
estudados três sistemas de gotejamento: T1, dois emissores de 4 L h-1 por planta; T2, quatro emissores de 4 L h-1
por planta; e T3, cinco emissores de 4 L h-1 por planta. Os emissores foram dispostos em uma linha lateral.
No tratamento T3, os emissores formaram uma faixa contínua. A área de cultivo foi plantada com bananeira cultivar BRS Tropical com espaçamento de 3 m entre fileiras e de 2,5 m entre plantas. Dados de umidade e comprimento de raízes foram coletados durante o primeiro ciclo da cultura, em cinco distâncias radiais e profundidades, em uma malha vertical de 0,20x0,20 m. O solo da área experimental era um Latossolo Amarelo franco-argilo-arenoso. Os dados de umidade foram coletados em intervalos de 10 min por um período de cinco dias com uso de sondas de TDR. A eficiência de aplicação de água foi de 83, 88 e 92% para os sistemas com dois, quatro e cinco emissores por planta, respectivamente. O incremento no número de emissores na linha lateral promove melhor distribuição radicular, maior extração de água e menores perdas por percolação profunda.
Termos para indexação: Musa spp., distribuição radicular, processos radiculares, TDR, eficácia na utilização da
água.
Introduction
Banana is the most consumed (30 kg per habitant) and the second most produced fruit in Brazil (Anuário
Brasileiro de Fruticultura, 2008). Despite these attributes, there still exist large technical issues to
be solved concerning banana irrigation. The crop is
sensitive to water stress and irrigation is necessary to
provide suitable soil water content during banana’s
entire production cycle (Coelho et al., 2005). Water stress during flowering and fruit growth might be one of
the main reasons for low average yield (14.1 Mg ha-1) of
banana in Brazil (Food and Agriculture Organization of the United Nations, 2007). Water use efficiency should be evaluated along with irrigation, since globally irrigated agriculture demands about 2,500 km³ of water per year,
The causes for low efficiency of water use in agriculture are numerous, complex and involve engineering,
environmental, biological, social, and economical
factors (Hsiao et al., 2007). Difficulties in determining
some parameters, such as deep percolation losses, water
potential gradients, and unsaturated soil hydraulic conductivity (Rogers et al., 1997) are limitations in
calculating water application efficiency (Ew).
Time domain reflectometry (TDR) measurements of
soil water content have become a standard for studies that involve temporal and spatial water processes in
soils, mainly due to their accuracy and automation (Heimovaara et al., 2004). They have commonly been used by many authors (Mmolawa & Or, 2000; Heimovaara et al., 2004; Ritter et al., 2005) for water
balance calculations in porous media.
The objective of this work was to evaluate root and water distributions in irrigated banana (Musa sp.), in
order to determine the water application efficiency for
different drip emitter patterns.
Materials and Methods
The work was carried out at Embrapa Mandioca e Fruticultura Tropical, in Cruz das Almas, BA, Brazil (12º48'S; 39º06'W; 225 m altitude). The area has an
average annual rainfall rate of 1,143 mm. A cultivated area with banana (Musa sp.) cultivar BRS Tropical in
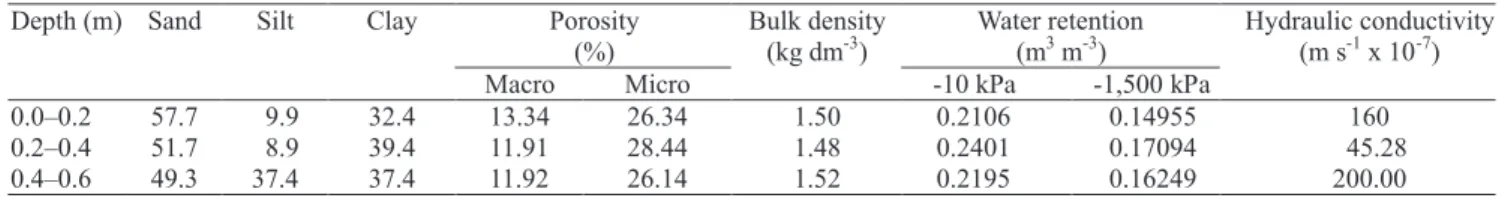
a 3x2.5-m spacing was used. Data were collected for five days during the first cycle of production in January 2006. The experiment was carried out in a sandy clay loam soil classified as Latossolo Amarelo (Xanthic Hapludox), whose physical characteristics (Claessen,
1997) are shown in Table 1.
Three different drip emitter patterns were studied: two 4-L h-1 emitters per plant (T1), four 4-L h-1 emitters
per plant (T2), and five 4-L h-1 emitters per plant (T3),
all placed in a lateral line. Treatment T3 formed a
continuous strip of emitters. The experimental plots had ten plants, but the data acquisition system was installed
around a single one due to limitations of the equipment
in terms of number of multiplexers. The water volume
applied per plant was the same in all treatments, based
on the wetted area (Keller & Bliesner, 1990) and on crop evapotranspiration considering crop coefficients suggested by Doorembos & Kassam (1994). The irrigation was carried out daily, during the five days of the data collection period. Cultivation was done by
conventional means and followed the soil fertilization
recommended by Cordeiro et al. (2000). Nitrogen, potassium, and phosphorus were applied weekly by
fertigation.
The soil moisture was monitored at five radial distances (r) and depths (z), in a 0.20x0.20 m vertical grid
measured from the plant and following its row direction.
Time domain reflectometry (TDR) probes were installed horizontally in several points of the grid.
The TDR probes with three 0.1-m long rods were made at Laboratório de Irrigação e Fertirrigação, at Embrapa Mandioca e Fruticultura Tropical, and calibrated according
to the equation θ = 6.438e3-5.5246e2 + 2.0373e - 0.0745,
in which θ is the volumetric soil moisture and e is the soil
dielectric constant.
During the installation of the TDR probes, 500 cm3 soil
samples with roots were removed from the soil profile following the same installation grid of the TDR probes
for determining the crop’s root distribution. The roots
were separated from the soil by washing (Bohm, 1979) and were digitized by scanning (Coelho et al., 2005).
The root length (Lr) was obtained using the software
Rootedge (Kaspar & Ewing, 1997). The effective root
depth and distance were established as those at the
border of the root zone with at least 80% of the total root length. Soil moisture readings started 30 days after probe installation, which was the necessary time for the soil
to stabilize the moisturization. Soil moisture data were
collected every ten minutes for a period of five days. The TDR probes used a data acquisition system composed of TDR 100 equipment and a CR10X datalogger. The infiltrated water depth (LTI) after irrigation and the extraction water depth (LTE) from the system were
computed based on soil water content data measured
Porosity (%)
Water retention (m3m-3)
Depth (m) Sand Silt Clay
Macro Micro
Bulk density (kg dm-3)
-10 kPa -1,500 kPa
Hydraulic conductivity (m s-1x 10⁻⁷)
0.0–0.2 57.7 9.9 32.4 13.34 26.34 1.50 0.2106 0.14955 160
0.2–0.4 51.7 8.9 39.4 11.91 28.44 1.48 0.2401 0.17094 45.28
0.4–0.6 49.3 37.4 37.4 11.92 26.14 1.52 0.2195 0.16249 200.00
at specific times: (k) immediately before the irrigation, (k+1) when soil water content reached its maximum
value at shallow locations (ri, zj) and the wetting front
reached the depth of 0.9 m, and (k+2) at the time of the
next irrigation (Figure 1).
Once these times were defined, the difference
between the soil water content data after irrigation (θk+1)
and before irrigation (θk) allowed the determination
of the water depth infiltrated over time (k+1) - (k) in
each position of the profile (ri): LTI = 0
∫
L
θk+1(Z - θk(Z) dz,
where: LTI is the infiltrated water depth at each
ri; θk+1(Z) is the soil water content after irrigation at
each ri ; and θk(Z) is the soil water content before
irrigation at each ri.
The average infiltrated water depth in a control
volume of the banana root zone was determined using
, where: LTIm is the total average
infiltrated water depth; LTI is the infiltrated water
depth in each ri; and i is the index standing for the
number of horizontal distances from the plant.
The difference between the soil water content values measured after the irrigation (k+1) and before the
next irrigation (k+2) in a grid point (ri, zj) allowed the
extracted water depth to be determined at each point: LTE =
0
∫
L
θk+1(Z) - θk+2(Z)dz, where: LTE is the extracted
water depth in each ri grid position; θk+1(Z) is the soil
water content after irrigation in each ri grid position,
and θk+2(Z) is the soil moisture before next irrigation
in each ri grid position.
The total average water depth extracted was obtained
according to .
The measured plant root distribution was used to
define the root effective depth as the depth at which 80% of the total roots were concentrated. Losses by deep
percolation were calculated for each point (ri, zj) located
below the root effective depth: , where:
q = (θ - θ/t)(V/A), V is the soil volume corresponding to
the probe insertion in the soil (0.2x0.2x0.10 m), A is the
section area in relation to the probe insertion in the soil
(0.2x0.2 m), t is the time interval (1 hour), q is the water
volume which passes through the unit area A in 1-hour
time, θ is the soil water content at (ri, zj) at time k, and
θ' is the soil water content at (ri, zj) at time k+1.
In this sense, losses by deep percolation in the
soil profile were obtained by . The
values of DPm at different times after the beginning of
irrigation (AI) for T1, T2 and T3 were compared by
t test (LSD) at 5% probability.
The average water application efficiency (Ea) was:
Ea = (LTEm - DPm)/LTIm.
Results and Discussion
The effective root depth and distance observed in
treatment T1 were 0.5 and 0.6 m, respectively. These
values were a little larger for treatment T2, with an effective depth and distance of 0.65 and 0.70 m,
respectively. For T3, the effective root depth and distance were 0.35 and 0.75 m, respectively. These
results are in agreement with Garcia (2000), Ramos
(2001) and Borges et al. (2008). Eighty percent of the total water extracted by the roots took place at a zone limited by r = 0.25 m and z = 0.40 m, for T1. In T2, root activity was extended in the soil profile compared to T1, and about 80% of the water extraction occurred in the zone limited by r = 0.50 m and z = 0.35 m. In T3, this zone was limited by r = 0.55 m and z = 0.35 m. As observed by Andreu et al. (1997), the zones of water extraction were influenced by the placement of emitters
around the plant. The increase in the number of emitters
was followed by an increase of effective distance of the plants’ water extraction zone. Moreover, the effective distances and depths of water extraction zones of roots
were smaller than the effective root distances and
Figure 1. Soil water content at specific times: (k), immediately before the irrigation; (k+1), when soil water content got the
maximum value at shallow locations (ri, zj) and the wetting
front reached the depth of 0.9 m; (k+2), the time of the next irrigation.
0.45
0.40
0.35
0.30
0.25
0.20
0.15
Soil
water
content
(m
m
)
3
-3
r: 0.6 m; z: 0.025 m r: 0.6 m; z: 1 m Time interval (hour)
14:45 21:2521:2510:4517:25 00:2107:0113:41 20:2103:01
(k) (k+1)
depths. This result is in agreement with Green et al. (2006) and should be considered in irrigation schedules that use soil water sensors, since the effective zones
of water extraction are commonly indicated for sensor placement in the field (Coelho et al., 2007).
The variations of available soil water (Figure 2) were more intense in the area limited by the dashed lines, in all treatments. The zones of water extraction
showed larger soil-available water at time (J+1), what is in accordance with the results obtained by Coelho & Or (1999) and Santos et al. (2005).
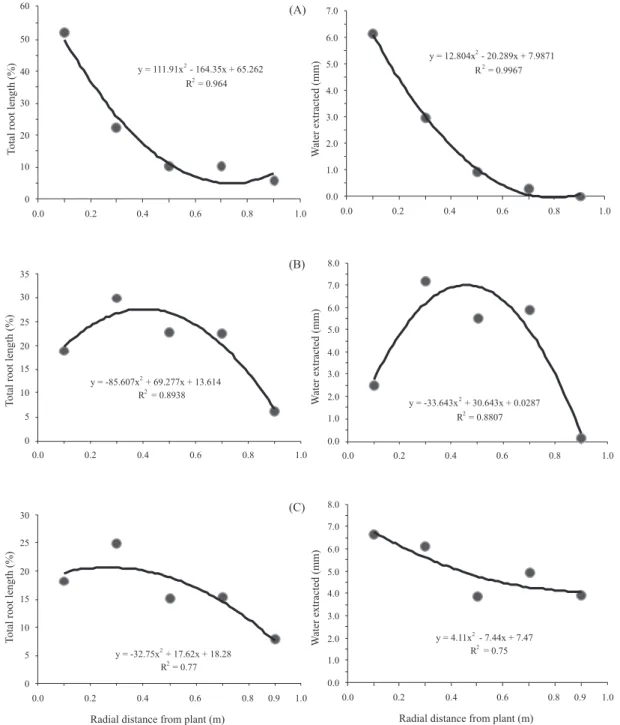
Most of the water extraction occurred at radial distances of 0 to 0.6 m in T1, and 81.2% of the total root length was found in this region (Figure 3). Most of the soil water distribution took place near the pseudostem and did not extend beyond a radial
Figure 2. Available water (%) in the soil profile at k+1 (water content got the maximum value at shallow locations and the wetting front reached the depth of 0.9 m) and k+2 (time of the next irrigation) times for treatments T1 (A, two 4-L h-1 emitters per plant), T2 (B, four 4-L h-1 emitters per
plant) e T3 (C, five 4-L h-1 emitters per plant). Dashed lines at time (k+2)
indicate zones of water extraction.
D
e
p
t
h
(
m
)
0.0 0.1 0.2 0.3 0.4 0.5 0.6 0.7 0.8 0.9 0.9
0.8 0.7 0.6 0.5 0.4 0.3 0.2 0.1 0.0
1.0
1.0 0.0 0.1 0.2 0.3 0.4 0.5 0.6 0.7 0.8 0.9 0.9
0.8 0.7 0.6 0.5 0.4 0.3 0.2 0.1 0.0
1.0
1.0
D
e
p
t
h
(
m
)
(B) (B)
0.0 0.1 0.2 0.3 0.4 0.5 0.6 0.7 0.8 0.9 0.9
0.8 0.7 0.6 0.5 0.4 0.3 0.2 0.1 0.0
1.0
1.0
D
e
p
t
h
(
m
)
0.0 0.1 0.2 0.3 0.4 0.5 0.6 0.7 0.8 0.9 0.9
0.8 0.7 0.6 0.5 0.4 0.3 0.2 0.1 0.0
1.0
1.0
D
e
p
t
h
(
m
)
(C) (C)
0.0 0.1 0.2 0.3 0.4 0.5 0.6 0.7 0.8 0.9 0.9
0.8 0.7 0.6 0.5 0.4 0.3 0.2 0.1 0.0
1.0
1.0
D
e
p
t
h
(
m
)
Distance from plant (m)
0.0 0.1 0.2 0.3 0.4 0.5 0.6 0.7 0.8 0.9 0.9
0.8 0.7 0.6 0.5 0.4 0.3 0.2 0.1 0.0
1.0
1.0
Depth
(
m
)
Distance from plant (m)
k+1 k+2
Figure 3. Total root length and water extracted at different horizontal distances (r) from the pseudostem, for treatment T1 (A, two 4-L h-1 emitters per plant); T2 (B, four 4-L h-1 emitters per plant); and
T3 (C, five 4-L h-1 emitters per plant) at different horizontal distances from the pseudostem.
distance (r) of 0.6 m for T1. This is consistent with
the emitter placement at 0.2 m from the plant. Most of the deep percolation (2.82 mm) occurred at a radial
distance of 0.2 m from the pseudostem. The average
deep percolation (DPm) observed for this treatment
was 1.36 mm (Figure 4).
The emitter location had strong influence on water extraction and root distribution in the wetted volume
in T1. This result is in agreement with several studies that involved root and water distribution under drip
irrigation systems (Coelho & Or, 1999; Santos et al.,
2005; Silva et al., 2006). The water application
efficiency (Ea) for T1 was 82.7%.
In T2, a different distribution of roots in the soil
profile around the pseudostem was observed (Figure 3). Roots and water distribution in T2 extended to a larger
y = 111.91x
2
- 164.35x + 65.262
R
2
= 0.964
0 10 20 30 40 50 60
0.0 0.2 0.4 0.6 0.8 1.0
y = 12.804x
2
- 20.289x + 7.9871
R
2
= 0.9967
0.0 1.0 2.0 3.0 4.0 5.0 6.0 7.0
0.0 0.2 0.4 0.6 0.8 1.0
T
otal
root
length
(%)
W
ater
extracte
d
(mm)
(B)
y = -85.607x
2
+ 69.277x + 13.614
R
2
= 0.8938
0 5 10 15 20 25 30 35
0.0 0.2 0.4 0.6 0.8 1.0
y = -33.643x
2
+ 30.643x + 0.0287
R
2
= 0.8807
0.0 1.0 2.0 3.0 4.0 5.0 6.0 7.0 8.0
0.0 0.2 0.4 0.6 0.8 1.0
(C)
y = -32.75x
2
+ 17.62x + 18.28
R
2
= 0.77
0 5 10 15 20 25 30
0.0 0.2 0.4 0.6 0.8 0.9
Radial distance from plant (m)
y = 4.11x
2
- 7.44x + 7.47
R
2
= 0.75
0.0 1.0 2.0 3.0 4.0 5.0 6.0 7.0 8.0
0.0 0.2 0.4 0.6 0.8 0.9
Radial distance from plant (m)
T
otal
root
lengt
h
(%)
T
otal
root
lengt
h
(%)
W
ater
extracted
(mm)
W
ater
extracted
(mm)
1.0 1.0
horizontal distance in the soil profile when compared to T1. The deep percolation losses were 18.4% smaller than the ones obtained in T1 (Figure 4). As a consequence, water application efficiency increased to 88.1%.
There were deep percolation losses in all evaluated
systems. The average values of percolated water depth
at different times after the beginning of irrigation
(AI) for T1, T2 and T3 are in Table 2. Values of percolated water depth varied significantly according to the configuration of the irrigation system during the first hour after the beginning of irrigation (AI), and no significant difference among the average values of percolated water depth was verified during
Figure 4. Infiltrated water and percolated water depths for treatment T1 (A, two 4-L h-1 emitters per
plant); T2 (B, four 4-L h-1 emitters per plant); and T3 (C, five 4-L h-1 emitters per plant) at different
horizontal distances from the pseudostem.
(A)
y = 8.3808x
2
- 14.676x + 6.3758 R
2
= 0.9379
0.0 1.0 2.0 3.0 4.0 5.0 6.0 7.0
0.0 0.2 0.4 0.6 0.8 1.0
y = 1.1442x
2
- 3.6502x + 2.3149 R
2
= 0.6827
0.0 0.5 1.0 1.5 2.0 2.5 3.0
0.0 0.2 0.4 0.6 0.8 1.0
Infiltrated
water
(mm)
Percolated
water
(mm)
(B)
y = -19.183x
2
+ 16.658x + 4.266 R
2
= 0.8065
0.0 1.0 2.0 3.0 4.0 5.0 6.0 7.0 8.0
0.0 0.2 0.4 0.6 0.8 1.0
y = -3.2321x
2
+ 2.5107x + 1.0424 R
2
= 0.4028
0.0 0.5 1.0 1.5 2.0 2.5
0.0 0.2 0.4 0.6 0.8 1.0
(C)
y = -2.2844x
2
- 2.3938x + 7.2353 R
2
= 0.6227
0.0 1.0 2.0 3.0 4.0 5.0 6.0 7.0 8.0
0.0 0.2 0.4 0.6 0.8 1.0
Radial distance from plant (m)
y = -1.0229x
2
+ 0.947x + 0.5448 R
2
= 0.4043
0.0 0.5 1.0 1.5 2.0 2.5
0.0 0.2 0.4 0.6 0.8 1.0
Radial distance from plant (m)
Percolated
water
(mm)
Percolated
water
(mm)
Infiltrated
water
(mm)
Infiltrated
water
(1)Means followed by the same letters do not differ by t test, at 5% probability. (2)T1, two 4-L h-1 emitters per plant; T2, four 4-L h-1 emitters per plant; T3, five 4 L-h-1 emitters per plant.
Time after the beginning of irrigation (hours)
Treatments (2)
1 2 4 6 8 10 12 14
T1 0.2518a 0.0725a 0.0486a 0.1160a 0.0288a 0.0821a 0.0399a 0.0000a
T2 0.1109b 0.0510a 0.1006a 0.0270a 0.0174a 0.0397a 0.0234a 0.0094a
T3 0.1246ab 0.0636a 0.0414a 0.0543a 0.0317a 0.0122a 0.0252a 0.0245a
Table 2. Mean values of percolated water depth (mm) at different times after the beginning of irrigation(1).
the period between 1 to 14 hours after the beginning of irrigation.
The average deep percolation in T3 was 52.5 and
41.8% smaller than the ones observed in T1 and T2, respectively. The water distribution pattern caused by the configuration of five emitters resulted in a good root distribution with water extraction occurring at all wetted volume under the plant (Figure 3). These
results emphasize the assertion that the soil water distribution constitutes a decisive variable in the
distribution of roots in the soil profile under drip irrigation, which is in agreement with Clothier & Green (1994) and Coelho et al. (2002). Additional
emitters and the resulting water distribution also
influence the water application efficiency of an irrigation system. The average water application
efficiency (Ea) of T3 was the largest among the three
studied systems: 92.5%.
Conclusions
1. The number and placement of drip emitters
significantly affect root and water distribution patterns
in banana.
2. An increase in the number of the emitters in lateral lines promotes larger root zone distribution,
larger water extraction, smaller losses by percolation flow, and larger water application efficiency.
References
ANDREU, L.; HOPMANS, J.W.; SCHWANK, L.J. Spatial and
temporal distribution of soil water balance for a drip-irrigated almond tree. Agricultural Water Management, v.35, p.123-146, 1997.
ANUÁRIO brasileiro da fruticultura. Santa Cruz do Sul: Gazeta Santa Cruz, 2008.
BOHM, W. Methods of studying root systems. New York:
Springer Verlag, 1979. 190p. (Ecological Studies, 33).
BORGES, A.L.; SOUZA, L. da S.; PEIXOTO, C.A.B.; SANTOS JÚNIOR, J.L.C. dos. Distribuição do sistema radicular da
bananeira 'Prata-Anã' em duas freqüências de fertirrigação com
uréia. Revista Brasileira de Fruticultura, v.30, p.259-262,
2008.
CLAESSEN, M.E.C. (Org.). Manual de métodos de análise de solo. 2.ed. Rio de Janeiro: Embrapa-CNPS, 1997. 212p.
(Embrapa-CNPS. Documentos, 1).
CLOTHIER, B.E.; GREEN, S.R. Rootzone processes and the efficient use of irrigation water. Agricultural Water Management, v.25, p.1-12, 1994.
COELHO, E.F.; OLIVEIRA, F. das C.; ARAÚJO, E.C.E.; VASCONCELOS, L.F.L. Distribuição de raízes de laranja 'Pêra'
sob sequeiro e irrigação por microaspersão em solo arenoso.
Pesquisa Agropecuária Brasileira, v.37, p.603-611, 2002.
COELHO, E.F.; OR, D. Modelo de distribuição de água e de potencial matricial no solo sob gotejamento com extração de água
por raízes. Pesquisa Agropecuária Brasileira, v.34, p.225-234, 1999.
COELHO E.F.; SANTOS D.B. dos; AZEVEDO, C.A.V. de. Sensor placement for soil water monitoring in lemon irrigated by
micro sprinkler. Revista Brasileira de Engenharia Agrícola e Ambiental, v.11, p.46-52, 2007.
COELHO, E.F.; SANTOS, M.R.; COELHO FILHO, M.A. Distribuição de raízes de mamoeiro sob diferentes sistemas de irrigação localizada em Latossolo de Tabuleiros Costeiros.
Revista Brasileira de Fruticultura, v.27, p.175-178, 2005.
CORDEIRO, Z.J.M. (Org.). Banana: produção, aspectos
técnicos. Brasília: Embrapa Comunicação para Transferência de
Tecnologia, 2000. 143p.
DOOREMBOS, J.; KASSAM, A.H. Efeito da água no rendimento das culturas. Campina Grande: UFPB, 1994. 306p.
FOOD AND AGRICULTURE ORGANIZATION OF THE UNITED NATIONS. Faostat: production: bananas. 2007. Available
at: <http://faostat.fao.org>. Accessed on: 3 July 2008.
GARCIA, R.V. Sistema radicular de bananeira irrigada por aspersão convencional e microaspersão no projeto Jaíba‑MG.
2000. 47p. Dissertação (Mestrado) - Universidade Federal de Viçosa, Viçosa.
GREEN, S.R.; KIRKHAM, M.B.; CLOTHIER, B.E. Root uptake and
transpiration: from measurements and models to sustainable irrigation.
Agricultural Water Management, v.86, p.165-176, 2006.
HEIMOVAARA, T.J.; HUISMAN J.A.; VRUGT, J.A.; BOUTEN, W. Obtaining the spatial distribution of water content along a TDR probe using the SCEM-UA bayesian inverse modeling scheme.
HSIAO, T.C.; STEDUTO, P.; FERERES, E. A systematic and quantitative approach to improve water use efficiency in agriculture.
Irrigation Science, v.25, p.209-231, 2007.
KASPAR, T.C.; EWING, R.P. Rootedge: software for measuring
root length from desktop scanner images. Agronomy Journal,
v.89, p.932-940, 1997.
KELLER, J.; BLIESNER, R.D. Sprinkle and trickle irrigation.
New York: Van Nostrand Reinhold, 1990. 652p.
MMOLAWA, K.; OR, D. Root zone solute dynamics under drip
irrigation: a review. Plant and Soil, v.222, p.163-190, 2000.
RAMOS, C.M.C. Distribuição do sistema radicular e consumo de água da bananeira irrigada por microaspersão. 2001.
62p. Dissertação (Mestrado) - Universidade Federal de Viçosa, Viçosa.
RITTER, A.; MUÑOZ-CARPENA, R.; REGALADO, C.M.; JAVAUX, M.; VANCLOOSTER, M. Using TDR and inverse modeling to characterize solute transport in a layered agricultural
volcanic soil. Vadose Zone Journal, v.4, p.300-309, 2005.
ROGERS, D.H.; LAMM, F.R.; ALAM, M.; TROOIEN, T.P.; CLARK, G.A.; BARNES, P.L.; MANKIN, K. Efficiencies and
water losses of irrigation systems. Manhattan: Kansas State
University, 1997. (Irrigation Management Series).
SANTOS, D.B. dos; COELHO, E.F.; AZEVEDO, C.A.V. de. Absorção de água pelas raízes do limoeiro sob distintas freqüências
de irrigação. Revista Brasileira de Engenharia Agrícola e Ambiental, v.9, p.327-333, 2005.
SILVA, A.J.P.; COELHO, E.F.; SANTOS, M.R.; PINHO, R.E.C.; COELHO FILHO, M.A. Distribuição e extração de água pela
bananeira BRS Tropical submetida a diferentes sistemas de
irrigação por gotejamento. In: CONGRESSO BRASILEIRO DE ENGENHARIA AGRÍCOLA, 35., 2006, João Pessoa. Agroenergia e desenvolvimento tecnológico: anais. João Pessoa: SBEA, 2006.
1 CD-ROM.
SOPHOCLEOUS, M. Global and regional water availability and
demand: prospects for the future. Natural Resources Research, v.13, p.61-75, 2004.