216 Official Journal of FIMS (International Federation of Sports Medicine)
ISMJ
International
SportMed
Journal
Original research article
Is the underwater gliding test a valid procedure to estimate the
swimmers
’
drag?
1,6*
Mr Jorge E Morais,
2,6Dr Mário J Costa, PhD,
1Mr Sérgio Jesus,
1Mr Jean
E Mejias,
3Mr Marc Moreira,
3,6Associate Professor Nuno D Garrido, PhD,
3,6Professor António J Silva, PhD,
4,6Associate Professor Daniel A
Marinho, PhD,
5,6Professor Tiago M Barbosa, PhD
1
Polytechnic Institute of Bragança, Bragança, Portugal 2
Polytechnic Institute of Guarda, Guarda, Portugal 3
University of Trás-os-Montes and Alto Douro, Vila Real, Portugal 4
University of Beira Interior, Covilhã, Portugal 5
National Institute of Education, Nanyang Technological University, Singapore 6
Research Centre in Sports, Health and Human Development, Vila Real, Portugal
*Corresponding author. Address at the end of text.
Abstract
Objective: The aim of this study was to develop a structural equation model for underwater gliding distance based on its determinant variables, in order to confirm whether it is an informative test of young swimmers’ hydrodynamic profile. Methods: Twenty-three subjects (twelve boys and eleven girls with a mean age of 13.61 ± 0.83 years old) were evaluated. The following were determined: (i) the underwater gliding distance; (ii) the squat jump performance; (iii) the passive drag; (iv) the passive drag coefficient; (v) the trunk transverse surface area and; (vi) the gliding velocity. Results: The underwater gliding distance was significantly correlated with the squat jump (rs = 0.47; p = 0.038) and with the coefficient of passive drag (rs = -0.55; p < 0.01) but not with passive drag (rs = 0.41; p = 0.09). The overall model explained 45% of the underwater gliding distance (x2/df = 3.138). Conclusion: The underwater gliding distance seems to be more dependent from the squat jump than from the passive drag. Therefore it seems as if the underwater gliding test is not representative of the swimmers’ passive drag or his /her passive drag coefficient.
Keywords:
hydrodynamics, passive drag, path-flow analysis, swimming*Mr Jorge Morais
Jorge Morais is a PhD student of the University of Tras-os-Montes and Alto Douro (Portugal) and researcher at the Research Centre in Sports, Health and Human Development (Portugal). His research focuses on the biomechanical and physiological determinant factors of the sports performance.
Dr Mário Costa, PhD
Dr Mário Costa is an Assistant Professor at the Department of Sport Sciences of the
Polytechnic Institute of Bragança (Portugal) and researcher in the Research Centre in Sports, Health and Human Development (Portugal). His research focuses on swimming biophysics and its relationship to performance.
217 Official Journal of FIMS (International Federation of Sports Medicine)
Mr Sérgio Jesus
Sérgio Jesus is an MSc student at the Polytechnic Institute of Bragança (Portugal) and researcher at the Research Centre in Sports, Health and Human Development (Portugal). His research focuses on the biomechanical and physiological determinant factors of the sports performance.
Email: [email protected]
Mr Erick Mejias
Erick Mejias is a PhD student of the University of Tras-os-Montes and Alto Douro (Portugal) and researcher at the Research Centre in Sports, Health and Human Development (Portugal). His research focuses on the biomechanical and physiological determinant factors of the sports performance.
Email: [email protected]
Mr Marc Moreira
Marc Moreira is a swimming coach and researcher at the Research Centre in Sport, Health and Human Development (Portugal). His research focuses on swimming biophysics and swimming performance.
Email: [email protected]
Associate Professor Nuno Garrido, PhD
Dr Nuno Garrido is an Associate Professor at the Department of Sport Sciences of the
University of Trás-os-Montes and Alto Douro (Portugal) and Member of the Research Centre in Sports, Health and Human Development (Portugal). His research focuses in swimming technical evaluation.
Email: ndgarrido.gmail.com
Professor Antonio J Silva, PhD
Dr António J Silva is a Full Professor at the Department of Sport Sciences of the University of Trás-os-Montes and Alto Douro (Portugal) and Member of the Research Centre in Sports, Health and Human Development (Portugal). His research focuses in the physiological and biomechanical indicators of energy cost during physical activities, especially for competitive swimming.
Email: [email protected]
Associate Professor Daniel A Marinho, PhD
Dr Daniel A Marinho is an Associate Professor at the Department of Sport Sciences of the University of Beira Interior (Portugal), Member of the Research Centre in Sports, Health and Human Development (Portugal) and swim coach. His research focuses in the biomechanical and physiological determinant factors of the sports performance, especially for the competitive swimming.
Email: [email protected]
Professor Tiago M Barbosa, PhD
Dr Tiago M Barbosa is a Professor at the Department of Physical Education and Sport Sciences of the Nanyang Technological University (Singapore) and Member of the Research Centre in Sports, Health and Human Development (Portugal). His research focuses on the biomechanical and physiological determinant factors of the sports performance.
Email: [email protected]
Introduction
Swimming velocity depends on two external forces: (i) thrust and; (ii) drag. To displace him/herself, the swimmer must produce at
218 Official Journal of FIMS (International Federation of Sports Medicine) active drag (Da) and; (ii) passive drag (Dp).
Active drag is the water resistance
associated to a swimming technique2. The Velocity Perturbation Method3 and the Measuring Active Drag System4 are two direct methods to measure Da. Active drag can also be indirectly measured through the oxygen cost of resisted and assisted swimming5. Passive drag is the water resistance when a non-swimming subject displaces in a prone streamlined position6. There are several techniques to measure Dp reported in literature: (i) by towing a subject in water7,8; (ii) by Computational Fluid Dynamics9,10 and; (iii) by inverse dynamics11,12. However, these are highly complex and/or expensive procedures to be used on regular basis by coaches. An affordable and easy way to estimate Dp is applying the underwater gliding test13. This is a less expensive, complex and time consuming test for coaches and
researchers. Indeed, practitioners use such test to assess young swimmers’
hydrodynamic profile on regular basis13-16.
There seems to be a rationale behind using the underwater gliding test as an estimation of Dp. According to Newton's second law of motion, the gliding negative acceleration depends on the resistive forces applied to a body and its inertial properties. The
resistive forces act opposite to the
displacement direction and their magnitude is highly related to velocity. Inertia of a gliding body is the sum of the body mass plus the mass of water entrained with the body17. The lower the resistive force and the higher the virtual mass, the lower the negative acceleration at each
corresponding velocity and thus the higher the glide efficiency18.
A higher gliding efficiency (i.e., gliding distance) seems to be associated to a decrease of the Dp10. At least practitioners use the gliding test considering this phenomenon and because it is easier to assess than remaining direct and indirect testing procedures reported on
literature13,19. A higher underwater gliding distance is related to Dp and the coefficient of passive drag (CDp). It is also reported that the position of the head is determinant for a better gliding performance. These authors20 reported that a neutral alignment of the head with the trunk allows a drag decrease of 17 to 20% between 2.2 and 3.1 [m·s-1]
gliding velocities. As this test starts from a wall push-off, other variables might be related to the gliding distance. This can impose a bias in the rationality of using the gliding test as an estimator of drag force. At least one study reported that lower limbs muscle power is a determinant factor to enhance the turns21. Probably the gliding distance (i.e., performed during this test) depends not only from one external force (i.e., drag) but also from the second one (i.e., propulsion by lower limbs power) affecting a subject on aquatic environment as reported in the fluid mechanics domain. So, it is questionable if underwater gliding test is an appropriate (i.e., valid) technique to estimate the swimmers’ drag.
To test the variables that might influence the gliding distance structural equation modelling can be used. The path analysis model allows understanding the
relationships between observed variables, providing a quantitative test of a
hypothesised theoretical model 22. With such data analysis procedure it is possible to analyse if the gliding distance depends only from the resistance (i.e., drag force and/or drag coefficient) or also by
propulsive forces (i.e., lower limb’s power).
In addition, if several variables influence the gliding distance, it may be possible to understand: (i) their relationship to the gliding test and; (ii) the relationships among them.
The aim of this study was to develop a structural equation model (i.e. path-flow analysis) for young swimmers’ underwater gliding distance based on some selected anthropometrical, hydrodynamic,
kinematical and neuromuscular variables, in order to confirm whether this is a valid test to analyse the swimmers’ hydrodynamic profile. It was hypothesised that other variables, besides the Dp and CDp, might be related to the underwater gliding distance.
Methods
Subjects
Twenty-three young swimmers (twelve boys and eleven girls) participating on regular basis in regional and national level
219 Official Journal of FIMS (International Federation of Sports Medicine) 0.79 years old, 160.40 ± 5.34 cm of height,
47.55 ± 6.27 kg of body mass, 3.00 ± 0.89 Tanner stages by self-evaluation, 3.54 ± 0.52 training years). Swimmers performed 6.16 ± 0.72 training units per week. They also performed dry land strength and stretching exercises, but no specific plyometric tasks.
Coaches and parents gave their consent for the swimmers participation in this study and all procedures were in accordance with the Declaration of Helsinki regarding human research. The Institutional Review Board of the University of Bragança approved the study design.
Theoretical model
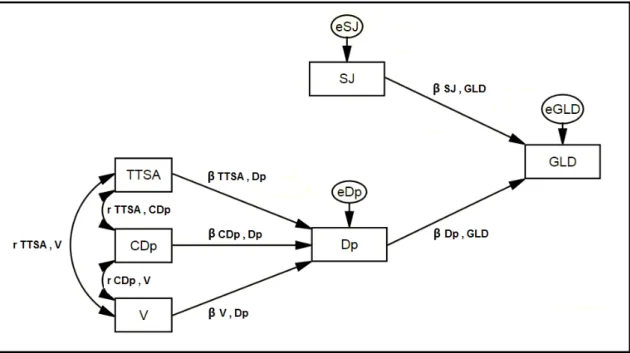
Figure 1 presents the theoretical model adopted for the underwater gliding distance
based on selected anthropometric, kinematical, hydrodynamic and neuromuscular variables in young
competitive swimmers. It is well known that drag depends on water density, swimming velocity, trunk transverse surface area and drag coefficient23. A higher underwater gliding distance might be representative of lower drag intensity. It is also reported that the Squat Jump (SJ) could improve tasks involving the power of lower limbs21, such as the wall push-off before gliding. So the sequence of the path-flow domain was based on these facts. As drag force is dependent on hydrodynamic and
anthropometrical variables23, correlations regarding the trunk transverse surface area (TTSA), CDp and velocity were also
computed.
Figure 1: Theoretical path-flow model
TTSA - trunk transverse surface area; CDp - drag coefficient; V - swimming velocity; SJ - squat jump; Dp - passive drag; GLD - gliding; β xi,yi - beta value for regression model between exogenous (xi) and endogenous (yi) variables; exi - disturbance term for a given endogenous variable; rxi,yi - correlation coefficient between two variables; xi→yi - variable yi depends from variable(s) xi; xi↔yi - variable yi is associated to variable xi.
Underwater gliding distance data collection
The subjects were instructed to perform a maximal push-off from the wall, in a prone streamlined position, at a depth of
approximately 0.5 to 1 [m] in the first lane, with lane ropes separating it from the lateral wall and the second lane. Thereafter they
220 Official Journal of FIMS (International Federation of Sports Medicine) during the trial to measure the distance.
With the help of a vault the maximum distance that the swimmer achieved after the wall push-off parallel to the swimmers’ feet was recorded, tracing a perpendicular projection between the vault and the measuring tape. The test ended when swimmers achieved the water surface and/or were not able to make any further horizontal displacement of their body gliding and/or started any limb action.
Each swimmer performed three trials of underwater gliding distance, with more than two minutes of recovery between them. The best one was considered for further
analysis.
TTSA data collection
For anthropometrical assessment, the subjects were on land, wearing a regular textile swimsuit. The chest perimeter, defined as the perimeter of the trunk at the level of the xiphoid process, was measured with a flexible anthropometrical tape (Metric Tape, RossCraft, Canada) with the subject in the upright and hydrodynamic position. The chest sagittal diameter, which is considered as the distance between the back and the highest point of the chest (i.e. antero-posterior) at the level of the xiphoid process, was measured with a specific sliding caliper (Measuring Clip, RossCraft, Canada). The TTSA was estimated according to the Equations 1 and 2 developed by Morais et al.24 for male and female swimmers, respectively:
(1)
(2)
where TTSA is the trunk transverse surface area in [cm2], CP is the chest perimeter in [cm] and CSD is the chest sagittal diameter in [cm].
Velocity data collection
The kinematical variable assessed was the gliding velocity. A speedo-meter cable (Swim speedo-meter, Swimsportec, Hildesheim, Germany) was attached to the swimmers’ hip and the gliding velocity decay was acquired on-line at a sampling rate of 50 [Hz], during the gliding phase. Data was exported to signal processing software (AcqKnowledge v. 3.5, Biopac Systems, Santa Barbara, USA) and filtered
with a 3 [Hz] cut-off low-pass 4th order Butterworth filter. The integrated system (hardware plus software) was validated with videometric25 and Doppler effect26
techniques.
The gliding mean velocity and the corresponding mean acceleration based upon the acceleration to time were calculated. The acceleration to time curve was obtained by numerical differentiation of the filtered velocity-time curve, using the 5th order centred formula11:
(3)
where airepresents the hip’s instantaneous
acceleration in [m·s-2], vi represents the
hip’s instantaneous velocity in [m·s-1 ] and t represents the time in [s].
Passive drag and passive drag coefficient calculation
Passive drag and coefficient of passive drag were selected as hydrodynamic variables. The Dp was computed through inverse dynamics based upon the velocity to time curve, as suggested by Vilas Boas et al.11. Passive drag force was computed considering:
(4)
where Dp represents the swimmers’ passive
drag in [N], BM the swimmers body mass in [kg], ma the swimmers’ added water mass
in [kg], estimated as being approximately 28% for subject with similar age17 and a the swimmers’ acceleration in [m·s-2].
Coefficient of passive drag (CDp) was calculated as:
(5)
where CDp is the passive drag coefficient
[dimensionless], is the density of the water (assuming to be 1000 kg·m-3), Dpis
the swimmers’ passive drag in [N], v is the swimmers’ velocity in [m·s-1] and S is the frontal surface area of the swimmers in [m2].
221 Official Journal of FIMS (International Federation of Sports Medicine) The SJ test, as a neuromuscular variable,
was also measured. Each subject started from a crouched position, corresponded to an angle of 90º between both thighs and legs and with their hands at waist level, followed immediately by an explosive jump. The protocol required the performance of three jumps on a trigonometric carpet (Ergojump Digitime 1000, Digest, Finland), followed by two minutes of passive rest. It assessed the maximal height reached by each subject. The average of the three jumps was considered for further analysis27.
Statistical analysis
The normality and homocedasticity assumptions were analysed with the Shapiro-Wilk and the Levene tests. In descriptive statistics: (i) mean; (ii) minimum; (iii) maximum and; (iv) one standard
deviation was calculated for all variables. The Spearman's Rank Correlation Coefficient between underwater gliding distance and remaining variables selected
(p ≤ 0.05) was also computed.
The path-flow analysis model was used to perform the estimation of linear regression
standardised coefficients between exogenous and endogenous variables. Standardised regression coefficients (β) were considered, and the significance of each one was assessed with the Student's t
test (p ≤ 0.05).
To measure the quality of the model good-of-fit, it was computed: (i) the ratio Chi-square/degrees of freedom (x2/df). It was considered qualitatively28 if: x2/df > 5 bad
adjustment; 5 ≥ x2
/df > 2 low adjustment; 2
≥ x2
/df > 1 good adjustment; x2/df ~1 very good adjustment.
Results
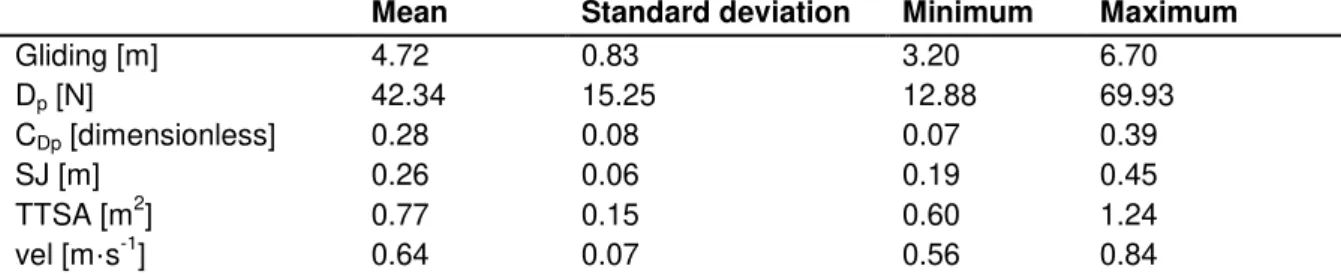
Table 1 presents descriptive statistics for all variables evaluated. These data reveal that the sample was composed of a
heterogeneous group of swimmers. Data dispersion, assessed by the standard deviation values, were moderate-high. This was especially obvious for the Dp that ranged between 12.88 [N] and 69.93 [N], as well as, for TTSA that ranged between 0.60 and 1.24 [m2].
Table 1: Descriptive statistics of underwater gliding distance, hydrodynamics, kinematics, anthropometrics and biomechanics variables
Mean Standard deviation Minimum Maximum
Gliding [m] 4.72 0.83 3.20 6.70
Dp [N] 42.34 15.25 12.88 69.93
CDp [dimensionless] 0.28 0.08 0.07 0.39
SJ [m] 0.26 0.06 0.19 0.45
TTSA [m2] 0.77 0.15 0.60 1.24
vel [m·s-1] 0.64 0.07 0.56 0.84
Table 2 presents the correlations between the underwater gliding distance and remaining variables selected. Gliding distance presented significant correlations with all exogenous variables except for the
Dp. The highest correlation coefficients were verified between the underwater gliding distance and TTSA and the CDp.. Underwater gliding distance had no significant association with the Dp.
Table 2: Correlation coefficients between underwater gliding distance and remaining variables selected
rs P value
Dp [N] 0.41 0.089
CDp [dimensionless] -0.55 0.006
SJ [m] 0.47 0.038
TTSA [m2] 0.60 0.002
vel [m·s-1] 0.48 0.019
Figure 2 presents the confirmatory path-flows for underwater gliding distance. All
222 Official Journal of FIMS (International Federation of Sports Medicine) explained 45% of the underwater gliding
distance. The good-of-fit of the model was x2/df = 3.849 (i.e., low adjustment). Based
on the rule of thumb method adopted, the confirmatory model adjustment was low regarding the theoretical model designed.
Figure 2: Confirmatory path-flow model
TTSA - trunk transverse surface area; CDp - drag coefficient; V - swimming velocity; SJ - squat jump; Dp - passive drag; GLD - gliding; xi→yi - variable yi depends from variable(s) xi; xi↔yi - variable yi is associated to variable xi.
Discussion
The aim of this study was to confirm whether the underwater gliding test is an appropriate technique to estimate the swimmers’ water resistance. The main result was that the confirmatory model explained only 45% of the underwater gliding distance. So, other variables, besides the hydrodynamic and
neuromuscular ones included in the model, might be related to the underwater gliding distance.
Mean data values are within the range of those reported in the literature for swimmers with similar gender,
chronological and biological ages for the selected variables evaluated16,29. The exception was for the drag force variables. To the best of these authors’ knowledge, Tilborgh et al.12 measured the Dp in children based on the velocity decay method (i.e. inverse dynamics) but did not report descriptive statistics on that data. Nevertheless, results of Dp computed by inverse dynamics seems to be more valid, since swimmers adopt a better
hydrodynamic position (i.e. fundamental
hydrodynamic position) without the constrains imposed by handling an apparatus (e.g. arms apart, hands are not fully extended but closed, the back of one hand is not touching the palm of the other) while towed in water11.
The highest correlation coefficients were verified between the underwater gliding distance and TTSA, as well as, the CDp. The underwater gliding distance had no significant association with the Dp.
Underwater gliding is adopted on a regular basis as a technique to estimate Dp13-16 (including the CDp). It is reported that with the increase of glide velocity there is a decrease in the CDp, suggesting an inverse relationship between them9. The
223 Official Journal of FIMS (International Federation of Sports Medicine) variables including velocity, shape, size,
frontal surface area and it is similar to the general pressure drag equation23:
⁄ (6)
Where D is the drag force in [N], ρ is the water density in [kg·m3], v is the velocity in [m·s-1], S is the frontal surface area in [m2] and Cd is the drag coefficient
[dimensionless] (changing according to shape, orientation and Reynolds number).
According to equation 6 a higher velocity represents an increase in drag force, but on the other hand, an increase in velocity is necessary to also increase the underwater gliding. The variable SJ was also correlated with the underwater gliding distance. The plyometric training of the lower limbs (e.g. Squat Jump) in young swimmers improves tasks such as turns after a push-off from the wall21. Thus due to the major role of the turns in swimming performance, plyometric training of the lower limbs might play a major role in order to increase the underwater gliding distance21.
In this particular case, the swimmers’ velocity is related to the impulsion made during the wall push-off. Data reported that the variable responsible for the impulsion (i.e. SJ) and the gliding mean velocity had a very low co-variance (CV = 0.004) and (CV = 0.006), respectively. So it might be stated that there was no discrepancy regarding the swimmers’ gliding velocity (i.e. the Dp values were measured to similar gliding velocities). On the other hand, Dp values had a high dispersion (CV = 258.07). This fact is probably related to the swimmers’ anthropometrics and not to higher gliding velocities.
The confirmatory model included all variables computed and all paths were significant. Velocity, CDp and TTSA explained 81% of Dp and registered moderate correlations between them. Passive drag had a moderate standardised direct effect to the underwater gliding
distance (β = 0.44; p = 0.008). The Squat Jump had also a moderate standardised direct effect to the underwater gliding
distance (β = 0.51; p = 0.002). Coaches
and researchers use this test (i.e. the underwater gliding distance) on a regular
basis to study young swimmers’
hydrodynamic profiles. With Dp being a resistive force, swimmers with lower Dp might be able to achieve a higher
displacement distance. In this sense, it was hypothesised that Dp might be the variable that would contribute with the higher direct effect to the underwater gliding distance. On the other hand, as swimmers started this test with a wall push-off, the variable SJ was also included in the model. The lower limbs’ power (i.e. SJ) had a higher
standardised direct effect on the
underwater gliding distance than Dp, and consequently, a higher predictive value (r2 = 51%). It could be speculated that swimmers achieved a higher distance due to the power they applied during the wall push-off than due to their hydrodynamic profile (i.e. a reduction in the drag forces and as consequence a higher displacement).
The underwater gliding distance depends on the gliding velocity, and this in turn depends on thrust and drag. The same underwater gliding distance might be achieved by decreasing drag forces (i.e. optimising the hydrodynamic position) or by increasing thrust (i.e. more power from the lower limbs during the wall push-off) or by combining both. Data of this confirmatory model shows that lower limbs’ power (i.e. Squat Jump) was more a determinant of the underwater gliding distance increase, in comparison to a better hydrodynamic position (represented by the passive drag). Thus some bias might occur since this test (i.e. the underwater gliding distance) is more dependent on the lower limbs’ strength than from the swimmers hydrodynamic profile.
224 Official Journal of FIMS (International Federation of Sports Medicine) wall push-off and not from the swimmer’s
hydrodynamic characteristics.
Main limitations of the study can be seen as: (i) the model is only suitable for young male and female swimmers; (ii) a more specific procedure to assess lower limb strength, besides Squat Jump, could be used; (iii) further studies should be
conducted in the near future to assess and correct the bias between the underwater gliding test and the passive drag test.
Conclusion
The model only explained 45% of gliding distance, which suggests that other variables beside the hydrodynamic (i.e. passive drag and passive drag coefficient) and neuromuscular (i.e. SJ) could predict the underwater gliding distance. Also, the gliding distance was more dependent on the SJ than the drag force. As a coach-friendly conclusion it can be stated that the underwater gliding test is not representative of the swimmer's passive drag, since some bias might be verified.
Acknowledgments
The authors wish to thanks Welligton Feitosa (University of Ceará) for his useful help during data collection.
Jorge Morais would like to acknowledge the Portuguese Science and Technology Foundation (FCT) for the PhD grant (SFRH/BD/76287/2011).
Address for correspondence:
Mr Jorge E Morais, Department of Sport Sciences, Polytechnic Institute of Bragança, Campus Sta. Apolónia, Apartado 1101, 5301-856 Bragança, Portugal
Tel.: +351 273 303 000; Fax: +351 273 303 135
Email: [email protected]
References
1. Barbosa TM, Costa MJ, Marques MC, et al. A model for active drag force exogenous variables in young swimmers. J Hum Sport Exerc 2010; 5(3): 379-388.
2. Kolmogorov S, Rumyantseva O, Gordon B, et al. Hydrodynamic characteristics of competitive swimmers of different genders and
performance levels. J Appl Biomech 1997; 13: 88-97. 3. Kolmogorov S, Duplishcheva O.
Active drag, useful mechanical power output and hydrodynamic force in different swimming strokes at maximal velocity. J Biomech 1992; 25: 311-318.
4. Hollander P, de Groot G, van Ingen Schenau G, et al. Measurement of active drag during crawl stroke swimming. J Sports Sci 1986; 4: 21-30.
5. di Prampero P, Pendergast D, Wilson D, et al. Energetics of swimming in man. J Appl Physiol 1974; 37: 1-5.
6. Pendergast DR, Capelli C, Craig AB, et al. In: Vilas-Boas JP, Alves F, Marques A (Eds). Biophysics in swimming. Biomechanics and Medicine in Swimming X. Portuguese Journal of Sport Science 6, 2006, pp.185-189. 7. Zamparo P, Gatta G, Capelli C, et
al. Active and passive drag, the role of trunk incline. Eur Appl Physiol 2009; 106: 195-205.
8. Chatard JC, Wilson B. Drafting in swimming. Med Sci Sports Exerc 2003; 35(7): 1176-1181.
9. Marinho DA, Reis VM, Alves FB, et al. The hydrodynamic drag during gliding in swimming. J Appl Biomech 2009; 25(3): 253-257. 10. Marinho DA, Ribeiro J,
Manthripragada N, et al. The effect of depth on drag during the gliding phase in swimming. Med Sci Sports Exerc 2010a; 42(5): 36.
11. Vilas-Boas JP, Costa L, Fernandes RJ, et al. Determination of the drag coefficient during the first and second gliding positions of the breaststroke underwater stroke. J Appl Biomech 2010; 26: 324-331. 12. Tilborgh L, Daly D, Persyn U The
influence of some somatic factors on passive drag, gravity and buoyancy forces in competitive swimmers. . In: Hollander AP, Huijing PA, de Groot G (Eds). Biomechanics and Medicine in Swimming. Champaign: Human Kinetics, 1983, pp. 204-217. 13. Silva AJ, Costa AM, Oliveira PM, et
225 Official Journal of FIMS (International Federation of Sports Medicine) performance. J Sports Sci Med
2007; 6: 117-125.
14. Cazorla G. Specific test to the swimmer evaluation. Cestas, Association pour la recherche et l'evaluation en activité physique et en sport. Paris: Editions Vigot, 1993.
15. Rama L, Alves F. Determinant factors of the youth Portuguese swimmers. 27th Scientific Congress of the Portuguese Swimming Coaches Association. Lisbon: Book of Abstracts. 2004, pp. 24-26. 16. Rama L, Santos J, Gomes P, et al.
Determinant factors related to performance in young swimmers. In: Vilas-Boas JP, Alves F, Marques A (Eds). Biomechanics and Medicine in Swimming X. Portuguese Journal of Sport Science 6, 2006, pp. 246-249. 17. Caspersen C, Berthelsen PA, Eik
M, et al. Added mass in human swimmers: age and gender differences. J Biomech 2010; 43: 2369-2373.
18. Naemi R, Easson WJ, Sanders RH. Hydrodynamic glide efficiency in swimming. J Sci Med Sport 2010; 13(4): 444-451.
19. Barbosa TM, Costa MJ, Morais JE, et al. How informative are the vertical buoyancy and the prone gliding tests to assess young
swimmers’ hydrostatic and
hydrodynamic profiles? J Hum Kinet 2012; 32: 21-32.
20. Zaidi H, Taiar R, Fohano S, et al.
Analysis of the effect of swimmer’s
head position on swimming performance using computational fluid dynamics. J Biomech 2008; 41: 1350-1358.
21. Potdevin FJ, Alberty ME,
Chevutschi A, et al. Effects of a 6-week plyometric training program on performances in pubescent swimmers. J Strength Cond Res 2011; 25(1): 80-86.
22. Schreiber JB, Nora A, Stage FK, et al. Reporting structural equation modeling and confirmatory factor
analysis results: A review. J Educ Res 2006; 99(6): 323-337. 23. Kjendlie PL, Stallman RK. Drag
characteristics of competitive swimming children and adults. J Appl Biomech 2008; 24(1): 35-42. 24. Morais JE, Costa MJ, Mejias EJ, et
al. Morphometric study for estimation and validation of trunk transverse surface area to assess human drag force on water. J Hum Kinet 2011; 28: 5-13.
25. Barbosa TM, Costa MJ, Morais JE, et al.. Validation with videometry of an integrated system to assess horizontal intra-cyclic velocity with a mechanical speedo-meter. In: Vilas-Boas JP, Machado L, Wangdo W, Veloso AP (Eds). Biomechanics in Sports 29. Portuguese Journal of Sport Sciences, 11 (suppl 2), 2011, pp. 833-835.
26. Barbosa TM, Costa MJ, Morais JE, et al. Conception, development and validation of a software interface to
assess human’s horizontal intra -cyclic velocity with a mechanical speedo-meter. In: Siny Jan S, Feipel V, Aerenhout D, et al. (Eds). Proceedings of the XXIIIrd
Congress of the International Society of Biomechanics. Bruxels: Université Libre de Bruxelles & Université D´Europe, 2011. 27. Garrido N, Marinho DA, Barbosa
TM, et al. Relationships between dry land strength, power variables and short sprint performance in young competitive swimmers. J Hum Sport Exerc 2010; 5(2): 240-249.
28. Wheaton B. Assessment of fit in over-identified models with latent variables. Sociol Methods Res 1987; 16: 118-154.
29. Papadopoulos C, Sambanis M, Gissis I, et al. Evaluation of force and vertical jump performance in young swimmers with different force-time curve characteristics. Biol Sport 2009; 26(4): 301-307