“NOTICE: this is the author’s version of a work that was accepted for publication in the Book Perspectives in Fundamental and Applied Rheology. Changes resulting from the publishing process, such as peer review, editing, corrections, structural formatting, and other quality control mechanisms may not be reflected in this document. A definitive version is available in the Book Perspectives in Fundamental and Applied Rheology, Rubio-Hernández, F. J., et al. (Eds), Gráficas Fernando, 285-290, 2013.
Perspectives in Fundamental and Applied Rheology Part VI: Rheometry and Experimental Methods CHAPTER 2
Blood flow in microchannels manufactured by a low
cost technique: xurography
Elmano Pinto 1,2, Bruna Taboada 1,2, Vera Faustino 1,2, Diana Cidre 1, Raquel Rodrigues 1,
João Miranda 2, Valdemar Garcia 1, Ricardo Dias 1,2, Rui Lima 1,2. 1 Mechanical Technology, ESTiG, Polytechnic Institute of Bragança (IPB), Portugal. 2 Department of Chemistry, CEFT, Faculdade de Engenharia da Universidade do Porto
(FEUP), Portugal.
Introduction
The xurography is a technique that has been used to make molds to produce
microchannels. In contrast to soft lithography [1, 2], xurography uses equipments
and materials commonly used in the printing industry, such as cutting plotters,
vinyl and other materials. The main advantage of this technique is to fabricate
microchannels at a reduced cost [3, 4].
The Fahraeus-Lindqvist effect is a well know phenomenon that happens in
microcirculation, where red blood cells (RBCs) have tendency to migrate toward
the centre of the microtube resulting in a marginal cell-free layer (CFL) at regions
formation of the CFL is affected by the geometry of the microchannel [1, 6, 7] and
the physiological conditions of the working fluid, such as the hematocrit (Hct) [2,
8].
The main objective of the present work is to fabricate polydimethysiloxane (PDMS)
microchannels by using a soft xurography technique in order perform blood flow
studies. Additionally, a high-speed video microscopy system is used to measure
the CFL thickness in two different geometries, i. e., bifurcations and confluences.
Experimental
Microchannels were initially developed with a CAD software, the geometries were
selected taking into account a previous study about the blood flowing through
microchannels with bifurcations and confluences fabricated by a soft lithography
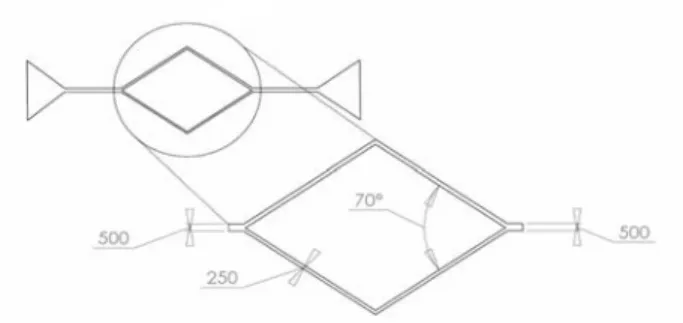
technique [9]. The parent microchannel has 500 µ m in width and the two branches
of the bifurcation and confluence corresponds to 50% of the width of parent
channel [3]. Figure 1 shows the geometry and dimensions used in this study.
Figure 1. Schematic diagram of the geometry with the main channel of 500 μm and 250
This geometry was used to fabricate the molds by using a cutting plotter Jaguar II
and vinyl HEXIS. The mold was used for the production of PDMS microchannels.
The PDMS was obtained by mixing curing agent (10:1 ratio) with PDMS deposited
in the mold. The glass side was prepared with PDMS (20:1 ratio) and dispersed by
means of a spin coater. The PDMS was cured in an oven at 80 °C for 20 minutes.
Then by using a blade the microchannels were cutted off and the inlet/outlet holes
of the fluid were done by using a fluid dispensing tip. Finally, to have a strong
adhesion of the materials, the device was placed in the oven at 80 °C for 24
hours.
The fabricated microchannels were used to study blood flow with a hematocrit
(Hct) of 5% and different flow rates. The suspending fluid was a dextran 40
solution and the flow rates tested were 5 and 15 ml/min.
The blood samples were taken from a healthy ovine and were washed twice with
physiological saline using a centrifuge at a speed of 2000 rpm for 15 min at 4
°C. After washing, a separate test tube with 25 µ l of RBCs was added to dextran
40 until fill a 5 ml sample.
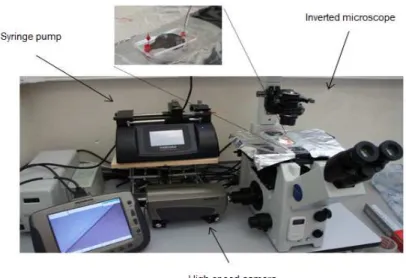
We used a syringe pump (Harvard Apparatus PHD ULTRATM) to control the flow of
the fluids. To visualize and measure the flow we have used an inverted
microscope (IX71, Olympus) combined with a high speed camera (i-SPEED
LT). Figure 2 shows the experimental apparatus used to control the flow and to
Figure 2. Experimental apparatus to control and visualize the flow in microchannels
produced by xurography.
A manual tracking plugin (MTrackJ), of the image analysis software Image J, was
used to track individual RBC flowing around the boundary of the RBCs core. By
using MTrackJ plugin, the centroid of the selected RBC was automatically
computed [6]. After obtaining x and y coordinates, the data were exported for the
determination of each individual RBC trajectory and consequently the CFL
Results and Discussion
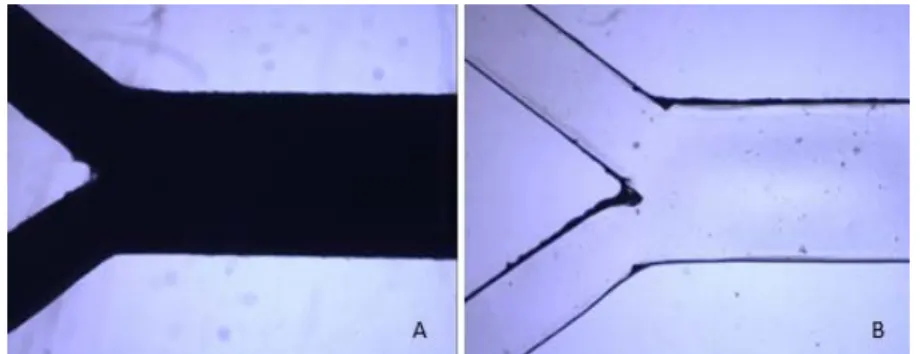
Figure 3 shows the vinyl mold master and the correspondent PDMS microchannel.
Figure 3. Images obtained using an inverted microscope with a 4x objective lens: A - The vinyl mold master fabricated by a cutting plotter; B – PDMS microchannel of the
confluence.
Overall, by using our cutting plotter it was possible to obtain good enough quality
master molds and correspondent PDMS microchannels to study blood flow
phenomena at microscale level. However, detailed analysis of the geometries has
shown that the quality of the microchannel tend to decreases as it size decreases.
This is mainly related to the limitation of our cutting plotter to cut precisely
geometries with dimensions smaller than 500 µ m [3].
To evaluate the geometrical quality of the mold masters and correspondent
microchannels several microscopic images were obtained along the device. Figure
4 shows a schematic representation of the sections where the microscopic images
Figure 4. Schematic representation of the microchannel geometry and location of the sections where the images were collected to evaluate the geometrical quality.
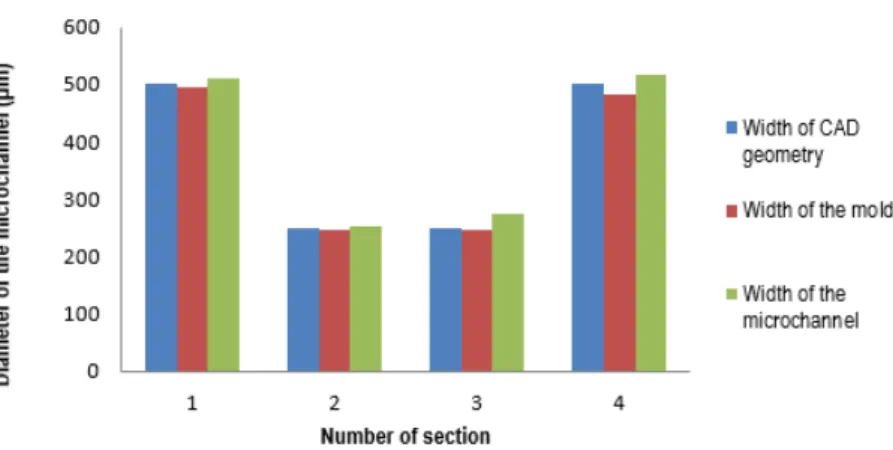
Figure 5 shows the width measurements of both mold masters and PDMS replica
with microchannels.
Figure 5. Comparison between the theoretical values obtained from AutoCAD, vinyl
The mold masters and the microchannels have dimensions close to the theoretical
values. Detailed microscopic visualizations have shown that the decrease in the
size of the geometry resulted in an increase in the percentage error in the
manufacturing process of the master molds.
Throughout the experimental tests performed with different flow rates we found
that in the zone around the branching the CFL thickness was independent of the
flow rate. Therefore, we have decided to analyse the variation of the CFL
preferably in the area before bifurcation and immediately after the confluence
(Figures 6 and 7 respectively).
Figure 6. Blood flowing around the bifurcation with 5% Hct and a flow rate of 10 μl/min.
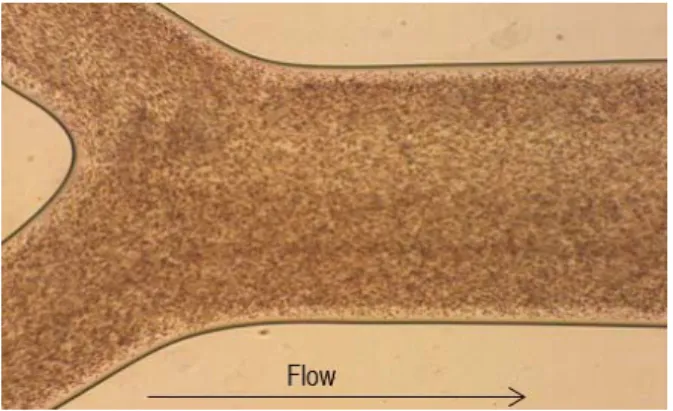
In the zone after the confluence, the CFL thickness is slightly bigger when
compared with the other sections of the microchannel. In Figure 7 is possible to
observe the CFL thickness through the full length of the microchannel. Our
preliminary results indicate a slight increase of the CFL downstream the
confluence.
The quality of the images and the analysis methodology may have caused the
observed variations. Detailed studies are currently under way and will be published
in due time.
Our results corroborate the work of Leble et al [9],that found a formation of a CFL
in the region of the confluence apex. This phenomenon was observed in a
microchannel three times smaller than the one used in the current study as they
used a soft lithography technique to fabricate the microchannels. However, at
higher dimensions the current work has shown evidence of a CFL around the apex
of the confluence. Hence, by using xurography it is also possible to study several
blood flow phenomena happening in microcirculation.
Acknowledgments
The authors acknowledge the financial support provided by: PTDC/SAU-BEB/108728/2008, PTDC/SAU-BEB/105650/2008, PTDC/EME-MFE/099109/2008 and PTDC/SAU-ENB/116929/2010 from FCT (Science and Technology Foundation), COMPETE, QREN and European Union (FEDER).
References
1. Lima, R., Wada, S.,Tanaka S., Takeda M., et al. Biomedical Microdevices, vol.10(2), pp.153-167, 2008.
2. Garcia V., Dias R., Lima R.. InTech vol.17, pp. 394-416, 2012.
4. Gojo, R., Morimoto, Y., Takeuchi, S. International Conference on Miniaturized Systems for Chemistry and Life Sciences. October, 2008, San Diego, California, USA.
5. Caro, C., Pedley, T., Schroter R., Seed, W.. The mechanics of the circulation,
Cambridge University Press, 1978.
6. Pinho, D.. Master Thesis in Biomedical Technology, Polytechnic Institute of Bragança, Portugal, 2011.
7. Lima, R., Ishikawa, T., Imai, Y., et al. Journal of Biomechanics 41, pp. 2188-2197, 2008.
8. Fujiwara, H., Ishikawa, T., Lima, R., et al. Journal of Biomechanics 42, pp. 838-843, 2009.