MODELLING HOT SPOTS OF SOIL LOSS BY WIND EROSION (SoLoWind) IN
WESTERN SAXONY, GERMANY
Simon Schmidt1*, Katrin Meusburger1, Tomás de Figueiredo2, Christine Alewell1 1
Environmental Geosciences, University Basel, Basel 4056, Switzerland
2
CIMO–Mountain Research Centre, Instituto Politécnico de Bragança (IPB), Bragança 5301-855, Portugal
Received 12 May 2016; Revised 21 September 2016; Accepted 15 October 2016
ABSTRACT
While it needs yet to be assessed whether or not wind erosion in Western Saxony is a major point of concern regarding land degradation and fertility, it has already been recognized that considerable off-site effects of wind erosion in the adjacent regions of Saxony-Anhalt and Bran-denburg are connected to the spread of herbicides, pesticides and dust. So far, no wind erosion assessment for Western Saxony, Germany, exists. The wind erosion model previously applied for Germany (DIN standard 19706) is considering neither changes in wind direction over time nor influences offield size. This study aims to provide afirst assessment of wind erosion for Western Saxony by extending the existing DIN model to a multidirectional model on soil loss by wind (SoLoWind) with new controlling factors (changing wind directions, soil cover, meanfield length and mean protection zone) combined by fuzzy logic. SoLoWind is used for a local off-site effect evaluation in combination with high-resolution wind speed and wind direction data at a section of the highway A72. The model attributes 3·6% of the arablefields in Western Saxony to the very-high-wind erosion risk class. A relationship between largerfields (greater than 116 ha) and higher proportions (51·7%) of very-high-wind erosion risk can be observed. Sections of the highway A72 might be under high risk according to the modelled off-site effects of wind erosion. The presented applications showed the potential of SoLoWind to support and consult management for pro-tection measures on a regional scale. © 2016 The Authors. Land Degradation and Development published by John Wiley & Sons, Ltd.
key words: multidirectional;field length; windbreaks; off-site effects; ILSWE
INTRODUCTION
Land degradation results in a reduction of the productive ca-pacity of land (van Lyndenet al.,2004). Processes that are in the focus of discussion to cause land degradation are soil erosion by water, loss of organic matter, deforestation or changes in climate (Lee et al.,1996; Montanarella, 2007; Cerdàet al.,2010; Pérez-Cabelloet al.,2010; Bruunet al., 2015; Kairiset al.,2015; Prosdocimiet al.,2016). However, there are other threats that can trigger land degradation that are much less known and result in the desertification of the landscapes (Munson et al., 2011; Xu and Zhang, 2014; Vieira et al., 2015; Xie et al.,2015). Among those, wind erosion is one of the less studied processes (Dregne and Chou, 1992; Sterket al.,1999; Brotonset al.,2010; Holmes et al.,2012; Wang, 2014; Wanget al.,2015; Borrelliet al., 2016a). Recent evaluations on the European scale have shown that wind erosion cannot merely be neglected when discussing soil degradation status and soil fertility (Borrelli et al.,2016a, 2016b).
Globally, 27% of the total land area (548 million ha) is potentially affected by wind erosion (Lal, 2001). In Europe, approximately 12% of the agricultural land is susceptible to soil erosion by wind (Borrelli et al.,2015). The average annual soil loss by wind erosion on the European Union’s arable land is predicted to be
0·53 Mg ha 1y 1 and for Germany’s arable land to be 0·26 Mg ha 1y 1(Borrelliet al.,2016a). The focus of wind erosion studies in Germany is located in the Northern and Eastern parts of the country, where wind erosion is a major soil threat and environmental concern (BGR Bundesanstalt für Geowissenschaften und Rohstoffe, 2016). Approximately 30% of Northern and Eastern Germany’s farmland is prone to wind erosion owing to its soil textural characteristics (Funk et al.,2004). Wind erosion can cause an often non-visible loss offine soil up to 40 Mg ha 1per single event as was shown forfields in Kansas, USA (Chepil, 1960). Similar magnitudes were also observed in Brandenburg, Germany, where an average loss of 15-mm topsoil within a 4-year measuring period by wind erosion was recorded (Funk, 2004). Assum-ing a bulk density of 1 Mg m 3, the latter corresponds to a soil loss of 37·5 Mg ha 1y 1, which would clearly exceed the soil loss by water in this area estimated by Panagoset al.(2015). Even though both studies cannot directly be compared, this rough estimation of wind erosion magnitude gives a general idea on the possible detrimental impact of wind erosion.
One of the most susceptible regions not only within Germany but even within Europe is Western Saxony (Borrelli et al., 2014, 2015). However, unlike for the adjacent states Saxony-Anhalt and Brandenburg where wind erosion was reported to be a considerable degradation risk (Funk, 2004; Helbig, 2015), no local or regional wind ero-sion assessment has been attempted for Western Saxony yet. In addition to the on-site effects resulting in the degrada-tion of landscapes, and the off-site effects such as spread of *Correspondence to: S. Schmidt, Environmental Geosciences, University
Basel, Bernoullistrasse 30, Basel 4056, Switzerland. E-mail: [email protected]
pesticides, herbicides and dust (Glotfelty et al., 1989; Riksen and de Graaff, 2001), wind erosion may also be a danger for human life. For instance, a wind erosion event at the highway A19 close to Rostock, Mecklenburg-West Pomerania, Germany, provoked visual obstruction in April 2011 and resulted in major collisions with 131 persons in-jured and eight casualties (Manhart et al., 2012; Deetz et al.,2016). Several other wind erosion events occurred in Northern and Eastern Germany with severe impacts on road traffic that were reported in newspapers (e.g. Aschersleben, Saxony-Anhalt –Geipel, 2011; Staßfurt, Saxony-Anhalt –
Dörries, 2011; Neuruppin, Brandenburg – DPA, 2014; Neuruppin, Brandenburg – Klehn, 2014; Welsleben, Saxony-Anhalt – Helbig, 2015; Bensdorf, Brandenburg –
Führer, 2016). Prevention of future on- and off-site effects of wind erosion depends on the identification of (i) wind erosion hot spots and (ii) spatial patterns of on- and off-site wind erosion effects.
To date, no reports on severe wind erosion events are available for Western Saxony; however, potential wind ero-sion risk is expected to be high because the natural condi-tions (topsoil texture, wind speeds, main wind direction and geographical location) and agricultural management practices (large and plain fields, and sparseness in wind-breaks) are similar to those of the adjacent and regularly af-fected federal states of Saxony-Anhalt and Brandenburg. Furthermore, the sparseness in windbreaks coincides with strong and dry winds and low soil cover in the erosive season, which is in March and April (Toyet al.,2002; Funk et al., 2004; Hassenpflug, 2004). Even though the land degradation by wind erosion in consequence of the 1960s land reforms and land use change in the area of the former German Democratic Republic (Arndt, 2004; Baude and Meyer, 2006; Fritsche and Ertel, 2012) was immediately recognizable, monitoring or even mere observing of wind erosion had low priority for decades (Knauss, 2005).
The later spatial assessment of wind erosion risk for parts of Northern and Eastern Germany still follows the rather simplified norm DIN19706, although more sophisticated wind erosion models are available. In 1930s, the dust-bowl event in the USA (Tatarkoet al.,2013) triggered the devel-opment of empirical wind erosion models like the wind erosion equation (WEQ) (Chepil and Woodruff, 1963; Woodruff and Siddoway, 1965), the revised WEQ (RWEQ) (Fryrearet al.,1998; Fryrear et al.,2000), its GIS version (GIS-RWEQ) (Borrelliet al., 2016a) and the erosion pro-ductivity impact calculator (Williams et al., 1983). WEQ and RWEQ are widely used and extensively tested and have the ability to be scaled up from field to regional scale (Zobeck et al., 2000; Youssef et al., 2012; Guo et al., 2013), but they are limited in their ability to account for multidirectionality of wind and variations in precipitation (Cole, 1983; Tatarko et al., 2013). Subsequently, the recently developed Index of Land Susceptibility to Wind Erosion (ILSWE) (Borrelli et al., 2014, 2015, 2016b) is a large-scale model that was applied at European scale. ILSWE serves as a conceptual model to define and
parameterize factors of wind erosion and‘assesses the con-ditions and the frequency under which an area may become susceptible to wind erosion’ (Borrelli et al., 2016b). Process-oriented and more complex models like the wind erosion prediction system (WEPS) (Hagen, 1991; Wagner, 2013), wind erosion assessment model (WEAM) (Lu and Shao, 2001) or the Texas erosion analysis model (TEAM) (Gregoryet al.,1999) started to be developed in the 1990s. These models were usually not developed for European soils. Later, Wind Erosion on European Light Soils (WEELS) (Böhneret al.,2003) was thefirst process-oriented assessment for European soils. Disadvantageously, all these models have an extremely large demand for high-resolution data, which limits their transferability and application in other than the tested and calibrated regions. Zouet al.(2015) gives a more in-depth review of wind erosion models.
A rather basic but commonly applied modelling approach (DIN19706) exists for wind erosion assessments in Germany (Blume, 2004) and the federal states Lower Sax-ony (Schäfer, 2015), Schleswig-Holstein (LLUR Landesamt für Landwirtschaft, Umwelt und ländliche Räume des Landes Schleswig-Holstein, 2011), Mecklenburg-West Pomerania (Frielinghaus et al., 2002), Saxony-Anhalt (Deumelandt et al.,2014) and Brandenburg (ZALF, ). So far local, regional and national wind erosion modelling of German areas has been only published in so-called gray literature. For Saxony, such a regional wind erosion risk as-sessment has not been performed yet and asas-sessments can only be derived from continental (Borrelli et al., 2014, 2015, 2016a), national (Bug, 2014) or low-resolution regional (LfUG Sächsisches Landesamt für Umwelt und Geologie, 2007; Regionaler Planungsverband Westsachsen, 2007) models.
to locally identify those fields and objects, which are under risk to wind erosion to apply further prevention actions.
The objective of this study is to introduce the concepts of SoLoWind by (i) qualitatively assessing and mapping the spatial distribution of single arablefields under risk of wind erosion and (ii) combining SoLoWind with high-resolution local wind speed and direction data (derived from a separate orography model) to identify hot spots of wind erosion off-site effects in a sub-study area. We chose Western Saxony as our case study region, because of the expected high wind erosion susceptibility as discussed earlier.
MATERIAL AND METHODS
Study Area
The study area is located in the western part of Saxony, Germany, which has an extent of approximately 441,000 ha. It is characterized by a sequence of glacial low-lands, loess plains and loess hill country increasing in alti-tude from North to South (80 to 260 m asl) with sandy and silty topsoil. The landscape types for the study area modified according to Bernhardt et al. (1986) and Niemann & Stephan (1982) are presented in Figure 1. The climate is sub-continental. The average (1961 to 2010) annual rainfall, derived from a 1-km resolution map provided by the German Weather Service (DWD), for Western Saxony is 604 mm. The lowest average precipitation of 518 mm in conjunction with winter droughts due to the shielding effect of the Harz Mountains is located close to the border of Saxony-Anhalt (Airport Leipzig-Halle). Extratropical westerly winds are dominant with the prevailing wind direction of 240° South-West (Regionaler Planungsverband
Westsachsen, 2007). Long-term average wind speeds in Western Saxony range between 1·6 and 4·1 m s 1(derived from long-term annual wind speeds measured by DWD; 200-m resolution, 1981–2000), influenced by an altitudinal gradient of 0·3 m s 1per 100-m height (Flemming, 1994). Long-term average wind speeds are lowest in the urban area of Leipzig and highest in the north-western region of the study area and on the summits of the loess hill country (Figure 1) (Regionaler Planungsverband Westsachsen, 2007). Measurements at nine meteorological stations in the study area (operated by DWD and the Saxon State Office Agency for the Environment, Agriculture and Geology) with hourly measured wind speeds and wind directions (at 10 m height) showed that the erosive season with gust speeds greater 5·4 m s 1 are predominantly from November to April. About 54% (239,590 ha) of the study area are agricul-turalfields [based on thefield cadaster of the Integrated Ad-ministration and Control System (InVeKoS)]. The average size of arablefields has an extent of 26·5 ha with an obvious scarcity of windbreaks. Agricultural use is predominant in the fertile sandy-loess plain and loess hill country (Regionaler Planungsverband Westsachsen, 2007).
Soil Loss by Wind Erosion Model
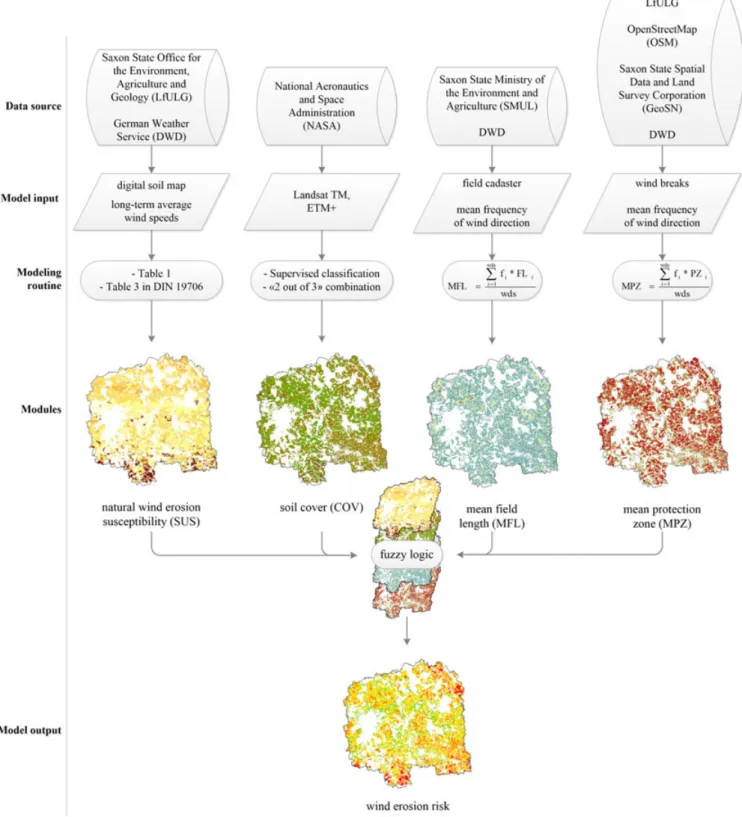
Soil loss by wind incorporates major causal wind erosion factors (topsoil texture, organic content, soil moisture, wind speeds and wind directions, soil cover,field length and wind breaks) in the four modules natural wind erosion susceptibil-ity (SUS), soil cover (COV), mean field length (MFL) and mean protection zones (MPZ) (Figure 2). All modules are calculated and evaluated separately and subsequently combined with fuzzy logic.
Figure 1. Landscape types in Western Saxony and urban centres modified according to Bernhardtet al.(1986) and Niemann & Stephan (1982). [Colourfigure
The first module, the natural wind erosion susceptibility module SUS, determines the regional soil erodibility accord-ing to Table I by the parameters soil texture, soil organic content and Ellenberg’s soil moisture (F-value) of the top-soil layer. The derivation of top-soil erodibility classes (0–5; boldface in Table I) is based on an empirical relation implied
in BGR Bundesanstalt für Geowissenschaften und Rohstoffe & Geologische Landesämter (1982). This approach includes an approximation factor for the site-specific soil moisture (F-value). In a second step within the module SUS, soil erodibility is combined with wind speeds according to Table III of DIN19706 (version 2013:02). In our example
Figure 2. Datasets and framework of soil loss by wind (SoLoWind) and its modules natural wind erosion susceptibility (SUS), soil cover (COV), meanfield
application, soil parameters andF-value were derived from the digital soil map of Saxony (1:50,000). For Western Saxony, long-term (1981 to 2000) average wind speeds in meter per second (in 10-m height, 200-m spatial resolution) were provided by DWD.
Further, a soil cover module COV that distinguishes between bare soil and covered soil in satellite images (according to the spectral information) is implemented in SoLoWind. The method assigned a specific class (bare, covered) to each image cell if 2 out of 3 years have similar spectral characteristics. This multi-year approach was cho-sen to account for inter-annual crop rotation. In the study area, the season from December to March showed the highest frequencies in erosive winds according to the evalu-ated wind speeds at nine different stations. Consequently, soil cover in March was chosen as the reference month ow-ing to its high frequency in erosive winds and at the same time a phase of the year with high agricultural practice and low vegetation cover (seeding) (Toy et al., 2002; Funk et al., 2004; Hassenpflug, 2004). For a 3-year sequence (2010 to 2012) in March, various regions of interest (ROIs) were set: for 2010, 126; for 2011, a total of 143 ROIs; and for 2012, 173 ROIs. Digital orthophotos of the year 2012 (0·2-m spatial resolution) were used as ground truthing with 42 ROIs. For the soil cover mapping, a supervised minimum distance classification of Landsat satellite images (Landsat TM and ETM+, spatial resolution of 30 m) was used. A more detailed identification of the degree of coverage was not applicable with Landsat data in the respective research
period because of missing ground truth data and the low spatial resolution.
Thefield lengths in module MFL are an indicator of inten-sity and transport capacity of wind forces on the topsoil (Hassenpflug, 2004; LLUR Landesamt für Landwirtschaft, Umwelt und ländliche Räume des Landes Schleswig-Holstein, 2011) and serve as an approximation for the wind erosion’s avalanching effect (Chepil and Woodruff, 1963).
The avalanching effect is most pronounced if the maximum length of the field coincides with the main wind direction. Thefield length of module MFL is calculated by a cumula-tive cell count approach using a conventional GIS flow accumulation algorithm (Figure 3). The cadastral map of allfields is rasterized to a constant raster and rotated to the desired wind direction (e.g. as in Figure 3 with a west–east
orientation) because the flow accumulation approach only counts cells from left to right and cannotflow in any other direction than 90°. Flow accumulation has its initial counting cell at a leftfield border and cumulates the number of cells straightforward to the right until the opposite border is reached. It starts again to count by overpassing the next field border. The cumulative cell count is multiplied by the cell size to yieldfield length (meter) for each cell within a field. The resultingfield length raster is rotated back to its initial position. All the steps are repeated for the 12 wind di-rection sectors (0° to 360°). For each sector, the individual long-term frequency of erosive winds (gust speeds above 5·4 m s 1and preceding 48 h rainless) need to be calculated. These frequencies (fi) in each wind direction sector (wds)
Table I. Soil erodibility classes (0–5; in boldface) by wind according to soil texture, organic content and Ellenberg’sF-value after BGR Bundesanstalt für Geowissenschaften und Rohstoffe & Geologische Landesämter (1982)
German textural classes
Description Soil texture Organic content in %
Mean Ellenberg F-value
Particle size inμm
Composition 7-8 6 5 4 3-2
T Clay <0.2 65-100% C, 0-35% Si, 0-35% S / 0 0 1 1 1
U Silt 2-63 0-8% C, 80-100% Si, 0-20% S
L Loam / 8-45% C, 0-50% Si, 15-83% S
Sl3 Medium loamy sand 63-2000 8-12% C, 7-40% Si, 48-85% S >4 0 1 2 3 3
Sl4 Very loamy sand 63-2000 12-17% C, 13-40% Si, 45-75% S
<4 0 2 2 3 3
Sl2 Low loamy sand 63-2000 5-8% C, 5-25% Si, 67-90% S Su2 Low silty sand 2-63 0-5% C, 10-25% Si, 70-90% S
Su3 Medium silty sand 2-63 0-8% C, 25-40% Si, 52-75% S >4 0 2 3 4 5
Su4 Very silty sand 2-63 0-8% C, 40-50% Si, 42-60% S <4 0 3 4 4 5
ffS Veryfine sand 63-125 <5% C,<10% Si,>85% FS
gS Coarse sand 630-2000 <5% C,<10% Si,<20% FS, <30% MS,>40% CS
mS Medium sand 200-630 <5% C,<10% Si,<20% FS, >70% MS,<15% CS
msfS Medium sandyfine sand
63-200 <5% C,<10% Si, 50-75% FS,
15-50% MS,<5% CS
>4 0 3 4 5 5
fsmS Fine sandy medium sand
200-630 <5% C,<10% Si, 20-50% FS.
40-70% MS,<10% CS
<4 0 4 5 5 5
fS Fine sand 63-200 <5% C, 10% Si,>75% FS, <15% MS, few grains CS
C = clay, Si = silt, S = sand, FS =fine sand, MS = medium sand, CS = coarse sand, 0 = no soil erodibility, 1 = very low soil erodibility, 2 = low soil erodibility,
serve as a weight factor for each (here: 12 according to 12 wind direction sections)field length raster (FLi) in order to calculate a MFL raster according to the following equation:
M FL¼∑
wds i¼1fiFLi
wds (1)
For the presented two applications of the model, erosive events were derived from a total of nine gauging stations for the application to Western Saxony and Geithain for the
sub-catchment application. The cadastral map was extracted from InVeKoS.
Finally, SoLoWind enables the user to evaluate the effec-tiveness of windbreaks, which are treated within a separate protection zone module MPZ. For the module calculation, all windbreaks like tree rows, hedges, groves, forests, build-ings, bridges and field boundaries can be considered. The windward and leeward protection zones (Blume, 2004) are obtained by a GIS hillshade function using a specific altitude
Figure 3. Concept of the meanfield length module (MFL) by rotation,flow accumulation and averaging. [Colourfigure can be viewed at wileyonlinelibrary.
and azimuth for each wind sector. In this particular case, the illumination source of the hillshade tool can be understood as wind source. Therefore, windbreaks with defined heights have their specific wind shadow zone according to the alti-tude of the wind source. Azimuth can be understood as wind direction. The process is repeated for each wind direction sector (azimuth). Likewise in module MFL, the frequency (fi) of erosive events of each wind direction sector (wds) serves as a weight factor for averaging the protection zones (PZi) to MPZ with Equation 2:
M PZ¼∑
wds i¼1fiPZi
wds (2)
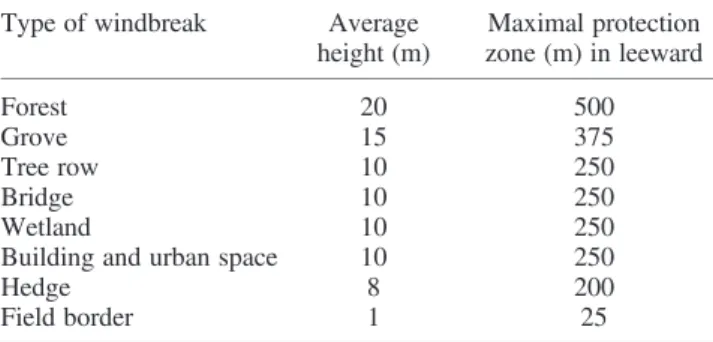
Here, we extracted the mentioned objects with its specific mean heights (Table II) from the biotope and land use map-ping, the Official Topographic-Cartographic Information System, InVeKoS, OpenStreetMap and orthophotos.
The modules are combined by fuzzy logic, which wasfirst introduced by Zadeh (1965; for detailed explanations, see also Klir and Folger, 1988; Zadeh and Kacprzyk, 1992; Kosko, 1993; Masulliet al.,2013). The technique deals with uncertainties and vagueness of complex systems (Rihani et al.,2009), which is often the case in wind erosion model-ling (Böhner et al., 2003; Gomes et al., 2003; Goossens, 2003; Funk and Reuter, 2006; Borrelli et al., 2016a, 2016b). The variables are transformed to fuzzy members, and the classes are converted into numerical values ranging from 0 (no membership) to 1 (full membership). Different underlying probability functions (e.g. linear, gaussian, trian-gular, trapezoid, exponential, logarithmic and polynomial) can be chosen instead of an additive linkage with high un-certainties (McBratney and Odeh, 1997; Mezősi et al.,
2015). We assumed a linear relationship for the qualitative classes of module SUS (in accordance with Climate Erosiv-ity WFmand Soil Erodibility EF in Borrelliet al.,2016b). Although Mezősiet al. (2015) and Borrelli et al.(2016b)
use a reciprocal and half-hyperbolic relationship of soil cover, a linear function was assumed for COV because it was classified as Boolean without intermediate values.
According to NLÖ Niedersächsisches Landesamt für Ökologie (2003), classes of tolerablefield lengths (module MFL) were also linear classified. It was assumed that the protection zone of any landscape component loses its effect with a linear trend (Combeau, 1977; Blume, 2004). All four modules as fuzzy members were combined with a fuzzy overlay by equal weights of one-quarter.
Model Application
Wind erosion risk classes and plausibility check for Western Saxony
The modelled wind erosion risk map was classified intofive equal interval risk categories. Fields with values in thefirst interval (0% to 20%) were classified as very low and second interval (greater 20% to 40%) as low risk to wind erosion; fields with values in the fourth interval (greater 60% to 80%) and thefifth interval (greater 80% to 100%) were clas-sified as high and very high risk to wind erosion, respec-tively. Medium risk was assigned to the third interval (between 40% and 60%). Further, a zonal averaging of the cell values within eachfield was applied to achieve a more common meanfield value for matching the results with cross compliance on soil erosion.
The model reliability was tested by (i) excluding individ-ual modules, (ii) varying of the weighting of each module in the fuzzy logic routine and (iii) extracting the orientation of fields (in the fourth and fifth risk classes) by minimum bounding geometry to assess whether the longest axis of the field is parallel to the main wind direction (240°) of erosive winds and, therefore, more prone to a mobilization of topsoil by wind. Furthermore, snow fence positions served as a controlling indicator for wind exposed fields. Even though the process of snowdrift in winter might differ from aeolian mobilization during spring and early summer, high wind intensities and exposedfields are identified.
Combination of SoLoWind with small-scale orography modelling
The outputs of SoLoWind were linked to high-resolution wind speed and direction rasters, which enabled a more detailed evaluation on a local scale than SoLoWind alone. Station measurements of wind speeds and directions were regionalized by the influence of the relief with the orography model Wind Atlas Analysis and Application Program (WAsP) (by Trœn & Petersen, 1989, 1990). We used the
measurements of the closest gauging station and a digital elevation model with a spatial resolution of 20 m for that modification. By the small-scale modelling, the frequency distribution of wind directions and associated wind speeds can be determined for a sub-region with a limited amount of gauging stations. This local assessment for an example sub-region results in the investigation of potential tracks of mobilized soil material and the identification of potential off-site effects (Riksen and de Graaff, 2001; Goossens, 2003) of wind erosion such as endangered objects, street bodies and landscape components by a semi-automated and visual evaluation.
Table II. Average height and maximal protection zones of wind-breaks (after Blume 2004) derived from BTLNK, InVeKoS, ATKIS, OSM and orthophotos
Type of windbreak Average height (m)
Maximal protection zone (m) in leeward
Forest 20 500
Grove 15 375
Tree row 10 250
Bridge 10 250
Wetland 10 250
Building and urban space 10 250
Hedge 8 200
Field border 1 25
BTLNK, biotope and land use mapping; InVeKoS, Integrated
Administra-tion and Control System; ATKIS, Official Topographic-Cartographic
RESULTS AND DISCUSSION
SoLoWind Application: Regional Wind Erosion Risk Modelling for Western Saxony
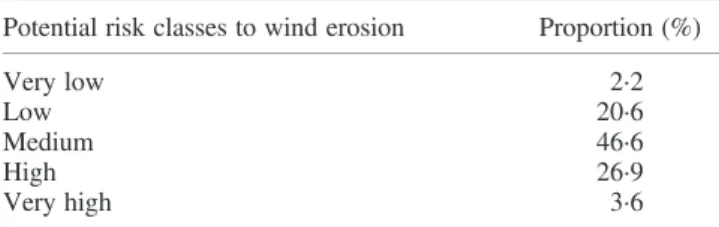
Soil loss by wind indicates that 22·8% of the arablefields in Western Saxony have very low or low and 30·5% fields have a high or very high risk of wind erosion (with 3·6% offields having a very high risk of wind erosion; Table III, Figure 4).
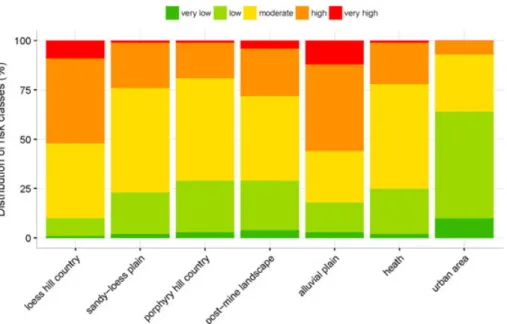
Congruent with physical process understanding, larger fields (greater than 116 ha) show a higher proportion (51·7%) of very high risk. Only a small percentage (5·2%) of the 3·6% of very-high-riskfields was detected on fields smaller than 21 ha. More than one-third (37·3%) of high-and very-high-risk fields are orientated parallel (with its longest axis) to the main wind direction of 240°. The landscape type loess hill country in the south of the study area and alluvial plains along the rivers (Figure 1) have highest proportions in the top risk class (Figure 5). Alluvial plains are also one of the riskiest areas to wind erosion in the national model DIN19706 (Bug, 2014). These landscapes
are characterized by the most mobile soil texture class from 0·08 to 0·1 mm with the lowest fluid threshold (necessary wind shear velocity to mobilize soil particles; Bagnold, 1941) and by intensified agricultural usage with bare soils in spring (according to module soil cover; COV). Owing to the management common in the region, both loess hill country and alluvial plains show bare soil on approximately 60% of all arablefields during March. A lower wind erosion risk occurs in urban landscapes, porphyry country, heath, sandy-loess plain and post-mining landscapes (Figure 1). Urban landscapes are least susceptible, owing to relative small fields and decelerating impact of buildings on wind speeds. In the other landscape types where the wind erosion risk is relatively low, a majority offields is covered by veg-etation according to the assessment in module COV. In ad-dition, the topsoil of the sandy-loess plain and porphyry country has high amounts of clay aggregates decreasing soil erodibility. Heathland has a relatively low wind erosion risk (Figure 5) because it is shaped by lower moraines with generally permanent vegetation cover and additionally char-acterized by sand, which is more resistant to mobilization. Approximately two-thirds of all arable fields in the post-mining landscape are covered by vegetation in spring (module COV), and therefore, that landscape type is less risky in the erosive phase of the year.
By analysing each module separately, 30·9% of the cells of the module natural wind erosion susceptibility (SUS) are at very low susceptibility to natural wind erosion. Only 5·4% of the analysed agriculture land in Western Saxony is classified as having higher natural soil erosion susceptibil-ity by wind. In the soil cover module COV, more than the
Table III. Distribution of potential risk classes to wind erosion on arable land in Western Saxony
Potential risk classes to wind erosion Proportion (%)
Very low 2·2
Low 20·6
Medium 46·6
High 26·9
Very high 3·6
Figure 4. Mean wind erosion risk on arable land in Western Saxony modelled by soil loss by wind (SoLoWind). [Colourfigure can be viewed at
half of the arable land in the study area is assigned to be fully covered by vegetation in the investigated erosive periods from 2010 to 2012. Wherefield lengths are high, a protective effect of windbreaks is generally very low. There-fore, a similar risk pattern like for the MFL is visible for the MPZ. On afield scale, unprotected zones are located princi-pally in the centre offields because of an aggregation offield breaks atfield borders. Owing to the largefields in the study area, approximately 40% of the study area is without any protection byfield breaks. SoLoWind identified three main clusters with large proportions of high-risk classes in the study area. They are located in the regions of Geithain and Döbeln in the southern part and Torgau in the north-eastern part of Western Saxony (Figure 1).
Soil loss by wind results are very comparable with those of ILSWE. Both models assess the relative soil erosion sus-ceptibility and do not quantify absolute amounts of eroded soil. However, the good comparability might still be surpris-ing, because wind direction is not considered in ILSWE. Large fields and low numbers of windbreaks dominate in our study area, which might explain why wind direction is not crucially influencing the relative differences between fields. However, we would expect larger differences in study areas with smaller fields and irregular distribution of wind breaks, which will increase the dependency on wind direc-tion and might influence wind erosion susceptibility consid-erably. As such, SoLoWind can be used as an additional sub-model of the continental ILSWE model to assign the wind erosion risk on afield scale. Both models follow a sim-plified qualitative approach but rely on different parameters and are applied on different scales. Hence, SoLoWind can be supplemented to ILSWE on a regional or local scale and might serve as a tool to verify large-scale models.
Each module was tested with a variation in weight during the fuzzy logic routine of SoLoWind’s sensitivity check.
The various overlays resulted in very robust results for all four modules. Finally, the comparison of localities of snow fences in Western Saxony indicates that 60·5% (138) of all fences (228) are adjacent (max. distance of 50 m) to high-and very-high-risk fields, which indicates that these fields are also affected by snowdrift. The latter supports the plausibility of our model results because both processes, wind erosion by soil and snow drift, are dependent on exposition and wind forces.
Owing to its modular structure, SoLoWind is suitable to assess the influence of land use management on wind erosion susceptibility. Soil erodibility can be reduced by in-creasing the content of organic matter (module SUS), and wind speeds can be decelerated by installing windbreaks and structuring the landscape (module MPZ). Moreover, a dense soil cover during the erosive periods (module COV) is the most effective and immediate method to reduce soil erosion by wind.
SoLoWind Application: Assessing Wind Erosion Off-Site Effects and the Evaluation of Windbreak Effectiveness at Local Scale
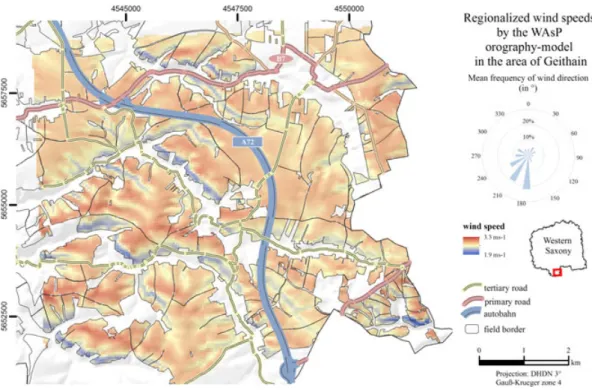
With our approach of considering the frequency distribu-tion of wind direcdistribu-tion on a local scale regionalized with the orography model WAsP (Figure 6), we can identify arable fields with regularly high wind speeds in the prevailing wind direction and the effect of the presence or absence of protecting windbreaks on endangered objects in the surrounding. For our sub-region, most frequently, the wind blows from the 165° to 195° directions. Windbreaks perpendicular to the 165° to 195° directions exist in the region (Figure 7), which decelerates wind speeds by lifting the wind field. Nevertheless, effec-tive windbreaks on arable fields in the main wind direction next to highway A72 are missing in many
segments. Therefore, highway A72 is specifically vulnera-ble in the vicinity to aravulnera-ble fields that are classified as risky (see risk zones in Figure 7). Moreover, the street body crosses the arable fields at ground level, which endangers traffic by reducing the visibility due to soil particles potentially mobilized by the wind. To our knowl-edge, protective windbreaks along the roadway are not
planned by the Saxon State Office for Road Construction and Traffic even though soil erosion by wind would be ‘strongly attenuated by the presence of nonerodible
rough-ness elements on the surface’ (Raupach et al., 1993). The identified risk zones should be evaluated in the further planning and management to prevent future off-site ef-fects. The local assessment can be transformed to other Figure 6. Regionalized wind speeds and direction according to the Wind Atlas Analysis and Application Program (WAsP) orography-model in the sub-region
of Geithain. [Colourfigure can be viewed at wileyonlinelibrary.com]
Figure 7. Risk zones of off-site effects by wind erosion in the area of Geithain under consideration of small-scale wind speeds and direction and windbreaks.
local sub-regions to evaluate the potential impact for soil loss of wind trajectories through the landscape.
CONCLUSIONS AND OUTLOOK
The soil loss by wind erosion model (SoLoWind) indicates the importance of windbreaks, which directly decelerate wind speed and can act as a measure to reduce SoLoWind. Either intra-field windbreaks or reduced field lengths have a protective effect. Our revised wind erosion screening model SoLoWind includes the consideration of the multidirectional-ity of the wind, the soil erodibilmultidirectional-ity, the state of soil cover, the field length and windbreaks. SoLoWind can also be used to verify and refine large-scale models by integrating it on a regional scale as a sub-model to models like ILSWE. As such, ILSWE was designed to define and parameterize the most relevant factors and conditions of wind erosion and can be supplemented by the qualitative and more detailed assessment of SoLoWind on regional and local scales. Both models, SoLoWind and ILSWE, show comparable general results for the study area even though they are assessing the risk of wind erosion with different approaches and on different scales. SoLoWind is transferable to other study areas and allows for spatial wind erosion risk assessment with low data demand at the regional to local scale. Further, SoLoWind is suitable for wind erosion risk predictions under changing climates by considering different climate change scenarios as input data. The application of SoLoWind to Western Saxony showed that about one-third of all arablefields have either high- or very-high-wind erosion risk. As such, we conclude that as in the adjacent federal states, wind erosion is a serious land degradation threat for Western Saxony. Three main regions were identified with predominantly high and very high soil erosion risk by wind. Sections along the highway A72 that are potentially endangered by wind erosion off-site effects could clearly be determined and need to be protected to avoid influences on road traffic. SoLoWind clearly displays the connection between wind direction, wind frequency and landscape elements and can consequently serve as a planning tool to mitigate the impact of on- and off-site effects of wind erosion risk. We suggest that SoLoWind may serve as a planning tool for soil conservation strategies.
ACKNOWLEDGEMENTS
The authors would like to thank Jürgen Heinrich and Gud-run Mayer for the technical revision of the model conception and the German Weather Service, the Saxon State Office for the Environment, Agriculture and Geology, the Saxon State Office for Road Construction and Traffic, the Saxon State Ministry of the Environment and Agriculture, the Saxon State Spatial Data and Land Survey Corporation, the Saxon Road Maintenance Depots, OpenStreetMap and the National Aeronautics and Space Administration for providing the datasets. We would also like to thank three anonymous reviewers for helpful comments.
REFERENCES
Arndt O. 2004. Hinweise zur Landschaftsentwicklung auf der
Querfurt-Merseburger Platte aus historisch-geographischer Sicht.Naturschutz im
Land Sachsen-Anhalt41: 3–13.
Bagnold R. 1941. The physics of blown sand and desert dunes. Springer: Mineola, N.Y.
Baude M, Meyer BC. 2006. Landschaftsdynamik und Produktionsfunktion im Kontext gesellschaftlicher und ökonomischer Veränderungen seit dem
18. Jahrhundert im Raum Taucha-Eilenburg (NW-Sachsen).
Siedlungsforschung Archäologie - Geschichte - Geographie: 317–351. Bernhardt A, Haase G, Mannsfeld K, Richter K, Schmidt R. 1986.
Naturräume der sächsischen Bezirke. Sächsische Heimatblätter
-Sonderdruck aus den Heften 4/5.
BGR Bundesanstalt für Geowissenschaften und Rohstoffe. 2016. Bodenatlas Deutschland: Böden in thematischen Karten. BGR Bundesanstalt für Geowissenschaften und Rohstoffe: Hannover. BGR Bundesanstalt für Geowissenschaften und Rohstoffe & Geologische
Landesämter. 1982. AG Bodenkunde: Bodenkundliche Kartieranleitung. Schweizerbart: Hannover.
Blume H (ed). 2004. Handbuch des Bodenschutzes: Bodenökologie und -belastung; vorbeugende und abwehrende Schutzmaßnahmen. Ecomed: Landsberg am Lech.
Böhner J, Schäfer W, Conrad O, Gross J, Ringeler A. 2003. The WEELS
model: methods, results and limitations. CATENA 52: 289–308.
DOI:10.1016/S0341-8162(03)00019-5.
Borrelli P, Ballabio C, Panagos P, Montanarella L. 2014. Wind erosion
sus-ceptibility of European soils. Geoderma 232-234: 471–478.
DOI:10.1016/j.geoderma.2014.06.008.
Borrelli P, Lugato E, Montanarella L, Panagos P. 2016a. A new assessment of soil loss due to wind erosion in European agricultural soils using a
quantitative spatially distributed modelling approach.Land Degradation
& Development. DOI:10.1002/ldr.2588.
Borrelli P, Panagos P, Montanarella L. 2015. New insights into the geogra-phy and modelling of wind erosion in the European agricultural land ap-plication of a spatially explicit indicator of land susceptibility to wind
erosion.Sustainability7: 8823–8836. DOI:10.3390/su7078823.
Borrelli P, Panagos P, Ballabio C, Lugato E, Weynants M, Montanarella L. 2016b. Towards a pan-European assessment of land susceptibility to
wind erosion. Land Degradation & Development 27: 1093–1105.
DOI:10.1002/ldr.2318.
Brotons JM, Díaz AR, Sarría FA, Serrato FB. 2010. Wind erosion on
mining waste in southeast Spain. Land Degradation & Development
21: 196–209. DOI:10.1002/ldr.948.
Bruun TB, Elberling B, de Neergaard A, Magid J. 2015. Organic carbon dynamics in different soil types after conversion of forest to agriculture. Land Degradation & Development26: 272–283. DOI:10.1002/ldr.2205.
Bug J. 2014. BGR Bundesanstalt für Geowissenschaften und Rohstoffe. In Potentielle Erosionsgefährdung der Ackerböden durch Wind in Deutschland 1:1.000.000. BGR Bundesanstalt für Geowissenschaften und Rohstoffe: Hannover.
Cerdà A, Lavee H, Romero-Díaz A, Hooke J, Montanarella L. 2010. Pref-ace.Land Degradation & Development21: 71–74. DOI:10.1002/ldr.968.
Chepil WS. 1960. Conversion of relativefield erodibility of soil by wind.
Soil Science Society of America Proceedings: 143–145.
Chepil WS, Woodruff NP. 1963. The physics of wind erosion and its control. Advances in Agronomy: 211–302. DOI:10.1016/S0065-2113(08)60400-9. Cole GW. 1983. Wind erosion modeling. Proceedings of the Natural Re-sources Modeling Symposium, Pingree Park, CO, October 16-21 1983:
59–63.
Combeau A. 1977. Erosion et conservation des sols. : Paris.
Deetz K, Klose M, Kirchner I, Cubasch U. 2016. Numerical simulation of a dust event in northeastern Germany with a new dust emission scheme in
COSMO-ART.Atmospheric Environment 126: 87–97. DOI:10.1016/j.
atmosenv.2015.11.045.
Deumelandt P, Kasimir M, Steininger M, Wurbs D. 2014.
Beratungsleitfaden Bodenerosion und Sturzfluten: Lokale Kooperation
zwischen Landwirten und Gemeinden sowie weiteren Akteueren zur Vermeidung von Bodenerosion. Halle (Saale).
Dörries J. 2011. Sand in der Luft.Mitteldeutsche Zeitung20thJuly 2011.
DPA. 2014. Brutal-Böen in Brandenburg: Sandsturm auf der Autobahn. Bäume entwurzelt: Berliner Kurier.
Dregne HE, Chou N. 1992. Global desertification dimensions and costs. In
Flemming G. 1994. Wald - Wetter - Klima: Einführung in die Forstmeteorologie. Deutscher Landwirtschaftsverlag: Berlin.
Frielinghaus M, Deumlich D, Funk R, Helmig K, Thiere J, Völker L, Winnige B. 2002. Beiträge zum Bodenschutz in Mecklenburg-Vorpommern. Landesamt für Umwelt, Naturschutz und Geologie Meck-lenburg-Vorpommern: Schwerin.
Fritsche B, Ertel U. 2012. Landwirtschaftszählung 2010. Statistisches Landesamt Sachsen: Kamenz.
Fryrear DW, Ali Saleh JD, Bilbro HM, Schomber JE, Stout J, Zobeck TM.
1998. Revised wind erosion equation (RWEQ).Agricultural Research
Service Technical Bulletin55.
Fryrear DW, Bilbro JD, Saleh A, Schomberg H, Stout JE, Zobeck TM.
2000. RWEQ: improved wind erosion technology.Journal of Soil and
Water Conservation55: 183–189.
Führer J. 2016. Sandsturm fegt über Bensdorf. Blickpunkt Brandenburg. Funk R, Skidmore E, Hagen LJ. 2004. Comparison of wind erosion
measurements in Germany with simulated soil losses by WEPS.
Environ-mental Modelling & Software19: 177–183. DOI:10.1016/S1364-8152
(03)00120-8.
Funk R, Reuter HI. 2006. Wind erosion. In Soil erosion in Europe,
Boardman J, Poesen J (eds). Wiley: Chichester, UK; 563–582.
Funk R. 2004. Viel Wind um Nichts?: Forschungen zur Winderosion in Brandenburg: much wind about nothing? Wind erosion research in
Brandenburg. Archives of Agronomy and Soil Science 50: 309–317.
DOI:10.1080/03650340410001663855.
Geipel L. 2011. Sandsturm auf der B 6n schockt viele Autofahrer. Mitteldeutsche Zeitung.
Glotfelty DE, Leech MM, Jersey J, Taylor AW. 1989. Volatilization and wind erosion of soil surface applied atrazine, simazine, alachlor, and
tox-aphene. Journal of Agricultural and Food Chemistry 37: 546–551.
DOI:10.1021/jf00086a059.
Gomes L, Arrúe JL, López MV, Sterk G, Richard D, Gracia R, Sabre M, Gaudichet A, Frangi JP. 2003. Wind erosion in a semiarid agricultural
area of Spain: the WELSONS project. CATENA 52: 235–256.
DOI:10.1016/S0341-8162(03)00016-X.
Goossens D. 2003. On-site and off-site effects of wind erosion. In Wind erosion on agricultural land in Europe: research results for land managers, Warren A (ed): Brussels.
Guo Z, Zobeck TM, Zhang K, Li F. 2013. Estimating potential wind erosion of agricultural lands in northern China using the revised wind erosion
equation and geographic information systems.Journal of Soil and Water
Conservation68: 13–21. DOI:10.2489/jswc.68.1.13.
Gregory J, Vining R, Peck L, Wofford K. 1999. TEAM: the Texas Tech Wind Erosion Analysis Model. In Sustaining the global farm: selected pa-pers from the 10th International Soil Conservation Organization Meeting,
24–29 May 1999, West Lafayette IN, Stott DE, Mohtar RH, Steinhardt
GC (eds). USDA-ARS National Soil Erosion Laboratory: West Lafayette. Hagen LJ. 1991. A wind erosion prediction system to meet user needs.
Journal of Soil and Water Conservation46: 106–111.
Hassenpflug W. 2004. Winderosion. In Handbuch des Bodenschutzes:
Bodenökologie und -belastung; vorbeugende und abwehrende
Schutzmaßnahmen, Blume H (ed). Ecomed: Landsberg am Lech; 215–223.
Helbig H. 2015. Fallbeispiele zur Bodenerosion in Sachsen-Anhalt. Landesamt für Geologie und Bergwesen: Halle.
Holmes PJ, Thomas DSG, Bateman MD, Wiggs GFS, Rabumbulu M. 2012. Evidence for land degradation from aeolian sediment in the west-central
free state province, South Africa.Land Degradation & Development23:
601–610. DOI:10.1002/ldr.2177.
Kairis O, Karavitis C, Salvati L, Kounalaki A, Kosmas K. 2015. Exploring the impact of overgrazing on soil erosion and land degradation in a dry
Medi-terranean agro-forest landscape (Crete, Greece).Arid Land Research and
Management29: 360–374. DOI:10.1080/15324982.2014.968691.
Klehn C. 2014. Sandsturm peitscht über Nordosten hinweg. Nordkurier. Klir GJ, Folger TA. 1988. Fuzzy sets, uncertainty, and information, 7. print.
Prentice Hall: Englewood Cliffs, NJ.
Knauss J. 2005. Beiträge zur Agrargeographie und Landwirtschaftsgeschichte des historischen Mitteldeutschlands ein Sammelband. Deutsches Landwirtschaftsmuseum Schloss Blankenhain: Crimmitschau.
Kosko B. 1993. Fuzzy thinking: the new science of fuzzy logic. New York NY: Hyperion.
Lal R. 2001. Soil degradation by erosion.Land Degradation &
Develop-ment12: 519–539. DOI:10.1002/ldr.472.
Lang S, Blaschke T. 2007. Landschaftsanalyse mit GIS. Ulmer: Stuttgart. Lee JJ, Phillips DL, Dodson RF. 1996. Sensitivity of the US corn belt
to climate change and elevated CO2: II. Soil erosion and organic
carbon. Agricultural Systems 52: 503–521. DOI:10.1016/S0308-521X
(96)00015-7.
LfUG Sächsisches Landesamt für Umwelt und Geologie. 2007. Bodenatlas des Freistaates Sachsen: Teil 4: Auswertungskarten zum Bodenschutz: Dresden.
LLUR Landesamt für Landwirtschaft, Umwelt und ländliche Räume des Landes Schleswig-Holstein. 2011. Winderosion in Schleswig-Holstein: Kenntnisse und Erfahrungen über Bodenverwehungen und Windschutz. Flintbek.
Lu H, Shao YP. 2001. Toward quantitative prediction of dust storms: an
integrated wind erosion modelling system and its applications.
Environ-mental Modelling & Software 16: 233–249. DOI:10.1016/S1364-8152
(00)00083-9.
Manhart J, Bittorf A, Büttner A. 2012. Disaster victim identification–
expe-riences of the“Autobahn A19”disaster.Forensic Science, Medicine, and
Pathology8: 118–124. DOI:10.1007/s12024-011-9307-9.
Masulli F, Pasi G, Yager R 2013. Fuzzy logic and applications: 10th
international workshop, WILF 2013, Genoa, Italy, 19–22 November
2013; proceedings. Springer: Cham.
McBratney A, Odeh IO. 1997. Application of fuzzy sets in soil science:
fuzzy logic, fuzzy measurements and fuzzy decisions. Geoderma77:
85–113. DOI:10.1016/S0016-7061(97)00017-7.
Mezősi G, Blanka V, Bata T, Kovács F, Meyer B. 2015. Estimation of regional
differences in wind erosion sensitivity in Hungary.Natural Hazards and
Earth System Science15: 97–107. DOI:10.5194/nhess-15-97-2015.
Montanarella L. 2007. Trends in land degradation in Europe. In Climate and
land degradation, Sivakumar MVK, Ndiang’ui N (eds). Springer: Berlin,
Heidelberg.
Morgan RPC. 2005. Soil erosion and conservation. Blackwell Publishing: Malden, Mass.
Morgan RPC. 2007. Vegetative-based technologies for erosion control. In Eco- and ground bio-engineering: the use of vegetation to improve slope stability; Proceedings of the First International Conference on
Eco-Engineering, 13–17 September 2004, Stokes A Dordrecht.
Munson SM, Belnap J, Okin GS. 2011. Responses of wind erosion to climate-induced vegetation changes on the Colorado Plateau. Proceedings of the National Academy of Sciences 108: 3854–3859.
DOI:10.1073/pnas.1014947108.
Niemann E, Stephan G. 1982. Landschaftseinheiten des Bezirkes Leipzig. Leipzig.
NLÖ Niedersächsisches Landesamt für Ökologie. 2003.
Bodenqualitätszielkonzept Niedersachsen: Teil 1: Bodenerosion und
Bodenversiegelung. Niedersächsisches Landesamt für Ökologie:
Hannover.
Panagos P, Ballabio C, Borrelli P, Meusburger K, Klik A, Rousseva S,
TadićMP, Michaelides S, Hrabalíková M, Olsen P, Aalto J, Lakatos
M, Rymszewicz A, Dumitrescu A, Beguería S, Alewell C. 2015. Rainfall
erosivity in Europe.The Science of the Total Environment511: 801–814.
DOI:10.1016/j.scitotenv.2015.01.008.
Pérez-Cabello F, Ibarra P, Echeverría MT, de La Riva J. 2010. Post-fire
land degradation ofPinus sylvestrisL. woodlands after 14 years.Land
Degradation & Development21: 145–160. DOI:10.1002/ldr.925.
Prosdocimi M, Cerdà A, Tarolli P. 2016. Soil water erosion on
Mediterra-nean vineyards: a review. CATENA 141: 1–21. DOI:10.1016/j.
catena.2016.02.010.
Raupach MR, Gillette DA, Leys J. 1993. The effect of roughness elements on
wind erosion threshold.Journal of Geophysical Research98: 3023–3029.
Rihani R, Bensmaili A, Legrand J. 2009. Fuzzy logic modelling tracer response in milli torus reactor under aerated and non-aerated conditions. Chemical Engineering Journal 152: 566–574. DOI:10.1016/j.
cej.2009.05.025.
Riksen MJPM, de Graaff J. 2001. On-site and off-site effects of wind
erosion on European light soils.Land Degradation & Development12:
1–11. DOI:10.1002/ldr.423.
RPV Regionaler Planungsverband Westsachsen. 2007. Fachbeitrag
Naturschutz und Landschaftspflege zum Landschaftsrahmenplan
Planungsregion Westsachsen. Regionaler Planungsverband Westsachsen: Leipzig.
Schäfer W. 2015. Potenzielle Winderosionsgefährdung - ermittelt nach DIN
19706. http://www.lbeg.niedersachsen.de/portal/live.php?navigation_
id=826&article_id=606&_psmand=4 [accessed 16 November 2015]. Sterk G, López MV, Arrúe JL. 1999. Saltation transport on a silt loam soil
in northeast Spain. Land Degradation & Development10: 545–554.
DOI:10.1002/(SICI)1099-145X(199911/12)10:6<
Tatarko J, Sporcic M, Skidmore E. 2013. A history of wind erosion predic-tion models in the United States Department of Agriculture prior to the
Wind Erosion Prediction System. Aeolian Research 10: 3–8.
DOI:10.1016/j.aeolia.2012.08.004.
Toy TJ, Foster GR, Renard KG. 2002. Soil erosion: processes, prediction, measurement, and control. Wiley: New York, NY.
Troen I, Petersen E. 1989. European wind atlas. Risø National Laboratory: Roskilde.
Troen I, Petersen E. 1990. Europäischer Windatlas. Risø National Labora-tory: Roskilde.
van Lynden G, Mantel S, van Oostrum A. 2004. Guiding principles for the quantitative assessment of soil degradation: with a focus on salinization, nutrient decline and soil pollution: FAO: Rome.
Vieira RMSP, Tomasella J, Alvalá RCS, Sestini MF, Affonso AG, Rodriguez DA, Barbosa AA, Cunha APMA, Valles GF, Crepani E, de Oliveira SBP, de Souza MSB, Calil PM, de Carvalho MA, Valeriano DM, Campello FCB, Santana MO. 2015. Identifying areas susceptible
to desertification in the Brazilian northeast. Solid Earth 6: 347–360.
DOI:10.5194/se-6-347-2015.
Wagner L. 2013. A history of wind erosion prediction models in the United States Department of Agriculture: the wind erosion prediction
system (WEPS). Aeolian Research 10: 9–24. DOI:10.1016/j.
aeolia.2012.10.001.
Wang T. 2014. Aeolian desertification and its control in Northern China.
International Soil and Water Conservation Research 2: 34–41.
DOI:10.1016/S2095-6339(15)30056-3.
Wang T, Xue X, Zhou L, Guo J. 2015. Combating aeolian desertification in
Northern China. Land Degradation & Development 26: 118–132.
DOI:10.1002/ldr.2190.
Williams JR, Renard KG, Dyke PT. 1983. EPIC: a new method for
assessing erosion’s effect on soil productivity.Journal of Soil and Water
Conservation38: 381–383.
Woodruff N, Siddoway F. 1965. A wind erosion equation. Soil Science
Society of America Proceedings29: 602–608.
Xie LW, Zhong J, Chen FF, Cao FX, Li JJ, Wu LC. 2015. Evaluation of soil
fertility in the succession of karst rocky desertification using principal
com-ponent analysis.Solid Earth6: 515–524. DOI:10.5194/se-6-515-2015.
Xu EQ, Zhang HQ. 2014. Characterization and interaction of driving factors
in karst rocky desertification: a case study from Changshun, China.Solid
Earth5: 1329–1340. DOI:10.5194/se-5-1329-2014.
Youssef F, Visser S, Karssenberg D, Bruggeman A, Erpul G. 2012.
Calibra-tion of RWEQ in a patchy landscape; afirst step towards a regional scale
wind erosion model. Aeolian Research 3: 467–476. DOI:10.1016/j.
aeolia.2011.03.009.
Zadeh LA. 1965. Fuzzy sets. Information and Control 8: 338–353.
DOI:10.1016/S0019-9958(65)90241-X.
Zadeh LA, Kacprzyk J. 1992. Fuzzy logic for the management of uncer-tainty. Wiley: New York.
ZALF Leibniz-Zentrum für Agrarlandschaftsforschung. Unpub.
Winderosion in Brandenburg.
Zobeck TM, Parker NC, Haskell S, Guoding K. 2000. Scaling up fromfield
to region for wind erosion prediction using afield-scale wind erosion
model and GIS.Agriculture, Ecosystems & Environment82: 247–259.
DOI:10.1016/S0167-8809(00)00229-2.
Zou X, Zhang C, Cheng H, Kang L, Wu Y, Zou X, Zhang C, Cheng H, Kang L, Wu Y. 2015. Cogitation on developing a dynamic model of soil
wind erosion.Science China-Earth Sciences58: 462–473. DOI:10.1007/