Concepts, Instrumentation
and Techniques in Inductively
Coupled Plasma Optical
Emission Spectrometry
Charles B. Boss and Kenneth J. Fredeen
PRINTED IN U.S.A.
ABOUT THE AUTHORS
Charles B. Boss is an Associate Professor of Chemistry at North Carolina State University. He graduated from Wake Forest University with a B.S. degree in chemistry in 1968. After serving in the U.S. Navy, he entered Indiana University, where he received a Ph.D. in chemistry in 1977 under the direction of Prof. Gary Hieftje. At N.C. State, Dr. Boss has worked on the development and characterization of several types of flame and plasma sources for atomic spectroscopy. His present research interests also include the use of computer automation and chemometrics for enhancement of analytical techniques.
Kenneth J. Fredeen is the Director of Environmental & Applied Inorganic Systems at The Perkin-Elmer Corporation. He graduated summa cum laude from Thiel College with a B.A. degree in chemistry in 1980, and from Texas A&M University with a Ph.D. in chemistry in 1985. While at Texas A&M, his graduate studies centered on the use of laser-excited atomic fluorescence spectroscopy for charac-terization of flames and plasmas used in analytical atomic spectrometry. Dr. Fredeen joined Perkin-Elmer in 1985 and has since been involved in the development of software, instrumentation and applications for the ICP-OES and ICP-MS product lines.
ACKNOWLEDGEMENTS
The authors gratefully acknowledge the valuable contributions from all those persons who reviewed manuscripts for this book and provided many useful com-ments and suggestions. In particular, we would like to thank Dennis Yates, Sabina Slavin, Walter Slavin, Jack Kerber, Mark Werner, Dave Hilligoss, Deborah Hoult, Barbara Ruocco and DonnaJean Fredeen in this regard. Special thanks go to Professor S. Roy Koirtyohann for some helpful insights and suggestions. We would also like to acknowledge Charles Keil for his fine work on many of the illustrations throughout this book.
TABLE OF CONTENTS
Preface . . . ix
1 An Overview of Elemental Analysis via Atomic Spectroscopy Techniques
Nature of Atomic and Ionic Spectra . . . 1-2 Analytical Techniques Based on Atomic Spectrometry . . . 1-5 Atomization and Excitation Sources . . . 1-6 A Short History of Optical Emission Spectroscopy. . . 1-7
2 General Characteristics of ICP-OES
The ICP Discharge . . . 2-1 Detection of Emission . . . 2-7 Extraction of Information. . . 2-8 Performance Characteristics . . . 2-9 Role of the ICP in an Analytical Laboratory . . . 2-11
3 ICP-OES Instrumentation
Sample Introduction
Nebulizers . . . 3-2 Pumps. . . 3-6 Spray Chambers . . . 3-8 Drains . . . 3-9 Alternative Sample Introduction Techniques . . . 3-9 Production of Emission
Torches . . . 3-13 Radio Frequency Generators . . . 3-16 Collection and Detection of Emission
Transfer Optics . . . 3-16 Conventional ICP Instrumentation
Wavelength Dispersive Devices . . . 3-17 Detectors . . . 3-21 Echelle Grating-Based ICP Instrumentation
Wavelength Dispersive Devices . . . 3-23 Advanced Array Detectors . . . 3-24 Axial or End-on Viewing ICP Instrumentation . . . 3-28 Signal Processing and Instrument Control
Signal Processing . . . 3-32 Computers and Processors . . . 3-33 Software . . . 3-33
4 ICP-OES Methodology
An Overview of ICP-OES Methodology. . . 4-2 ICP-OES Interferences----General Considerations . . . 4-4 Preparation of Samples and Standards. . . 4-5 Sample Introduction. . . 4-7 Operating Conditions. . . 4-8 Wavelength Selection . . . 4-13 Emission Measurement . . . 4-14 Instrument Calibration . . . 4-15 Samples Analysis . . . 4-16 Report Generation . . . 4-16 Correcting for Spectral Interferences in ICP-OES . . . 4-16 Simple Background Shift . . . 4-16 Sloping Background Shift. . . 4-17 Direct Spectral Overlap . . . 4-17 Complex Background Shift . . . 4-21 Other Spectral Interference Correction Techniques . . . 4-22
5 ICP-OES Applications
Agriculture and Foods . . . 5-3 Biological and Clinical . . . 5-3 Geological . . . 5-4 Environmental and Waters . . . 5-4 Metals . . . 5-5 Organics . . . 5-6
Appendix A - Instrument Maintenance and Performance Verification
Instrument Care and Maintenance
Sample Introduction System and ICP Torch . . . A-1 RF Generator . . . A-2 Spectrometer . . . A-2 Computer . . . A-3 Verification of Instrument Performance . . . A-3
Appendix B - Glossary
Appendix C - Bibliography and References
PREFACE
The widely used analytical technique for the determination of trace elements, inductively coupled plasma--optical emission spectrometry (ICP--OES), marked its thirty-third anniversary in 1997. [In this book, the technique will be referred to as ICP--OES though the reader may notice that many technical publications refer to it as inductively coupled plasma--atomic emission spectrometry (ICP-AES). Unfortu-nately, the latter designation is sometimes confused with Auger Electron Spectrometry (AES). In the interest of clarity, therefore, the term iInductively coupled plasma -optical emission spectrometry" (ICP--OES) has been rigidly adopted.]
Many advances have been made since the first commercial ICP-OES instruments were introduced to the analytical community. Advancements in the understanding of the ICP source and the measurement of emission signals have led to many improvements in the design of the components that comprise the instruments used for ICP-OES. Other advances have resulted through the use of computers with these instruments and the increasing levels of automation and sophistication that they help to realize.
Despite the advances in ICP-OES instrumentation and software, ICP-OES is not a "foolproof" technique. Because ICP-OES is a sensitive trace analysis technique, care must be taken in the preparation of standards, blanks and samples introduced into the instrument. The instrumentation must be set up properly and parameters, such as wavelengths and background correction points, must be selected to fit the application. Attention to details seemingly as minor as changing the peristaltic pump tubing when it is worn can make the difference between acceptable and unaccept-able analysis results.
There are several sources of specific, detailed information about the ICP-OES technique available. It was felt, however, that there was still a need for a general introductory guide for new and potential users of ICP-OES. Such a guide should provide basic, practical information to help new users better understand the funda-mentals behind, and requirements for, performing good analyses using the ICP-OES technique.
This book is intended as that introduction to the ICP-OES technique. It was written not only for those persons who have some familiarity with other analytical techniques such as atomic absorption spectrometry but also for novices in the field of analytical chemistry. The book begins with some simple, yet fundamental, concepts regarding atomic spectroscopy and the analytical techniques based on this field of study. As one progresses through the book, more detail regarding the ICP-OES technique is
applications. The reader should not be alarmed if his or her particular application is not mentioned here. So many different ICP-OES applications have been developed in the last thirty-three years that it would be difficult to describe them all in a single volume. We have also included in an appendix some information about instrument maintenance and performance verification. While this kind of practical information can be vital to obtaining good analytical results, it is sometimes difficult to find.
Finally, in the back of this book there is a glossary of terms as they are commonly used in atomic spectroscopy. The reader may find it helpful to refer occasionally to this section for further details regarding terms that are used in the main body of the book.
We hope that this introduction to the ICP-OES technique will provide useful information to those persons who are about to get involved with ICP-OES as well as present ICP users and those with simply a curiosity about the technique.
1
AN OVERVIEW OF ELEMENTAL
ANALYSIS VIA ATOMIC
SPECTROSCOPY TECHNIQUES
One of the simplest questions that an analyst can ask about the chemical compo-sition of a sample is "which elements are present and at what concentrations?" Since there are only 92 naturally occurring elements and millions of different molecules, differentiating among the elements is a much easier task than differentiating among the molecules. Nonetheless, the elemental composition of a sample is often an important part of the information needed to assess its properties.
For example, consider a water sample which is determined to contain 88.2% oxygen and 11.0% hydrogen by mass, meaning that only 99.2% of the sample could be made up of water molecules. Whether the water from which this sample was taken is useful for a particular purpose may well depend on the remaining 0.8%. If this water sample contained as much as a microgram of boron per gram of sample (0.0001% of the mass), the water would be perfectly useful for most purposes. If, however, you wanted to use that water in the fabrication of ceramic turbine blades for jet engines, purification would be required. When water containing as much as one part per million boron is used in the manufacture of the ceramics for these turbine blades, their failure rate rises dramatically. Research has shown that boron collects on the grain boundaries of the ceramic turbine blades, causing fractures that have been implicated in catastrophic failures of jet engines.
There are many other examples of the need for determining the trace level concentrations of elements within samples. For example, the United States Envi-ronmental Protection Agency has strict rules concerning trace levels of dangerous metals allowed in wastewaters. Some of these limits are in the parts per billion range. Determination of elemental concentrations at these trace levels requires the use of sensitive scientific instrumentation.
"atomic spectrometry", however, is that we generally include emission and absorp-tion of electromagnetic radiaabsorp-tion by charged atoms, or ions, also under the heading of atomic spectrometry.) By using atomic spectrometry techniques, meaningful quantitative and qualitative information about a sample can be obtained. In general, quantitative information (concentration) is related to the amount of electromagnetic radiation that is emitted or absorbed while qualitative information (what elements are present) is related to the wavelengths at which the radiation is absorbed or emitted.
An affiliated technique to atomic emission or absorption spectrometry is atomic mass spectrometry. In mass spectrometry, instead of obtaining analytical informa-tion from the radiainforma-tion of atoms or ions, ions introduced into a mass spectrometer are separated according to their mass to charge ratio and are either qualitatively or quantitatively detected.
Nature of Atomic or Ionic Spectra
The measurement of absorption and emission of electromagnetic radiation can be more easily described once the nature of atomic and ionic spectra is understood. Consider the Bohr model of an atom shown in Figure 1-1. The atom is depicted as a nucleus surrounded by electrons which travel around the nucleus in discrete orbitals. Every atom has a number of orbitals in which it is possible for electrons to travel. Each of these electron orbitals has an energy level associated with it. In general, the further away from the nucleus an orbital, the higher its energy level.
When the electrons of an atom are in the orbitals closest to the nucleus and lowest in energy, the atom is in its most preferred and stable state, known as its ground state. When energy is added to the atom as the result of absorption of electromag-netic radiation or a collision with another particle (electron, atom, ion, or molecule), one or more of several possible phenomena take place. The two most probable events are for the energy to be used to increase the kinetic energy of the atom (i.e., increase the velocity of the atom) or for the atom to absorb the energy and become excited. This latter process is known as excitation.
When an atom becomes excited, an electron from that atom is promoted from its ground state orbital into an orbital further from the nucleus and with a higher energy level. Such an atom is said to be in an excited state. An atom is less stable in its excited state and will thus decay back to a less excited state by losing energy through a collision with another particle or by emission of a "particle" of electromag-netic radiation, known as a photon. As a result of this energy loss, the electron returns to an orbital closer to the nucleus.
If the energy absorbed by an atom is high enough, an electron may be completely dissociated from the atom, leaving an ion with a net positive charge. The energy required for this process, known as ionization, is called the ionization potential and is different for each element. Ions also have ground and excited states through which they can absorb and emit energy by the same excitation and decay processes as an atom.
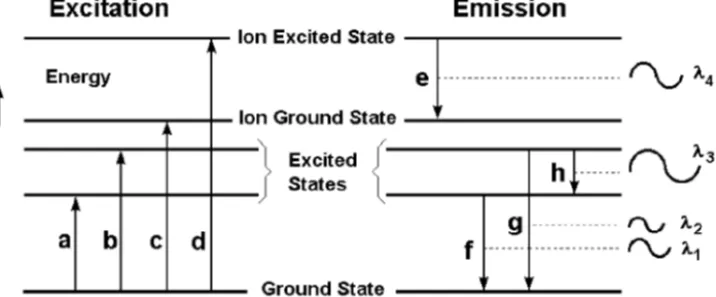
Figure 1-2 shows the excitation, ionization and emission processes schematically. The horizontal lines of this simplified diagram represent the energy levels of an atom. The vertical arrows represent energy transitions, or changes in the amount of energy of an electron. The energy transitions in an atom or ion can be either radiational
(involving absorption or emission of electromagnetic radiation) or thermal (involving energy transfer through collisions with other particles).
The difference in energy between the upper and lower energy levels of a radiative transition defines the wavelength of the radiation that is involved in that transition.
Figure 1-2. Energy level diagram depicting energy transitions where a and b rep-resent excitation, c is ionization, d is ionization/excitation, e is ion emission, and
f, g and h are atom emission.
The relationship between this energy difference and wavelength can be derived through Planck’s equation
E = hν
where E is the energy difference between two levels, h is Planck’s constant, and ν
is the frequency of the radiation. Substituting c/λ for n, where c is the speed of light and λ is wavelength, we get
E = hc/λ
This equation shows that energy and wavelength are inversely related, i.e., as the energy increases, the wavelength decreases, and vice versa. Using Figure 1-2 as an example, the wavelength for emission transition f is longer than the wavelength for emission transition g since the energy difference for f is less than for transition
g.
Every element has its own characteristic set of energy levels and thus its own unique set of absorption and emission wavelengths. It is this property that makes atomic spectrometry useful for element-specific analytical techniques.
The ultraviolet(UV)/visible region (160 - 800 nm) of the electromagnetic spectrum is the region most commonly used for analytical atomic spectrometry. This is also the region of the electromagnetic spectrum that we generally refer to as "light", although technically, all electromagnetic radiation can be considered as light. For further discussions in this book, the term "light" will often be used in place of "UV/visible electromagnetic radiation".
The principal reasons for the popularity of analytical techniques that use the UV/visible region are that these techniques are accurate, precise, flexible, and relatively inexpensive compared to techniques which use other regions, such as gamma ray spectrometry and X-ray spectrometry. Many of the devices used in UV/visible atomic spectrometry, such as photomultipliers and gratings, are relatively inexpensive since they were developed for and are commonly used in high-volume applications. Also, unlike gamma rays and X-rays, UV/visible radiation is not ionizing radiation. This lessens the expenses associated with shielding and licensing of the laboratory and with disposal of analyzed samples.
Analytical Techniques Based on Atomic Spectrometry
containing free atoms and ions of the element of interest. Figure 1-3 shows the instrumental arrangements for four different techniques used to detect these atoms or ions.
In atomic absorption spectrometry (AAS), light of a wavelength characteristic of the element of interest is shone through this atomic vapor. Some of this light is then absorbed by the atoms of that element. The amount of light that is absorbed by these atoms is then measured and used to determine the concentration of that element in the sample.
In optical emission spectrometry (OES), the sample is subjected to temperatures high enough to cause not only dissociation into atoms but to cause significant amounts of collisional excitation (and ionization) of the sample atoms to take place. Once the atoms or ions are in their excited states, they can decay to lower states through thermal or radiative (emission) energy transitions. In OES, the intensity of the light emitted at specific wavelengths is measured and used to determine the concentrations of the elements of interest.
One of the most important advantages of OES results from the excitation proper-ties of the high temperature sources used in OES. These thermal excitation sources can populate a large number of different energy levels for several different elements at the same time. All of the excited atoms and ions can then emit their characteristic radiation at nearly the same time. This results in the flexibility to choose from several different emission wavelengths for an element and in the ability to measure emission from several different elements concurrently. However, a disadvantage associated with this feature is that as the number of emission wavelengths increases, the
Figure 1-3. Atomic spectrometry systems.
probability also increases for interferences that may arise from emission lines that are too close in wavelength to be measured separately.
In atomic fluorescence spectrometry (AFS), a light source, such as that used for AAS, is used to excite atoms only of the element of interest through radiative absorption transitions. When these selectively excited atoms decay through radia-tive transitions to lower levels, their emission is measured to determine concentra-tion, much the same as in OES. The selective excitation of the AFS technique can lead to fewer spectral interferences than in OES. However, it is difficult to detect a large number of elements in a single run using AFS, as the number of spectral excitation sources and detectors that can be used at one time is limited by the instrument.
Another technique, called atomic mass spectrometry, is related to three atomic spectroscopy techniques described above. Instead of measuring the absorption, emission or fluorescence of radiation from a high temperature source, such as a flame or plasma, mass spectrometry measures the number of singly charged ions from the elemental species within a sample. Similar to the function of a monochro-mator in emission/absorption spectrometry that separates light according to wave-length, a quadrupole mass spectrometer separates the ions of various elements according to their mass-to-charge ratio in atomic mass spectrometry.
Atomization and Excitation Sources
In general, there are three types of thermal sources normally used in analytical atomic spectrometry to dissociate sample molecules into free atoms: flames, furnaces and electrical discharges. High-power lasers have also been used for this purpose but tend to be better suited for other uses such as solids sampling for other atomization sources.
Electrical discharges are the third type of atomization sources used in analytical optical emission spectrometry. For many years, dc arcs and ac sparks were the mainstay of OES. These electrical discharges are created by applied currents or potentials across an electrode in an inert gas and typically produce higher tempera-tures than traditional flame systems.
More recently, other types of discharges, namely plasmas, have been used as atomization/excitation sources for OES. Strictly speaking, a plasma is any form of matter that contains an appreciable fraction (>1%) of electrons and positive ions in addition to neutral atoms, radicals and molecules. Two characteristics of plasmas are that they can conduct electricity and are affected by a magnetic field.
The electrical plasmas used for analytical OES are highly energetic, ionized gases. They are usually produced in inert gases, although some work has also been done using reactive gases such as oxygen. These plasma discharges are considerably hotter than flames and furnaces and, thus, are used not only to dissociate almost any type of sample but also to excite and/or ionize the atoms for atomic and ionic emission. The present state-of-the-art in plasma sources for analytical optical emission spectrometry is the argon-supported inductively coupled plasma (ICP). Other plasmas currently being used include the direct current plasma (DCP) and the microwave induced plasma (MIP).
Because the argon ICP can efficiently generate singly charged ions from the elemental species within a sample, it makes an ideal ion source to use synergisti-cally with mass spectrometers. This combination of an ICP and mass spectrometer is called ICP-MS.
A Short History of Optical Emission Spectroscopy
Flames and electrical discharges have been an important part of chemical analysis for a long time. In 1752, 26-year old Thomas Melville of Glasgow wrote of his observations of a bright yellow light emitted from a flame produced by burning a mixture of alcohol and sea salt. When the alcohol contained no salt, the yellow color disappeared. It has been said that if Melville had not died a year later, spectrochemi-cal analysis might have gotten a much earlier start.
One of the first uses of sparks for chemical analysis was reported in 1776 by Alessandro Volta. Volta had discovered a way to produce a static electric charge strong enough to create sparks. He was fascinated by the different colors of sparks that he could obtain by sparking different materials. Eventually he was able to identify certain gases by the colors emitted when he applied a spark to them.
During the late 18th and early 19th centuries Fraunhofer and others looked at spectra emitted by flames and sparks, often comparing them to spectra emitted from the sun and planets. In 1826, W. H. Talbot reported a series of experiments in which he observed the coloring of flames by a variety of salts. Unfortunately, the utility of his work was not recognized for several decades.
It was not until 1859, when Kirchhoff and Bunsen surmised that that the sharp line spectra from flames were produced by atoms and not molecules, that the nature of emission spectra was beginning to be understood. Much of their work was made possible by Bunsen’s development of a burner which produced a nearly transparent, nonluminescent flame. This is the same burner that practically every chemist since Bunsen has used at one time or another. Credited with the discovery of spectro-chemical analysis, Kirchhoff and Bunsen developed methods based on emission spectroscopy that led to the discovery of four elements, Cs, Rb, Tl, and In, between 1860 and 1864.
In the beginning of the 20th century, the sharp lines that appeared in the light emitted from electrical arcs and sparks were a driving force for science. These atomic lines were used to define the discrete energy levels that exist in atoms and were thus one major test of theories developed with quantum mechanics. The lines were also used analytically for qualitative analysis. Indeed, the appearance of sharp spectral lines that had not been previously observed was the proof that most scientists required for the verification of the discovery of a new element.
During the middle of the 20th century, quantitative arc and spark spectroscopy was the best tool that analysts had to probe trace concentrations for a wide range of elements. The sample preparation techniques used were, for many samples, difficult and/or time-consuming. Conductive solids were relatively easy to handle; they were simply machined into electrodes that could be used to support the electrical discharge. Liquid samples, however, had to be either dried or plated onto electrodes by various means. Nonconductive solid samples were mixed with a conductive matrix, usually graphite, and pressed into the end of a graphite electrode. In addition to difficulty in handling all but the conductive solid samples, the quality of the data obtained was not very good. Precision of analysis of 5 to 10% RSD was typical for a very good and careful analyst. Standards and samples had to be made very similar since effects arising from the composition of the sample matrix were often large and difficult to predict. This type of analysis is still used today in foundries where the samples can be made easily into electrodes, the range of sample concentrations is limited, and a library of matched standard materials already exists.
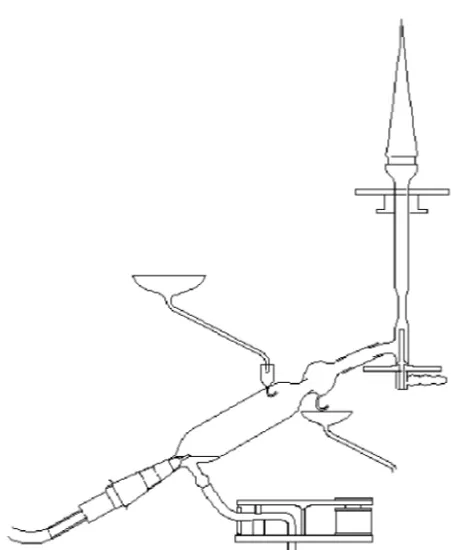
e l e m e n t s . A S w e d i s h agronomist named Lun-degårdh is credited with be-ginning the modern era of flame photometry in the late 1920’s. His apparatus for elemental analyses of plants, shown in Figure 1-4, used pneumatic nebuliza-tion and a premixed air-acetylene flame and is re-m a rk a b l y s i re-m i l a r to equipment used today.
While the atomic spectra emitted from flames had the advantage of being simpler than those emitted from arcs and sparks, the main limita-tion of the technique was that the flames were not hot enough to cause emission for many elements. Despite that limitation, several suc-cessful commercial instru-ments were based on the technique, many of which are still in use today. The most widespread use of the technique is in clinical labs for determining sodium and potassium levels in blood and other biological materials.
In the 1960’s and 1970’s both flame and arc/spark optical emission spectrometry declined in popularity. Many of the analyses that had been performed using optical emission were increasingly performed using atomic absorption spectrophotometry (AAS). While advances in flame emission spectrometry allowed the determination of about half of the elements in the periodic table, the technique could no longer compete well with AAS. Since absorption of light by ground state atoms was used as the mode of detection, the need for very high temperatures to populate excited states of atoms was no longer a limitation. The instabilities and spectral interfer-ences which plagued arc/spark emission techniques were also greatly reduced by atomic absorption techniques.
Figure 1-4. Spray chamber, nebulizer and burner such as those used by Lundegårdh for flame emis-sion spectrography. (Used with permisemis-sion from the Division of Analytical Chemistry of the American Chemical Society.)
At the time of its greatest popularity, flame atomic absorption was used primarily in the analysis of solutions for trace metals. For solid samples, the technique requires that samples be dissolved. With the exception of a few well-documented interfer-ences, samples and standards need not be made very similar. Flame atomic absorption offers the analyst high precision (0.2 to 0.5% RSD) determinations and moderate detection limits. Electrothermal atomization (graphite furnace) atomic absorption spectrometry, on the other hand, offers high sensitivity and low detection limits. Graphite furnace AAS (GFAAS) does provide poorer precision and a higher level of matrix interferences than are experienced with the flame-based technique. However, advances such as the use of stabilized temperature platform furnace (STPF) technology and Zeeman background correction have reduced or eliminated most of the interferences previously associated with GFAAS.
Both the flame and graphite furnace AAS techniques are used widely today and both provide excellent means of trace elemental analysis. Most atomic absorption instruments are limited, however, in that they typically measure only one element at a time. The instrumental setup or operating conditions may require changing hollow cathode lamps or using different furnace parameters for each element to be determined. Because of the different operating conditions and furnace parameters required for each element, conventional atomic absorption techniques do not lend themselves readily to multi-element simultaneous analysis.
Also, despite advances in nonlinear calibration, the need for sample dilution is greater than for present-day OES techniques, due to the limited working (calibration) range for the AAS techniques. Consequently, devices for automatic sample dilution when a sample concentration exceeds the calibration range are available. For those samples that require element preconcentration for lower detection limits, flow-injec-tion techniques coupled with cold vapor mercury or hydride generaflow-injec-tion equipment and GFAAS can not only provide significant improvements in detection limits, over 100 times better as compared to conventional hydride generation AA, but also may reduce potential interferences by the complete removal of matrix components.
Stanley Greenfield of Birmingham, England is credited with the first published report (1964) on the use of an atmospheric pressure inductively coupled plasma (ICP) for elemental analysis via optical emission spectrometry (OES) [1]. The conclusions from this landmark paper summarize what Greenfield identified as the advantages of plasma emission sources over flames, ac sparks and dc arcs:
The plasma source is far simpler to operate than the conventional arc and spark methods, especially in solution and liquid analysis, and gives the high degree of stability associated with the a.c. spark combined with the sensitivity of the d.c. arc. Particular advantages of the high-frequency plasma torch are the lack of electrodes, which gives freedom from contamination, and the extremely low back-ground produced.
As with most new techniques, the original optical emission results using ICP sources were not spectacular. The technique was better than flame atomic absorption for only a few of the most refractory elements. Along with Greenfield, Velmer Fassel and his colleagues at Iowa State University are generally credited with the early refinements in the ICP that made it practical for analysis of nebulized solutions by OES. The technique continued to be refined as sources of noise were tracked down and eliminated, and gas flows, torch designs and plasma settings were optimized. By 1973, the low detection limits, freedom from interferences and long linear working ranges obtained with the ICP proved that it was clearly an emission source superior to those used previously in analytical optical emission spectrometry. Since that time, an ever-increasing number of academic, governmental and industrial researchers have joined in the development of the ICP.
It has been mentioned that an affiliated technique to atomic spectroscopy for elemental analysis is ICP-MS. Though ICP-MS is not the subject of this handbook on the concepts, instrumentation and techniques in optical emission spectrometry, ICP-MS has become an important tool for the analyst since its commercial introduc-tion in 1983. ICP-MS was pioneered by just a few prominent laboratories: Iowa State University, Ames, Iowa; Sciex, a manufacturer’s laboratory in Toronto, Canada; and several facilities in the U.K. including the University of Surrey, the British Geological Survey and a U.K. manufacturer. The technique features high sensitivity and excellent detection limits, equal to or better than GFAAS for most elements. The mass spectra are considerably simpler than the atomic emission spectra from the ICP but the mass spectra are complicated by mass interferences from molecular ions originating in the ICP. However, ICP-MS allows for the routine use of isotopic ratio and isotopic dilution measurements to assist in the solution of analytical problems. Furthermore, qualitative analysis can be rapidly performed by ICP-MS techniques.
2
GENERAL CHARACTERISTICS OF
ICP-OES
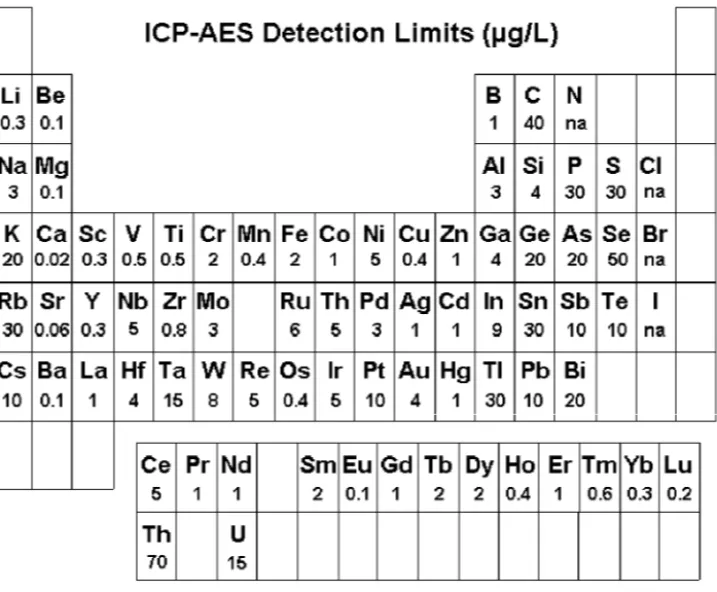
A well-known analytical chemist in the 1930’s once facetiously suggested that the ideal analytical laboratory would have a shelf with 92 bottles and in each bottle a reagent which specifically reacts with one of the then-known 92 elements. Although it is not quite what the chemist had in mind when he made that suggestion, modern ICP-OES instruments can nearly achieve that chemist’s wish. Routine determina-tions of 70 elements can be made by ICP-OES at concentration levels below one milligram per liter. Figure 2-1 contains a periodic table representation of the elements that can be determined by ICP-OES along with their detection limits.
In this chapter, some of the general characteristics of ICP-OES are described with the goal of providing an overview of the ICP and how it is used as a source for optical emission spectrometry. Also included is information regarding the typical perform-ance characteristics and figures of merit that can be expected of the technique. Finally, the role of ICP-OES instrumentation in the modern analytical laboratory is discussed briefly. More detailed information about ICP-OES instrumentation, meth-odology and applications is covered in subsequent chapters.
The ICP Discharge
The inductively coupled plasma discharge used today for optical emission spec-trometry is very much the same in appearance as the one described by Velmer Fassel in the early 1970’s. Argon gas is directed through a torch consisting of three concentric tubes made of quartz or some other suitable material, as shown in Figure 2-2. A copper coil, called the load coil, surrounds the top end of the torch and is connected to a radio frequency (RF) generator.
caught up in the magnetic field and accelerated by them. Adding energy to the electrons by the use of a coil in this manner is known as inductive coupling. These high-energy electrons in turn collide with other argon atoms, stripping off still more electrons. This collisional ionization of the argon gas continues in a chain reaction, breaking down the gas into a plasma consisting of argon atoms, electrons, and argon ions, forming what is known as an inductively coupled plasma (ICP) dis-charge. The ICP discharge is then sustained within the torch and load coil as RF energy is continually transferred to it through the inductive coupling process.
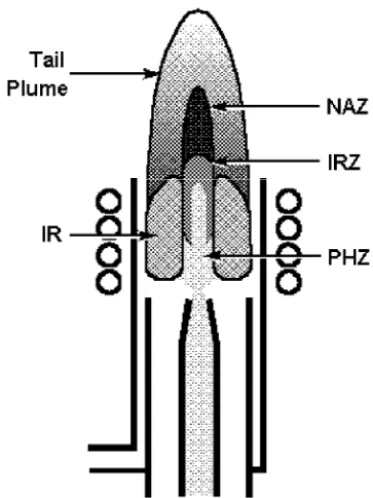
The ICP discharge appears as a very intense, brilliant white, teardrop-shaped discharge. Figure 2-3 shows a cross-sectional representation of the discharge along with the nomenclature for different regions of the plasma as suggested by Koirtyohann et al. [2]. At the base, the discharge is toroidal, or "doughnut-shaped" because the sample-carrying nebulizer flow literally punches a hole through the center of the discharge. The body of the "doughnut" is called the induction region (IR) because this is the region in which the inductive energy transfer from the load coil to the plasma takes place. This is also the area from which most of the white light, called the argon continuum, is emitted. Allowing the sample to be introduced through the induction region and into the center of the plasma gives the ICP many of its unique analytical capabilities.
Figure 2-2. Cross section of an ICP torch and load coil depicting an ignition se-quence. A - Argon gas is swirled through the torch. B - RF power is applied to the load coil. C - A spark produces some free electrons in the argon. D - The free electrons are accelerated by the RF fields causing further ionization and forming a plasma. E - The sample aerosol-carrying nebulizer flow punches a hole in the plasma.
Most samples begin as liquids that are nebulized into an
aerosol, a very fine mist of sample droplets, in order to be introduced into the ICP. The sample aerosol is then carried into the center of the plasma by the inner (or nebulizer) ar-gon flow. The functions of the ICP discharge (hereafter re-ferred to as the ICP or "the plasma") at this point are sev-eral fold. Figure 2-4 depicts the processes that take place when a sample droplet is in-troduced into an ICP.
The first function of the high temperature plasma is to re-move the solvent from, or
desolvate, the aerosol, usu-ally leaving the sample as mi-croscopic salt particles. The next steps involve decompos-ing the salt particles into a gas of individual molecules (
va-porization) that are then dissociated into atoms (atomization). These processes, which occur predominantly in the preheating zone (PHZ) shown in Figure 2-3, are the same processes that take place in flames and furnaces used for atomic absorption spectrometry.
Once the sample aerosol has been desolvated, vaporized and atomized, the plasma has one, or possibly two, functions remaining. These functions are excita-tion and ionization. As explained in Chapter 1, in order for an atom or ion to emit its characteristic radiation, one of its electrons must be promoted to a higher energy level through an excitation process. Since many elements have their strongest emission lines emitted from the ICP by excited ions, the ionization process may also be necessary for some elements. The excitation and ionization processes occur predominantly in the initial radiation zone (IRZ) and the normal analytical zone (NAZ). The NAZ is the region of the plasma from which analyte emission is typically measured.
While the exact mechanisms for excitation and ionization in the ICP are not yet fully understood, it is believed that most of the excitation and ionization in the ICP takes place as a result of collisions of analyte atoms with energetic electrons [3]. There is also some speculation about the role of argon ions in these processes. In any case, the chief analytical advantage of the ICP over other emission sources are derived from the ICP’s ability to vaporize, atomize, excite, and ionize efficiently and reproducibly a wide range of elements present in many different sample types.
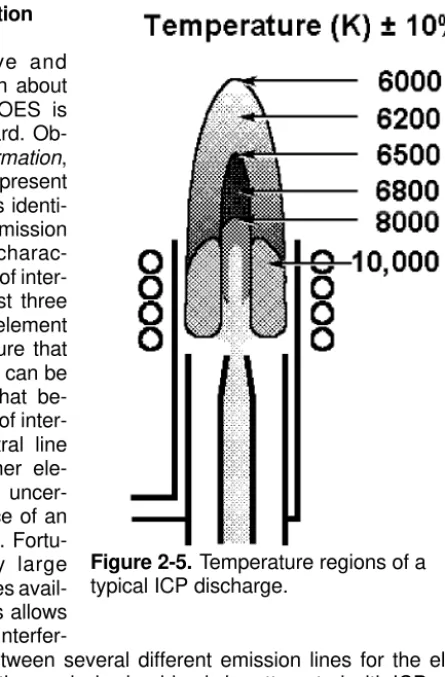
One of the important reasons for the superiority of the ICP over flames and furnaces for the above is in the high temperature within the plasma. Figure 2-5 shows approximate temperatures for different regions of the ICP. While flames and furnaces have upper temperature ranges in the area of 3300 K, the gas temperature in the center of the ICP is about 6800 K [4]. Besides improving excitation and
Figure 2-4. Process that takes place when a sample droplet is introduced into an ICP discharge.
ionization efficiencies, the higher temperature of the ICP also reduces or eliminates many of the chemical interferences found in flames and furnaces.
Other electrical discharge emission sources, such as arcs, sparks, direct current plasmas, and microwave induced plasmas, also have high temperature and thus may be as efficient at excitation and ionization as the ICP. However, it is largely the ICP’s combination of stability and freedom from sample matrix interferences that makes the ICP a better source for atomic emission spectrometry than these other electrical discharge sources.
An important feature of the ICP that is not common to most other emission sources is that since the sample aerosol is introduced through the center of the ICP, it can be surrounded by the high temperature plasma for a comparatively long time, approximately 2 milliseconds. It is this long residence time of the analyte particles in the center of the plasma that is largely responsible for the lack of matrix interferences in the ICP. In addition, because the aerosol is in the center of the discharge and the energy-supplying load coil surrounds the outside of the plasma, the aerosol does not interfere with the transfer of the energy from the load coil to the discharge. In some other sources, such as the direct current plasma, the sample travels around the outside of the discharge where it does not experience uniform high temperature for as long. In the arcs and sparks, the sample may commingle with the entire electrical discharge and interfere with the production and sustain-ment of the discharge. These situations lead to the higher levels of matrix effects and poorer stability that are often characteristic of non-ICP discharges.
Detection of Emission
Extraction of Information
Extracting qualitative and quantitative information about a sample using ICP-OES is generally straightforward. Ob-taining qualitative information,
i.e., what elements are present in the sample, involves identi-fying the presence of emission at the wavelengths charac-teristic of the elements of inter-est. In general, at least three spectral lines of the element are examined to be sure that the observed emission can be indeed classified as that be-longing to the element of inter-est. Occasional spectral line interferences from other ele-ments may make one uncer-tain about the presence of an element in the plasma. Fortu-nately, the relatively large number of emission lines avail-able for most elements allows one to overcome such
interfer-ences by choosing between several different emission lines for the element of interest. (Note: Qualitative analysis should only be attempted with ICPs utilizing a monochromator or advanced detector technology. Polychromators with photomul-tiplier detectors should not be used for qualitative analyses. Monochromators, polychromators and detectors are discussed in some detail in Chapter 3.)
Obtaining quantitative information, i.e., how much of an element is in the sample, can be accomplished using plots of emission intensity versus concentration called
calibration curves (Figure 2-6). Solutions with known concentrations of the ele-ments of interest, called standard solutions, are introduced into the ICP and the intensity of the characteristic emission for each element, or analyte, is measured. These intensities can then be plotted against the concentrations of the standards to form a calibration curve for each element. When the emission intensity from an analyte is measured, the intensity is checked against that element’s calibration curve to determine the concentration corresponding to that intensity.
Figure 2-5. Temperature regions of a typical ICP discharge.
The computers and software used with ICP-OES instruments represent these calibration curves mathematically within the computer’s memory. Thus, it is not necessary for the analyst to construct these curves manually for quantitation of the elements in the sample. Because calibration curves are generally linear over four to six orders of magnitude in ICP-OES, it is usually necessary to measure only one or two standard solutions, plus a blank solution, to calibrate the ICP instrument. In contrast to ICP-OES, arc and spark sources require five or more standards per element because of nonlinear calibration curves. The nonlinearity in these sources is a direct result of self-absorption which is the process by which some of the emitted radiation of the analyte is absorbed by ground state atoms in the plasma. In conventional ICPs, nonlinearity in the calibration curves is usually only observed for high analyte concentrations; i.e., greater than 5 to 6 orders of magnitude above the detection limit. (The effect of self-absorption with regard to an axial or end-on ICP is discussed in Chapter 3.)
Performance Characteristics
As indicated in Figure 2-1, the ICP-OES technique is applicable to the determination of a large number of elements. The detection limits for these elements are generally in the µg/L (ppb) range. As in many techniques, the detection limit is regarded as the lowest concentration at which the analyst can be relatively certain that an
element is present in a sample. Measurements made at or near the detection limit, however, are not considered to be quantitative. For purposes of rough quantitation (±10%), it is recommended that an element’s concentration should be at least five times higher than the detection limit. For accurate quantitation (± 2%), the concen-tration should be greater than 100 times the detection limit.
While most of the over 70 elements that can be determined by ICP-OES have low detection limits, it is worthwhile to discuss the elements that are usually not determined at trace levels by ICP-OES. These elements fall into three basic categories. The first category includes those elements that are naturally entrained into the plasma from sources other than the original sample. For example, in an argon ICP, it would be hopeless to try to determine traces of argon in a sample. A similar limitation might be encountered because of the CO2 contamination often
found in argon gas. When water is used as a solvent, H and O would be inappro-priate elements, as would C if organic solvents were used. Entrainment of air into the plasma makes H, N, O and C determinations quite difficult, although not impossible.
Another category of elements generally not determined at trace levels by ICP-OES includes those elements whose atoms have very high excitation energy require-ments such as the halogens, Cl, Br and I. Though these elerequire-ments may be determined, the detection limits are quite poor compared to most ICP elements. The remaining category includes the man-made elements which are typically so radioactive or short-lived that gamma ray spectrometry is preferable for their determination.
The upper limit of linear calibration for ICP-OES is usually 104 to 106 times the
detection limit for a particular emission line. For example, the maximum linear concentration for the Mn 257.610 nm emission line is about 50 mg/L or about 105
times its 0.0004 mg/L detection limit. The range of concentrations from the detection limit to this upper limit is known as the linear dynamic range (LDR) of the emission line.
The advantages of long LDRs are basically twofold. Firstly, it makes calibration of the instrument simpler. Atomic absorption, arc and spark techniques have LDRs of only one or two orders of magnitude and require the use of nonlinear calibration curves to extend the working range (i.e., the actual calibration range used) for an element. While the techniques for calculating nonlinear curves have improved over the years, they still require multiple data points, i.e., multiple standards must be run in order to define the nonlinear curve. In ICP-OES, where linear calibration curves are the norm, only two solutions, the blank and a high standard, need to be analyzed to produce a calibration curve.
The other advantage of long LDRs is that less sample dilution is required. Even when nonlinear curves are used, the techniques that have shorter LDR’s tend to require more sample dilution to keep the analyte concentrations within the working range for the element of interest.
Besides being able to determine a large number of elements over a wide range of concentrations, a major advantage of the ICP-OES technique is that many elements can be determined easily in the same analytical run. This multielement capability arises from the fact that all of the emission signals needed to obtain qualitative and quantitative information are emitted from the plasma at the same time.
The precision and accuracy of the ICP-OES analyses are considered sufficient for most trace elemental analyses. Even in the presence of interferences, modern signal compensation techniques allow the analyst to perform analyses with remark-able accuracy. Precision of analysis is usually in the 1% or less RSD (relative standard deviation) range when the concentration is greater than 100 times the detection limit. Better precision can be obtained, but often with trade-offs in speed and/or flexibility, or through the use of longer measurement times and special signal compensation techniques.
When ICP-OES was first introduced as a technique for trace elemental analysis, it was claimed by some experts that the technique was free from interferences. While this was somewhat optimistic, the ICP-OES technique probably experiences the fewest interferences of any of the commonly used analytical atomic spectrometry techniques. Chemical interferences are largely eliminated by the high temperature of the plasma. Physical interferences can be compensated for easily by taking advantage of the ICP’s multielement capability. While spectral interferences have the potential for causing the most inaccuracies with ICP-OES analyses, the use of high-resolution spectrometers and advanced background correction techniques, coupled with the flexibility to choose from many possible emission lines, allows for interference-free analyses of the majority of samples. The interferences mentioned above and methods for overcoming them will be described in greater detail in Chapter 4.
Role of the ICP in an Analytical Laboratory
In many laboratories, ICP-OES is used to complement the other techniques available in the lab. For example, many labs are equipped with an ICP-OES instrument to perform moderate sensitivity, high sample throughput, multielement analyses and a graphite furnace AAS instrument to perform single element deter-minations which require higher sensitivity. (In Chapter 3, the possibilities of replac-ing the sreplac-ingle element GFAAS system with the axially viewed ICP is discussed.)
To provide a better understanding of the role of ICP-OES instruments in the modern analytical laboratory, the ICP-OES technique is compared to three other trace elemental analysis techniques----flame (FAAS) and graphite furnace (GFAAS) atomic absorption spectrometry and ICP-mass spectrometry (ICP-MS).
Flame and Furnace Atomic Absorption Spectrometries. The flame and furnace AAS techniques are both excellent choices for many analytical laboratories. Two princi-pal advantages of FAAS are initial instrument cost and simplicity of operation. FAAS detection limits for many elements are comparable to those obtained by ICP-OES, although the ICP-OES technique is typically preferred for refractory compound-forming elements. The prices of the least expensive ICP-OES instruments are now approaching the prices of the top-of-the-line FAAS.
A principal advantage of the graphite furnace AAS technique over FAAS and ICP-OES is its greater sensitivity, which results in significantly lower detection limits for most elements. Another advantage of GFAAS is the ability to analyze very small amounts (µL) of sample easily. A low-cost GFAAS instrument is less expensive than ICP-OES instruments while top-of-the-line GFAAS instruments are in the same price range as the lower-to mid-priced ICP-OES instruments.
The main advantage of ICP-OES over the AAS techniques in general are its multielement capabilities, longer linear dynamic ranges, and fewer condensed phase interferences. In addition, besides the refractory compound-forming ele-ments, elements such as I, P and S are detected with more sensitivity by the ICP-OES technique.
Inductively Coupled Plasma - Mass Spectrometry is one of the most recently developed techniques for trace elemental analysis. ICP-MS uses the same type of ICP source as is used for ICP-OES. In the ICP-MS technique, the analyte ions formed in the ICP are sent through a mass spectrometer where they are separated according to their mass/charge ratios (m/e). The number of ions at the m/e’s of interest are then measured and the results used for qualitative and quantitative purposes.
Since its commercial introduction in 1983, ICP-MS has been demonstrated to be a powerful trace elemental analysis technique. It has the sensitivity and detection
limits typical of GFAAS, combined with the multielement capability of ICP-OES. While mass spectral interferences are few, ones that do exist generally can be overcome by using alternate masses or mathematical correction techniques. Early ICP-MS systems, in addition to being much more expensive than ICP-OES instru-ments, have experienced more severe sample matrix interferences than are experienced in ICP-OES. However, these interferences, along with the cost of the instruments, have been considerably reduced through refinements in the instru-mentation, particularly in the sample introduction system.
Because of their respective advantages and disadvantages, selecting between the ICP-OES, FAAS, GFAAS, and ICP-MS techniques for a given set of circumstances is generally not a difficult task. For example, if an application requires single element trace analyses for relatively few samples or if initial cost is the most important factor, then FAAS is quite often the technique of choice. If an application requires very low detection limits for just a few elements, the GFAAS technique would probably be selected. If however, an application required very low detection limits for forty elements per sample, then ICP-MS would be a likely candidate. Likewise, if the application called for multielement analyses of samples in a complicated matrix or if a high sample throughput rate with moderate sensitivity was required, then ICP-OES might be the best choice.
3
ICP-OES INSTRUMENTATION
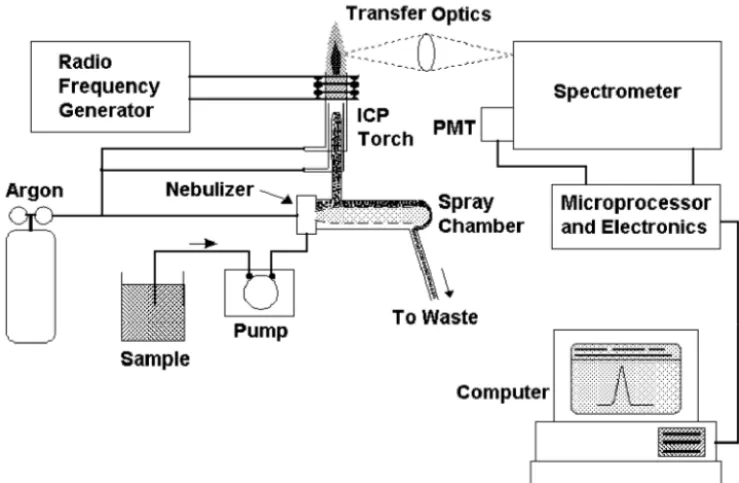
In inductively coupled plasma-optical emission spectrometry, the sample is usually transported into the instrument as a stream of liquid sample. Inside the instrument, the liquid is converted into an aerosol through a process known as nebulization. The sample aerosol is then transported to the plasma where it is desolvated, vaporized, atomized, and excited and/or ionized by the plasma (see Chapter 2). The excited atoms and ions emit their characteristic radiation which is collected by a device that sorts the radiation by wavelength. The radiation is detected and turned into elec-tronic signals that are converted into concentration information for the analyst. A representation of the layout of a typical ICP-OES instrument is shown in Figure 3-1.
In this chapter, the instrumentation used for each of these steps is described along with variations and alternatives that may be employed. The chapter is divided into sections dealing with the instrumentation for sample introduction, production of emission, collection and detection of emission, and signal processing and computer control. There is also a section briefly describing some of the accessories used with ICP-OES instruments.
SAMPLE INTRODUCTION
Nebulizers
Nebulizers are devices that convert a liquid into an aerosol that can be transported to the plasma. The nebulization process is one of the critical steps in ICP-OES. The ideal sample introduction system would be one that delivers all of the sample to the plasma in a form that the plasma could reproducibly desolvate, vaporize, atomize and ionize, and excite. Because only small droplets are useful in the ICP, the ability to produce small droplets for a wide variety of samples largely determines the utility of a nebulizer for ICP-OES.
Many forces can be used to break up a liquid into an aerosol; however, only two have been used successfully with an ICP, pneumatic forces and ultrasonic mechani-cal forces. Most commercial ICP nebulizers are of the pneumatic type. These nebulizers use high-speed gas flows to create an aerosol. The use of pneumatic nebulizers in ICP-OES follows their use and development in flame atomic absorp-tion spectrometry, with one especially important difference in design considera-tions. In flame atomic absorption a gas flow on the order of ten liters per minute is often employed for nebulization, while the nebulization flow in the ICP is optimal at approximately one liter per minute. Years of research have left us with primarily three pneumatic nebulizers, each with its own advantages.
The type of pneumatic nebulizer most commonly used in flame AAS, and thus one of the first nebulizers to be used for ICP-OES, is the concentric nebulizer. A typical concentric nebulizer used for ICP-OES is shown in Figure 3-2. In this nebulizer, the solution is introduced through a capillary tube to a low-pressure region created by a gas flowing rapidly past the end of the capillary. The low pressure and high-speed gas combine to break up the solution into an aerosol.
nebulizers have improved their tolerance to dissolved solids with some being able to nebulize solutions containing 20% NaCl without clogging, for example. The most popular concentric nebulizers, the Meinhard® nebulizers, are made from glass and are therefore breakable and subject to corrosion by solutions containing hydroflu-oric acid.
Another type of concentric nebulizer, called the micro-concentric nebulizer (MCN), is also available (Figure 3-3). This compact nebulizer employs a small diameter capillary (polyimide or Teflon) and polyvinylidine difluoride (PVDF) body to minimize undesirable large drop formation and to facilitate HF tolerance. A very fine aerosol is produced consisting of only very small size droplets. While conventional concen-tric nebulizers have a sample uptake rate of 1 - 3 mL/min, the MCN is typically less than 0.1 mL/min permitting analysis of small sample volumes. This low sample uptake is beneficial in extending limited sample volumes so that the long
nebuliza-Figure 3-2. Concentric nebulizer used for ICP-OES.
Figure 3-3. Micro-concentric nebulizer used for ICP-OES.
tion times encountered with sequential ICPs undertaking multielement analysis may be successfully accomplished. In addition to the small sample volume and low sample uptake rates, the nebulizer also exhibits fast washout times which may particularly critical for samples containing such elements as boron and mercury.
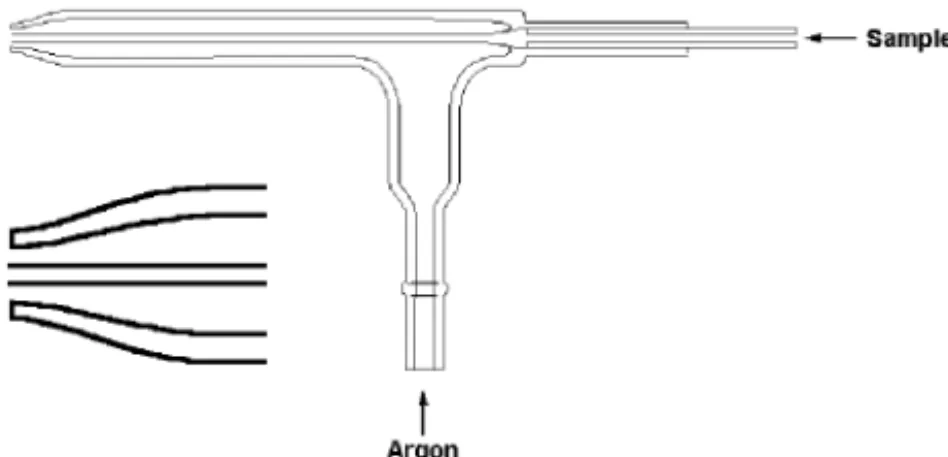
A second type of pneumatic nebulizer is the cross-flow nebulizer, shown in Figure 3-4. The operation of cross-flow nebulizers is often compared to that of a perfume atomizer. Here a high speed stream of argon gas is directed perpendicular to the tip of a capillary tube (in contrast to the concentric or micro-concentric nebulizers where the high-speed gas is parallel to the capillary). The solution is either drawn up through the capillary tube by the low-pressure region created by the high-speed gas or forced up the tube with a pump. In either case, contact between the high-speed gas and the liquid stream causes the liquid to break up into an aerosol. Cross-flow nebulizers are generally not as efficient as concentric nebulizers at creating the small droplets needed for ICP analyses. However, the larger diameter liquid capillary and longer distance between liquid and gas injectors minimize clogging problems. Many analysts feel that the small penalty paid in analytical sensitivity is more than compensated for by the freedom from clogging. Another advantage of cross-flow nebulizers is that they are generally more rugged and corrosion-resistant than glass concentric nebulizers. In fact, this nebulizer is available with a Ryton body, a clear sapphire liquid capillary tip and a red ruby gas injector tip both contained in a polyetheretherketone (PEEK) body, all which provide chemical resistance to samples.
The third type of pneumatic nebulizer used for ICP-OES is the Babington nebulizer. This nebulizer was originally developed as a way to nebulize fuel oil for industrial burners. The Babington nebulizer, shown in Figure 3-5, works by allowing the liquid to flow over a smooth surface with a small hole in it. High-speed argon gas
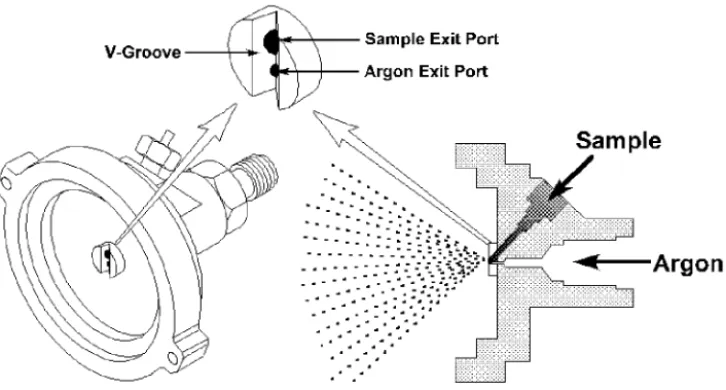
emanating from the hole shears the sheet of liquid into small drops. This nebulizer is the least susceptible to clogging and can nebulize very vis-cous liquids. A variation of the Babington nebulizer is the V-groove nebulizer shown in Figure 3-6. In the V-groove nebulizer, the sample flows down a groove which has a small hole in the center for the nebulizing gas. Working on the same principle as the Babington nebulizer, the V-groove ne-bulizer is being used increasingly for nebulization of solutions containing high salt and particulate concentra-tions. Improvements in the V-groove nebulizer include the cone spray nebu-lizer, shown in Figure 3-7, which is similar in principal to the V-groove but exhibits short term precisions of better than 1% for both aqueous solutions
Figure 3-6. V-groove nebulizer, a variation of the Babington nebulizer.
Figure 3-5. Babington nebulizer.
and soil samples with high d i s s o l v e d s o l i d s . O t h e r names for the V-groove nebu-l i z e r i n c nebu-l u d e modified Babington nebulizer, high sol-ids nebulizer and maximum dissolved solids nebulizer. In ultrasonic nebulization, liq-uid sample is pumped onto an oscillating piezoelectric transducer. The oscillations break the sample into a fine aerosol, so aerosol formation is independent of nebulizer gas flow. The efficiency of an ultrasonic nebulizer is typi-cally between 10% and 20%, at least 10-fold greater than typical pneumatic
nebuliza-Figure 3-8. Ultrasonic nebulizer with desolvation unit.
tion. More sample will reach the ICP, providing detection limits which are usually 10 times lower than pneumatic nebulization. The higher efficiency of the ultrasonic nebulizer increases the water load to the ICP, so a desolvation unit is added after the nebulizer (Figure 3-8). The cooling portion of the desolvation unit has been replaced, in some commercially available systems, with a Peltier cooling device. New autotuning circuitry has greatly improved the short and long term stability of the ultrasonic nebulizer allowing the system to be used for routine work. However, the ultrasonic nebulizer is still susceptible to matrix effects, high solids loading and is not HF resistant.
Pumps
Some of the nebulizers discussed here require that the solution be pumped into the nebulizer, the Babington types, including the V-groove, and the ultrasonic. While the concentric and some cross-flow nebulizers can naturally draw the solution into the nebulizer by a process known as aspiration, a pumped flow is useful for these nebulizers also. With a pumped solution, the flow rate of the solution into the nebulizer is fixed and is not as dependent on solution parameters such as viscosity and surface tension. The controlled flow rate of liquid also allows for more rapid washout of the nebulizer and spray chamber.
Peristaltic pumps, such as the one shown in Figure 3-9, are almost exclusively the pumps of choice for ICP-OES applications. These pumps utilize a series of rollers
Figure 3-9. Peristaltic pump used for ICP-OES.
that push the sample solution through the tubing using a process known as peristalsis. The pump itself does not come in contact with the solution, only with the tubing that carries the solution from the sample vessel to the nebulizer. Thus, the potential for contamination of the solution that may exist with other types of pumps is not a concern.
The special tubing used with a peristaltic pump must be compatible with the sample that is passing through it. Most types of peristaltic pump tubing are compatible with weakly acidified aqueous media. Pumping strongly acidic solutions or organic solvents, however, usually requires the use of tubing made of specific materials. ICP-OES instrument Operator’s Manuals often include guidelines for selection of the proper tubing. If this information is not provided, the analyst should consult chemical resistivity tables to select the proper pump tubing when strong acids or organic solvents are to be pumped.
Peristaltic pump tubing is the one part of an ICP system that usually requires frequent replacement. The analyst should check the pump tubing daily for wear, which is generally indicated by permanent depressions in the tubing that can be felt by running one’s fingers over the tubing. Failure to replace the worn pump tubing can result in poor instrument performance, since this may prevent a steady stream of sample from being delivered to the nebulizer. Tubing wear can be reduced by releasing the tension on the tubing when the pump is not in use.
Spray chambers
Once the sample aerosol is created by the nebulizer, it must be transported to the torch so it can be injected into the plasma. Because only very small droplets in the aerosol are suitable for injection into the plasma, a spray chamber is placed between the nebulizer and the torch. Some typical ICP spray chamber designs are shown in Figure 3-10. The primary function of the spray chamber is to remove large droplets from the aerosol. A secondary purpose of the spray chamber is to smooth out pulses that occur during nebulization, often due to pumping of the solution.
Drains
While it is a seemingly simple part of a sample introduction system, the drain that carries excess sample from the spray chamber to a waste container can have an impact on the performance of the ICP instrument. Besides carrying away excess sample, the drain system provides the backpressure necessary to force the sample aerosol-carrying nebulizer gas flow through the torch’s injector tube and into the plasma discharge. If the drain system does not drain evenly or if it allows bubbles to pass through it, the injection of sample into the plasma may be disrupted and noisy emission signals can result.
Drains for ICP-OES sample introduction systems come in many forms----loops, blocks, U-tubes, or even tubing connected to a peristaltic pump. For proper performance, it is important to keep the liquid level within the drain system at the recommended position. Also, when introducing organic-based samples into the ICP, it may be necessary to use drain tubing designated for use with organic solvents.
Alternative Sample Introduction Techniques
Several alternatives to nebulizers and spray chambers have been used as sample introduction systems for ICP-OES. The most widely used alternative technique is
hydride generation. With this technique, the sample, in dilute acid, is mixed with a reducing agent, usually a solution of sodium borohydride in dilute sodium hydroxide. The reaction of the sodium borohydride with the acid produces atomic hydrogen. The atomic hydrogen then reacts with the Hg, Sb, As, Bi, Ge, Pb, Se, Te, and Sn in the solution to form volatile hydrides of these elements. These gaseous
com-Figure 3-10. Typical spray chambers used with ICP-OES. A - Scott double pass type, B - conical single-pass type with impact bead.
A B
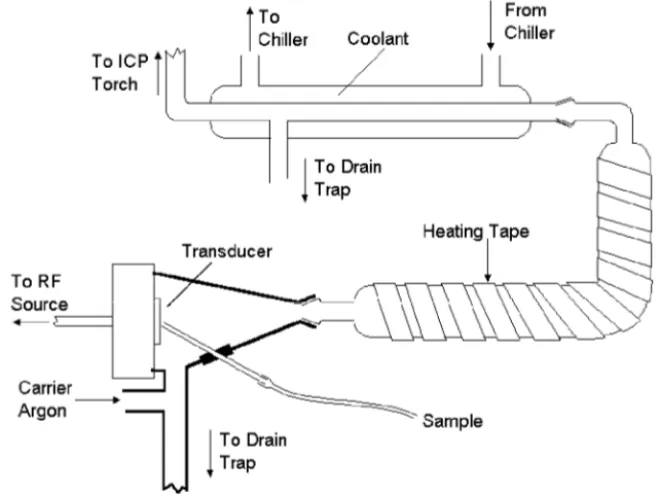
pounds are then separated from the rest of the reaction mixture and transported to the plasma. A schematic representation of a continuous-flow hydride generation system is shown in Figure 3-11.
Improvements in detection limits by a factor of up to 1000 for those elements listed above have been achieved using hydride generation. The reasons for the vast improvement in sensitivity for these elements are 1) the sample introduction rate for the hydride generator is often as much as ten times the rate for a pneumatic nebulizer, and 2) the efficiency with which the volatile hydrides are delivered to the plasma is near 100%, compared to the 1 - 5% efficiency when using a pneumatic nebulizer and spray chamber.
The graphite furnace or other electrothermal device has been used in research laboratories to vaporize a small portion of a liquid or solid sample for ICP-OES sample introduction. Most researchers have chosen to use one of the graphite tube atomizers designed for atomic absorption spectrometry. As shown in Figure 3-12, the normal sample introduction system of the ICP instrument is replaced by a graphite furnace. The sample vapor from the furnace is swept into the center of the ICP discharge in a conventional torch. While high sensitivity is possible, other aspects of using electrothermal vaporization, such as the use of compromise
furnace conditions, have limited the number of applications of this technique for ICP sample introduction. Also, since these devices are generally not of a continu-ous-flow nature, their use requires an ICP instrument that can record transient signals. The electrothermal vaporization devices have not met with much commer-cial success with ICP instrumentation but have realized some application as a sample introduction system for ICP-MS.
Solid samples have been introduced to the plasma via arc and spark sources such as those first used in the early days of optical emission spectrometry. Laser ablation techniques, in which a high-power laser is used to vaporize a small portion of a sample, have also been applied to the analysis of solids by ICP-OES. While a few applications using these techniques have been reported, the difficulty of
stand-Figure 3-12. Graphite furnace modified for ICP-OES sample introduction.
ardizing with solids can limit their utility in some cases. There are two major considerations in laser ablation, suitable matrix matched standards and the high cost, that have limited the use of this technique.
Some researchers have inserted solid samples directly into the center of the plasma toroid using a special device such as the one shown in Figure 3-13. This technique is referred to as direct insertion. A carbon electrode is packed with a solid sample and inserted into the plasma. The sample vaporizes into the plasma and atomic emission can be observed. However, as yet, the direct insertion technique has not been commercialized.
Another technique, direct injection nebulization, uses a micro concentric nebulizer that is inserted into the ICP torch in place of the normal injector tube. Sample is sprayed directly into the central channel of the ICP; there is no spray chamber. This technique has been applied successfully to the determination of memory-prone elements (B, I and Hg), analyses of small volume samples enabling high sample throughput, and as an interface for on-line liquid chromatography. An important feature of the direct injection nebulizer (DIN), illustrated in Figure 3-14, is 100% sample transport efficiency so sample waste is minimized and analyte transport effects are eliminated.
The study of sample introduction techniques is an active area for ICP-related research. Because sample introduction has been referred to as the "Achilles’ heel" of atomic spectrometry [5], scientists and engineers are continuously working to improve the current techniques as well as invent new ones. Once the sources of interferences are identified and remedied, techniques such as direct insertion and vapor phase sample introduction techniques may be useful for routine chemical analysis.
PRODUCTION OF EMISSION
Torches
The torches used today in ICP-OES are very similar in design and function to those reported by Fassel in the early days of ICP-OES [6]. As shown schematically in Figure 3-15, the torches con-tain three concentric tubes for argon flow and aerosol injection. The spacing be-tween the two outer tubes is kept narrow so that the gas introduced between them emerges at high velocity. This outside chamber is also designed to make the gas spiral tangentially around the chamber as it proceeds upward. One of the functions of this gas is to keep the
quartz walls of the torch cool Figure 3-15. Schematic of a torch used for ICP-OES.