www.the-cryosphere.net/11/139/2017/ doi:10.5194/tc-11-139-2017
© Author(s) 2017. CC Attribution 3.0 License.
Evaluation of single-band snow-patch mapping using
high-resolution microwave remote sensing: an application
in the maritime Antarctic
Carla Mora1, Juan Javier Jiménez1,2, Pedro Pina3, João Catalão4, and Gonçalo Vieira1
1CEG/IGOT – Universidade de Lisboa, Lisbon, Portugal
2Department of Physics and Mathematics, University of Alcalá de Henares, Alcalá de Henares, Spain 3CERENA/IST – Universidade de Lisboa, Lisbon, Portugal
4IDL – Universidade de Lisboa, Lisbon, Portugal
Correspondence to:Carla Mora ([email protected])
Received: 3 August 2016 – Published in The Cryosphere Discuss.: 29 August 2016 Revised: 24 December 2016 – Accepted: 2 January 2017 – Published: 23 January 2017
Abstract. The mountainous and ice-free terrains of the mar-itime Antarctic generate complex mosaics of snow patches, ranging from tens to hundreds of metres. These can only be accurately mapped using high-resolution remote sensing. In this paper we evaluate the application of radar scenes from TerraSAR-X in High Resolution SpotLight mode for map-ping snow patches at a test area on Fildes Peninsula (King George Island, South Shetlands). Snow-patch mapping and characterization of snow stratigraphy were conducted at the time of image acquisition on 12 and 13 January 2012. Snow was wet in all studied snow patches, with coarse-grain and rounded crystals showing advanced melting and with fre-quent ice layers in the snow pack. Two TerraSAR-X scenes in HH and VV polarization modes were analysed, with the former showing the best results when discriminating be-tween wet snow, lake water and bare soil. However, signifi-cant overlap in the backscattering signal was found. Average wet-snow backscattering was −18.0 dB in HH mode, with water showing −21.1 dB and bare soil showing −11.9 dB. Single-band pixel-based and object-oriented image classifi-cation methods were used to assess the classificlassifi-cation po-tential of TerraSAR-X SpotLight imagery. The best results were obtained with an object-oriented approach using a wa-tershed segmentation with a support vector machine (SVM) classifier, with an overall accuracy of 92 % and Kappa of 0.88. The main limitation was the west to north-west fac-ing snow patches, which showed significant error, an issue related to artefacts from the geometry of satellite imagery acquisition. The results show that TerraSAR-X in SpotLight
mode provides high-quality imagery for mapping wet snow and snowmelt in the maritime Antarctic. The classification procedure that we propose is a simple method and a first step to an implementation in operational mode if a good digital elevation model is available.
1 Introduction
In complex topography terrain, snowmelt patterns are diffi-cult to map accurately due to shadowing and layover effects (Rees and Steel, 2001), especially when a high spatial reso-lution is necessary (e.g. < 5 m). High-resoreso-lution satellite op-tical imagery is expensive, shows a large revisiting time and is only effective during the day and in cloud-free conditions. Recently, unmanned aerial vehicles have been shown to pro-vide efficient snow mapping results at a low cost (Bühler et al., 2016) but they are still limited by the lack of access to the survey area, as well as by meteorological conditions. In remote locations, such as the maritime Antarctic, with high cloudiness (ci 90 % of the days show cloud cover) and the continuous passage of polar frontal systems, more robust ap-proaches are needed for monitoring snowmelt over large ar-eas.
Late-lying snow patches are known to generate local influ-ences on the ground thermal regime and on moisture avail-ability, thus being of major significance for geomorphic pro-cesses, ecosystems and permafrost distribution, especially in the discontinuous permafrost zone (Green and Pickering,
2009). Recent observations in the maritime Antarctic indi-cate that snow patches play a key role in keeping the ground cooler during the summer, determining the presence of per-mafrost at sites where, without summer snow, it would not occur (Vieira et al., 2010). The influence of snow patches on the geomorphological dynamics gave rise to the use of nivation as an overarching term for the complex set of ge-omorphic processes acting in the vicinity of late-lying and perennial snow patches, with snow being their main driver (Thorn, 1988). Recurring nivation processes in the same lo-cation have been identified as responsible for the increased erosion and for the development of concavities, named ni-vation hollows. Snow is also a major ecological factor espe-cially since it controls moisture availability during the warm season, but also because snow traps wind-transported parti-cles that are deposited in snow patches, allowing for a better development of the vegetation (Brown and Ward, 1996; Er-ickson et al., 2005; Hiemstra et al., 2006; Green and Picker-ing, 2009). Snow also plays a major role in the distribution of lichen communities, inhibiting the development of Usnea sp.-dominated formations (Vieira et al., 2014).
Synthetic Aperture Radar (SAR) and Advanced Synthetic Aperture Radar (ASAR) imagery, e.g. from ERS, Envisat (C-band) and TerraSAR-X are widely used to characterize snow packs and snow cover (Shi and Dozier, 1997; Baghdadi et al., 1999; Bernier et al., 1999; Nagler and Rott, 2000; Rees and Steel, 2001; Magagi and Bernier, 2003; Vogt and Braun, 2004; Longépé et al., 2009; Falk et al., 2016). Most appli-cations have been developed for regional-scale mapping, but the literature lacks high spatial-resolution case studies. De-spite the wide application of C-band imagery, Baghdadi et al. (1997) and Koskinen and Pulliainen (1997) have shown that wet-snow and snow-free terrain can not be distinguished in some types of surfaces or in particular local incidence an-gles. Mora et al. (2013) tested ENVISAT ASAR C-band im-agery at 12 m pixel resolution for mapping snow cover in Deception Island and found that the imagery is only useful at the regional scale and of limited application for snow-patch mapping. In fact, according to some authors, X-band imagery is preferable to detect wet snow (Shi and Dozier, 1995; Strozzi et al., 1998, 1999). It shows a limited penetra-tion capacity in snow and is much more sensitive than other bands to the surficial snow pack (0 to 15 cm), enabling an evaluation of the snow electromagnetic response in a simpli-fied scheme when comparing it with C band (Wiesmann and Mätzler, 1999; Rott et al., 2013).
TerraSAR-X acquisitions in Spotlight mode show ca. 1 m resolution and are therefore potentially a good source for very detailed snow mapping. The German Aerospace Cen-ter (DLR) satellite shows a short revisit time (11 days) and an improved radiometric and geometric resolution, which are key factors to detect the evolution of the snow cover, espe-cially during snowmelt when changing moisture content in-fluences the backscattering signal. TerraSAR-X imagery is frequently used for interferometric applications
(Venkatara-man and Rao, 2005; Alia et al., 2015; Barboux et al., 2015; Betbeder et al., 2015; Reis et al., 2015), glaciology (Braun, 2001; König et al., 2001; Rott et al., 2011; Schubert et al., 2013) and also for snow mapping (Baghdadi et al., 1997; Malnes and Gunerissen, 2002, 2003; Venkataraman et al., 2008; Falk et al., 2016), but mostly using the coarser-resolution StripMap mode. Most research focuses on the re-trieval of snow water equivalent (SWE) and not so much on the detailed mapping of snow extent and melt patterns, topics which are very relevant to the geocryological community. In fact, research on high spatial-resolution mapping using mi-crowave imagery is rarely present in the literature. Malnes et al. (2014) tested the use of TerraSAR-X SpotLight mode, VV-polarization imagery for SWE retrieval in Svalbard us-ing ground-truth data obtained along transects, but in order to reduce speckle noise, the authors used a 10 m pixel reso-lution, thus losing detail. They have found a good capacity for SWE estimation in dry snow, but in wet snow, due to the complete absorbance of the radar signal in the top layers, the procedure did not work.
Climate scenarios indicate that the recent warming in the Antarctic Peninsula will be followed by an increase in precip-itation and possibly in snowfall (Thomas, et al., 2008; Steig et al., 2009; Winkelmann et al., 2012; Barrand et al., 2013). The significance of these changes for the geomorphological and ecological dynamics of the ice-free areas has not been yet evaluated. However, since the western Antarctic Peninsula, and especially the South Shetlands, shows mean annual tem-peratures just slightly below 0◦C at sea level, the region will most probably suffer significant effects, particularly in snow cover and on the distribution and extent of late-lying snow patches. Mapping of snow patches and monitoring melting patterns, as well as interannual changes, are therefore key for evaluating the changes in the ice-free environment, e.g. for permafrost, nivation and ecological research, but also for re-search infrastructure management.
This paper deals with evaluating the potential of TerraSAR-X (X-band) imagery acquired in SpotLight mode, to map summer snow-patch distribution with a spatial reso-lution close to 1 m in the maritime Antarctic. Spatial moni-toring of snow cover and snowmelt has proven to be a very difficult task in the region (Mora et al., 2013; de Pablo et al., 2016) and the methodology proposed here aims at bridg-ing this gap and is a step towards makbridg-ing an implementation in operational mode available to the terrestrial ecosystems and permafrost research community working on the western Antarctic Peninsula. For the purpose of testing and validat-ing, we have selected a field site on Fildes Peninsula (King George Island, South Shetlands archipelago).
2 Test site
The Meseta Norte is a mesa-like relief in the north-eastern part of Fildes Peninsula, King George Island (KGI),
lo-Figure 1. Location and topography of Fildes Peninsula and the Meseta Norte test site.
cated in the South Shetlands, off the northern tip of the Antarctic Peninsula (Fig. 1). KGI is the largest island in the archipelago and about 90 % of its surface (1250 km2)is glaciated, with Fildes Peninsula (62◦120S, 58◦580W) being one of the largest ice-free areas of the South Shetlands with 29 km2(Peter et al., 2008). Landforms are dominated by two high structural volcanic platforms (Meseta Sul, 167 m a.s.l. at Promontório Schenke; and Meseta Norte, 155 m a.s.l. at Cerro San Francisco). Low-lying planation surfaces occur between and around them, especially in the northern part of Fildes Peninsula, with altitudes below 50 m a.s.l.
The study site is located in the Meseta Norte, a plateau bounded by steep slopes with a slightly depressed central area at 100–120 m a.s.l. and a series of small plateaus and scarps (Simonov, 1977; Smellie and López-Martínez, 2002; Fig. 2). Small lakes occur in the interior of the Meseta, an area which stays almost completely snow free in late sum-mer, except for a few perennial snow patches. Vegetation is sparse with rocky outcrops and loose clastic material dom-inating the landscape. The lower areas are the ones where vegetation cover is more frequent, especially at present or past faunal colonies (Michel, 2011).
The climate is polar oceanic, with an average annual air temperature at sea level of −2◦C, summer temperature of 3◦C, and winter temperature in August of −7◦C. Annual precipitation ranges between 350 and 500 mm (Øvstedal and Lewis-Smith, 2001), but data from Bellingshausen station
Figure 2. Topographical setting of the Meseta Norte test area on Fildes Peninsula with the ground truthing mapped in the field. Snow patches are numbered as in the paper.
show records of 700 mm, part of which occurs during the summer as rainfall events.
The Meseta Norte was selected as a site representative of maritime Antarctic conditions due to its climate, lack of veg-etation and fast snowmelt rates during the summer, with fre-quent late-lying snow patches. The area also shows morpho-logical diversity allowing us to better assess the spatial vari-ability of the backscatter signal across a variety of slope
an-Figure 3. Methodology for the evaluation of the potential of Spotlight mode TerraSAR-X imagery for high-resolution snow cover mapping.
gles and aspects. The presence of lakes and snow-free clast-covered surfaces allowed both for improving geocoding of the TerraSAR-X scenes and for ground truthing.
3 Methodology
The methodological framework followed in the paper is shown in Fig. 3 and consists of (i) a detailed field survey of snow cover characteristics (ground truthing), (ii) SAR im-agery analysis (remote sensing) and (iii) evaluation of classi-fication methods.
3.1 Field characterization of the snow cover
In order to obtain high-quality ground-truthing data, in Jan-uary 2012 a field campaign was conducted on Fildes Penin-sula which aimed to characterize the snow cover at the time of remote sensing imagery acquisition. The area of the Meseta Norte was selected, accounting for its variable to-pography and facilitated access from the Chilean Antarctic station, Professor Julio Escudero. Twelve snow patches with
varied slope angle and aspect were mapped and snow pits were dug to describe snow characteristics, with observations taking place on 11 January 2012 (Fig. 4). In cases where slush was present, we excluded the area from the snow-patch boundary surveying and in very large snow patches, only par-tial ground truthing was conducted.
Snow pits were dug either down to bedrock, or to depths where thick (> 3–5 cm) and difficult to penetrate ice layers occurred. The focus was on the upper 25 cm of the snow pack due to its sensitivity to the propagation of the X-band radar signal. Each of the snow pits was described for snow stratigraphy, grain size and shape and snow density. Perva-sive moisture in all snow pits showed that snow was wet.
Grain size was measured by carefully collecting small amounts of snow from each of the layers of the snow pack and depositing them in a black tissue for contrast. They were then observed with a 10x magnifier, which allowed for mea-suring and describing the grain shape and size. Grain size (or crystal size) showed variability within each layer and our description encompasses the mean grain sizes. When vari-ability was large, we added the more frequent dimensions
Figure 4. Overview of the snow conditions in the sampled snow patches during the field survey in the Meseta Norte in January 2012.
(i.e. 1–2 mm). Snow density was measured by carefully col-lecting snow from each snow layer without disturbing the snow pack, using a metal box with a volume of 212 cm3. From each layer, three samples were collected, adding up 636 cm3, which were inserted in a dry plastic sampling bag and weighted using a digital spring scale, and mass converted to density. Snow moisture content by volume was not mea-sured.
Due to a failure in the thermometer, no temperature depth profiles were measured. As a workaround, ibutton DS1922L single-channel temperature miniloggers were installed at shallow depth (ca. 5 cm) near each snow pit, inside 50 mm cylindrical white plastic photographic film cases. Snow tem-perature was recorded at 1 h intervals during a period of sev-eral days, which included the dates of satellite imagery ac-quisition. Fast snowmelt and the high radiation absorption of the cases induced extraordinary diurnal heating inside the cases and daily maximum temperatures were abnormal, thus could not be used to accurately describe snow temperature. Surface melting also induced surfacing of the miniloggers, which had to be reinserted into the snowpack in the morning. Mean daily air temperature data were obtained for the Rus-sian Weather Station of Bellingshausen from NNDC/NCDC Climate Data Online (NOAA) and was used for a general characterization of the days of image acquisition.
In order to improve geocoding and for a better analysis of the radar imagery, the boundaries of several snow patches were mapped using a Leica Viva Differential Global Po-sitioning System (DGPS) in Real Time Kinematic (RTK) mode with a local base station and a rover, allowing for an accuracy of ca. 2 cm for each GPS point. Lake boundaries for improving georeferencing of the satellite images and ground truthing of water surfaces, as well as bare-soil areas (mainly frost-shattered debris), were also mapped with DGPS. 3.2 SAR imagery processing
Three TerraSAR-X SpotLight SSC (Single Look Slant Range Complex) mode scenes were acquired. SSC products offer a single look of the focused radar signal, with a scene size of 10 × 5 km. The requested bandwidth was 300 MHz (ex-perimental mode), offering a range spacing of 0.455 m and azimuth spacing of 0.855 m. Table 1 includes additional pa-rameters of the images.
Since the goal was to evaluate the discriminating potential of TerraSAR-X for very high-resolution mapping of snow cover, two scenes were acquired for the summer season on 12 and 13 January 2012, the former in HH and the latter in VV polarization (Table 1). These dates coincided with the ground-truthing campaign. An additional early spring scene (28 September 2012, HH polarization) was used in order to assess the backscattering for dry-snow conditions. The re-sults presented in this paper respect the area of the Meseta Norte, corresponding to the field validation area, which is a subsector of the larger TerraSAR-X scene.
The typical speckle noise (salt and pepper), present in radar images due to the constructive and destructive elec-tromagnetic interference associated with the scatter, implies choosing an adequate filtering phase to each specific area, compensating for the noise or emphasizing textures. In this case, Lee filtering with a 9 × 9 window was used to improve the contrast. Calibration to sigma, beta or gamma nought in the radiometric correction phase transfers the digital level captured by the sensor to the radar backscattering signal (dB) of the reflecting surface (Valenti et al., 2008; Small, 2011), allowing us to compare images acquired in different time lapses and modes. In this study all the calculations were per-formed with sigma nought calibration.
Geocoding and terrain correction of the scenes were performed using ranging Doppler analysis and an exter-nal digital elevation model of 5 m resolution derived from the Chilean Antarctic Institute topographical map of Fildes Peninsula. This procedure detects geometrical deformations of the original scene due to the off-nadir swapping. Geomet-ric distortions such as layover and shadowing are therefore compensated for in the final product. Image processing was conducted using the ESA SNAP 3.0 software.
Table 1. Characteristics of the TerraSAR-X scenes used for snow mapping on Fildes Peninsula.
Date Time (UTC) Orbit cycle Pass Incident angle (◦) Polarization
12 Jan 2012 23:32:59 153 Ascending 45.626 HH
13 Jan 2012 23:15:59 153 Ascending 29.875 VV
28 Sep 2012 8:39:59 176 Descending 25.259 HH
3.3 Production and validation of snow cover maps In order to assess the discriminating potential of TerraSAR-X imagery for high-resolution mapping of wet-snow distri-bution, we have first characterized the backscattering sig-nal of the three selected scenes in the ground-truthing areas. For this purpose, the field-mapped boundaries of the snow patches, lakes and bare soil were integrated in a GIS, first as a point layer and then transformed into polygons. Backscat-tering at the ground-truthing areas was retrieved for the three scenes and analysed in order to identify differences in polar-ization modes and respective potential for the three surface types. Statistical analyses were conducted to detect backscat-tering similarities between snow patches and to compare with their topographical setting and snow characteristics obtained from the pits.
The previous approach allowed for the identification of backscattering thresholds for the different surfaces and these data, together with ground-truthing, were used to test three mapping approaches: (i) simple threshold-based surface clas-sification mapping, (ii) ratio-based mapping using a dry-snow and wet-dry-snow scene, and (iii) object-oriented mapping. The results of the three classifications are then evaluated by comparison with the reference data.
For extracting the feature values and training the classi-fiers, we have used a random sample set of half of the ground-truthing area obtained in the field survey for snow patches, lakes and bare soil and the other half to make the validation of the classification.
4 Results
4.1 Snow characteristics
Twelve snow pits were dug in different snow patches to depths between 45 and 70 cm, at altitudes from 86 to 117 m, at different aspects, located within an area of ca. 0.6 km2 (Fig. 4). Snow surface was generally wet and the downslope concave sectors of several snow patches showed ponding and slush with pervasive percolation. Snow-patch sizes were from tens to hundreds of metres wide and the slope angle in the sample patches varied from 6 to 34◦. Typically, snow pits showed rounded snow grains with melting and frequently clusters of rounded grains (Fig. 5). Grain size was typically 2 to 4 mm, with grain clusters reaching 40 mm. Compact hor-izontal ice layers from 2 to 5 cm thick were present in most
snow pits. South and south-easterly snow pits showed thicker snow layers and ice layers were generally absent. North- and north-west-facing snow patches showed more ice layers, up to 5 in snow pit (SP) no. 1. Vertical and horizontal discontin-uous refreezing structures revealing percolation in the snow pack were found especially in NW to SE snow patches, nor-mally below 50 cm depth. Snow density ranged from 470 to 600 kg m−3 and aspects from east to south showed denser snow packs on average (Fig. 6).
4.2 Snow-patch and air temperatures
Snow-patch subsurface temperatures at 5 cm depth on 12 and 13 January 2012 showed ca. 0◦C at all monitored sites between about 23:00 (ci. 20:00 LST) and 07:00 UTC (ca. 03:00 LST) (Fig. 7), corresponding to the period when the sun was very low or below the horizon. As explained in the methodology, the packaging of the logger induced extreme heating during the day, with temperatures reaching +16◦C inside some cases. Differences in maxima between snow patches reflected aspect, but diurnal regimes were similar, showing that there was a clear homogeneous signal, also re-producing variability in cloudiness, with synchronous local daytime minima at all sites. Despite the heating problems, the data confirm that, during the days of satellite imagery ac-quisition, the snow conditions were always close to 0◦C at
all times and that, even during the night, cooling was small, a fact probably related to the high snow wetness already de-tected in the snow pits that limited refreezing. The high di-urnal temperatures reflect anomalous conditions inside the logger cases. At the snow surface, latent heat of melting as-sociated with high moisture in the snow pack buffered warm-ing, maintaining the snow surface at the melting point. Such conditions are typical of the maritime Antarctic, where the daily air temperature range is within a few degrees Celsius due to the oceanic influence, supporting limited refreezing conditions during the night. For example, Byers Peninsula in Livingston Island shows a typical summer mean daily tem-perature range of 3.0◦C (Bañon et al., 2013). The analysis of mean daily air temperature data from the weather station of Bellingshausen, located about 1 km from the site, show that mean temperatures ranged between 1.3 and 1.7◦C from 11
Figure 5. Snow pit description for the studied snow patches on Fildes Peninsula.
4.3 Surface backscattering
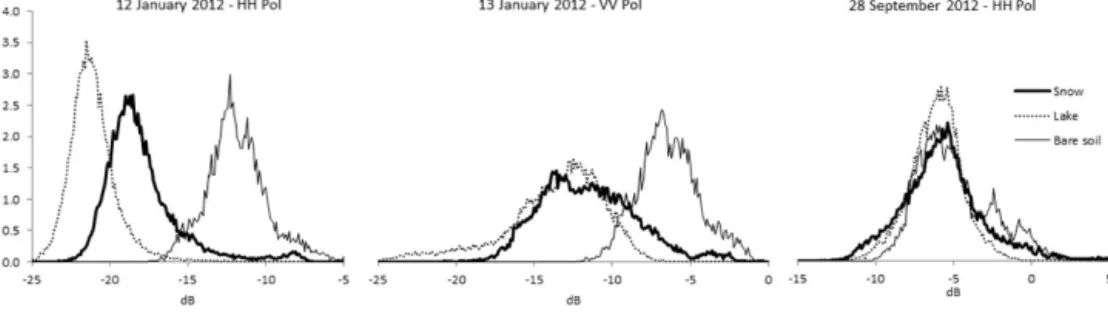
The three TerraSAR-X scenes (HH – summer, VV – sum-mer, HH – early spring) show different discriminating poten-tial for snow cover when compared to bare ground and open water surfaces (Fig. 9).
The summer HH-polarization scene showed the best sep-arability between the three cover types, with statistically significant differences and clear curves peaking at differ-ent backscattering values. Snow peaks between bare soil and water with an average of −18.0 dB (standard de-viation – SD = 2.5 dB). Bare soils show an average of −11.9 dB (SD = 2.0 dB) and water an average of −21.1 dB (SD = 1.6 dB) (Table 1).
The summer VV-polarization scene shows no discriminat-ing capacity, with a complete mixture between snow and wa-ter, with average values of −11.6 and −13.7 dB respectively. Soil shows higher average backscattering (−6.4 dB), but still overlaps with the former and especially with snow.
The early spring scene of 28 September 2012 was selected for analysis due to the full snow cover conditions and for preceding the onset of snowmelt conditions, therefore repre-senting dry snow. This fact is confirmed by the mean air tem-peratures at Bellingshausen, which from 26 to 28 September varied between −3.8 and −1.6◦C (Fig. 8). The backscatter-ing values show a complete overlap of the signal of the three types of sampled areas, with average values from −5.0 to −6.2 dB and standard deviations of 1.7 to 2.6 dB). This con-firms that the sites are covered by a similar type of snow. Sec-ondary peaks in the soil sample areas at −2.4 and −0.7 dB suggest snow-free surfaces.
4.4 Wet snow-patch backscattering characteristics The HH polarization scene of 12 January 2012 provided the best results for snow-patch discrimination and therefore was selected for further analysis and classification. The backscat-tering for individual snow patches shows significant differ-ences, with average dB ranging from −9.0 in SP2, to −19.8
Figure 6. Surficial snow density (kg m−3) according to aspect in the studied snow patches on Fildes Peninsula. Dashed line represents estimated values at NE and SW calculated by averaging between neighbouring orientations.
Table 2. Backscattering characteristics of the sampled snow patches, lakes and bare-soil areas. SD is standard deviation.
Bare soil Snow Water
(dB/SD) (dB/SD) (dB/SD) HH – summer −11.9/2.0 −18.0/2.5 −21.1/1.6 VV – summer −6.4/2.0 −11.6/3.1 −13.7/3.3 HH – spring −5.0/2.4 −5.7/2.6 −6.2/1.7
in SP13 (Table 2). Extreme values range from −4.4 dB in SP8 to −23.6 dB in SP13, with standard deviations from 1.0 dB in SP6 and 13 to 2.8 dB in SP4. These simple statistics show that, despite the quasi unimodal distribution (a small bump is visible at around −8 dB but may be an artefact) when considering all snow patches (Fig. 9), very significant differ-ences are found between them.
ANOVA analysis and Kruskal–Wallis non-parametric tests were conducted to identify groups of equivalent response to backscattering. An evaluation of correlation (p values 95 %) by multiple contrast range resulted in three groups (Table 3): (i) SP3 and SP12 (italics), (ii) SP5 and SP7 (bold), and (iii) the rest, corresponding to a heterogeneous group with no intercorrelation (between Fisher’s least significant difference and the Bonferroni correction). Figure 10 shows the snow patches ranked by increasing average backscattering and evi-dences their moderate to high dispersion when analysing the mean, median and standard deviation. In general, most snow
patches show a similar behaviour, with SP2 being the main outlier.
Figure 11a shows the lack of correlation between snow density and backscattering, both in the HH and VV scenes from January 2012. Figure 11b shows that at HH polariza-tion a weak positive correlapolariza-tion (R2=0.23, p < 0.14) exists between backscattering and snow grain size, which is espe-cially evident if removing snow patch no. 2, which shows an anomalously high mean dB of −9.0 (indicated as HH-pol outlier). If instead the average backscattering per grain size is calculated, then the correlation becomes clearer with R2=0.94 at p < 0.15.
4.5 Image classification
In order to evaluate the applicability of single-band HH-polarized data for wet-snow mapping we have tested sev-eral methods. An expert-based visual inspection of the HH backscattering sigma-nought scene allows for a rela-tively easy delimitation of wet snow patches by comparing greyscale values with feature shapes in the terrain evidencing the potential of the scene (Fig. 12). The purpose of this sec-tion is to confront pixel- and object-based classifiers, com-paring their performances and potentialities.
4.5.1 Classification using backscattering thresholds The best quality of the discrimination in the HH-polarization scene of 12 January, when compared to the VV scene of 13 January, led us to its selection for assessing the appli-cation of backscattering thresholds and band maths for the classification. This is the simplest way of evaluating the ap-plicability of the single-polarization backscattering signal to map wet snow. Since data have shown a significant overlap between the three classes, but especially between wet snow and water (see Fig. 9), no accurate threshold is able to dis-criminate between them. However, once the objective is dif-ferentiating wet snow from bare-soil surfaces, a valid option is using the threshold between these two classes, which may be defined using the average ± standard deviation for each class: wet snow from −20.5 to −15.5 dB and bare soil from −13.9 to −9.9 dB, while values below −20.5 dB are classi-fied as water. The results of this classification were identiclassi-fied as Threshold A. Since −20.5 dB is a frequent value for water at the ground-truth sites, a second classification was assessed moving the threshold to −19.5 dB, which is midway from the average of wet snow (Threshold B). In order to be able to properly evaluate the performance of the modelling, a ran-dom selection of 50 % of the ground-truth pixels was used to derive the backscattering thresholds and drive the classi-fication, and the other 50 % of pixels were used to compute the confusion matrix (Table 4). The large number of pixels in the ground-truthing produced very homogeneous statisti-cal results between the two sets, with maximum differences below 0.03 dB.
Figure 7. Snow-patch temperatures measured at 5 cm depth from 12 to 13 January 2012. The peaks in the maxima relate to anomalous overheating of the minilogger case. SP1–SP12 are the snow-patch numbers. SP13 was not monitored.
Figure 8. Mean daily air temperatures in 2012 in the Bellingshausen Station (NNDC/NCDC – NOAA). Arrows indicate the day with image acquisitions.
Both classifications provide a very good general assess-ments of wet snow cover distribution, but with the typical noise of pixel-based classifiers (Fig. 13). Most of the wet snow is classified correctly, or as water, but numerous pixels wrongly classified as snow are displayed as clumped patterns forming fuzzy clusters, with shapes not as clearly defined as the observed snow patches. The confusion matrix shows an overall accuracy of 81.0 % for Threshold A, and 81.1 % for Threshold B.
4.5.2 Classification using simple band maths
Differences in backscattering when comparing a snow scene with a snow-free scene, or with a dry-snow scene, have been used by several authors in order to classify ground conditions (Rott and Nagler, 1994; Nagler and Rott, 2000; Malnes et al., 2014). For this purpose, the HH-polarization scene from 28 September 2012 showing a fully snow covered terrain and dry snow was used as reference, while the HH-polarization scene from 12 January 2012 was the target scene for the clas-sification. Figure 13 shows that from the three studied sur-face types, bare soil is clearly differentiated from lakes, but wet snow shows a significant overlap with both lakes and
bare soils, which shows the same limitations as the threshold methods evaluated in panel a.
Another approach is the classification using a band ratio between the dry-snow scene and the wet-snow scene, aim-ing at detectaim-ing thresholds between surface classes (Nagler and Rott, 2000; Valenti et al., 2008). However, the ratio be-tween the HH-pol September and the HH-pol January scenes show very poor discriminating potential with significant mix-ing between the three surface types (Fig. 14). Given the poor results, no image classification for evaluation was attempted using simple band maths.
4.5.3 Classification using an object-oriented algorithm The pixel-based classifications produced limited results, with the threshold-based maps showing two different patterns of pixels classified as wet snow: homogeneous patches, with clearly defined limits, which mostly coincided with the ground-truthing snow patches, and small diffuse clusters of pixels, wrongly classified as wet snow. Given the differences in spatial patterns and the relatively straightforward manual delimitation of the wet snow by visual inspection on the im-agery, new classification tests were conducted using an
algo-Figure 9. Radar backscattering of snow, water and soil ground-truthing areas for the three selected TerraSAR-X scenes: (a) HH polarization (12 January 2012), (b) VV polarization (13 January 2012) and (c) HH polarization (28 September 2012).
Table 3. Snow-patch characteristics and backscattering in HH polarization (12 January 2012). Italics indicate the members of group 1 and bold indicates the members of group 2. All other snow patches are integrated into group 3.
Backscattering (dB) Surface (0–5 cm) Subsurface (5–10 cm)
Snow Mean SD Max Min Slope Aspect SWE Grain Size Density Ice Grain Size Density Ice
patch (◦) (cm) (mm) (kg m−3) layer (mm) (kg m−3) layer
3 −18.2 1.3 −14.1 −22.0 15 N360 4.7 3 472 no 2 487 yes 12 −18.2 1.8 −8.2 −22.7 9 N130 5.5 4 550 no 4 519 no 5 −18.8 1.1 −14.9 −23.0 20 N10 4.7 3 472 no 4 487 no 7 −18.8 1.4 −14.8 −23.5 8 N290 4.6 3 456 no 2 487 yes 1 −15.0 1.8 −9.2 −19.6 11 N270 4.7 3 472 no 4 487 yes 2 −9.0 1.4 −4.5 −14.9 34 N270 5.0 2 503 no 4 550 yes 4 −16.2 2.8 −8.0 −20.7 20 N180 4.7 4 472 yes 3 519 yes 6 −19.6 1.0 −13.6 −22.8 9 N130 4.7 2 472 yes 1 550 no 8 −17.8 1.8 −4.4 −21.6 6 N170 5.2 2 519 no 2 519 yes 10 −18.5 1.6 −13.2 −23.4 8 N70 6.0 3 597 no 1–2 597 no 11 −17.2 1.6 −13.1 −21.4 10 N280 5.2 3 519 yes 3 519 yes 13 −19.8 1.0 −16.6 −23.6 20 N120 5.2 2 519 yes 2 550 no
Figure 10. Box and whisker plots of backscattering of individual snow patches in the HH polarization scene from 12 January 2012.
rithm which is object-oriented and constituted by three main processing steps: filtering, segmentation and classification.
The filtering intends to attenuate the speckle of the radar image in order to enhance the spatial coherence of the im-age texture or of the structures of the surface. To achieve this goal, a series of mathematical morphology-based filters were tested (Soille, 2004). These are region-based filters, which
rely on the reconstruction of a “classic” filter, i.e. by open-ing or closopen-ing (Salembier and Wilkinson, 2009). The filter that performed better is based on the removal of the image extrema with a contrast criterion, that is, on suppressing all maxima and minima with height/depth lower than a given threshold level h (Soille, 2004): this value was fixed at 10 % of the backscattering range of variation on the whole HH scene. The output of this filter is shown in Fig. 15a, where the structures of the landscape are now more evident than in the initial image.
The segmentation consists of delineating the homoge-neous regions, often referred to as objects (Blaschke, 2010), of the filtered image. The underlying idea is to classify the basic elements of the texture (the objects) later instead of the basic elements of the digital image (the pixels), since the availability of additional descriptors of the image can greatly improve the decision performance. The segmentation is based on the watershed transform (Soille, 2004), followed by a post-processing task to merge similar adjacent regions. The final watershed lines corresponding to the segmentation of the filtered image are shown superimposed in Fig. 15b.
Figure 11. Scatter plots of snow density (a) and snow grain size (b) with backscattering for the studied snow patches.
Table 4. Performances for the three tested classifications. Classification Threshold A: backscattering threshold water – wet snow at −20.5 dB, Classification Threshold B: backscattering threshold water – wet snow at −19.5 dB, and Object-oriented approach. Producer accuracy mea-sures the errors of omission (pixels correctly classified as a percentage of the total number of pixels that belong to that class). User accuracy measures the errors of commission (the number of correctly classified pixels compared to the total number of pixels assigned to that class).
Thresholds A Thresholds B Object-oriented
Prod. Acc. (%) User Acc. (%) Prod. Acc. (%) User Acc. (%) Prod. Acc. (%) User Acc. (%)
Wet snow 85.2 72.1 66.8 82.3 87.49 95.11
Water 73.7 91.3 88.8 80.2 95.16 100.0
Bare soil 96.3 81.8 96.3 81.8 100.0 69.65
Overall accuracy (%) 81.0 81.1 92.36
Kappa 0.69 0.68 0.88
Figure 12. TerraSAR-X SpotLight mode HH polarization backscat-tering (sigma-nought) scene from 12 January 2012 with examples of visual interpretation of bare ground (BG), water (W) and snow patches (SP). Contour lines at 5 m equidistance.
Finally, in the third step, the classification of the seg-mented objects is performed. It is a supervised classifica-tion approach, meaning that typical features of the objects are used to train a classifier. In the current situation, the
classi-fier that achieved better results is the support vector machine (SVM). SVM is a supervised kernel method (Vapnik, 1995) that uses an implicit transformation to a higher dimensional space in order to achieve a good separability by means of a linear classifier. It also has the ability to handle data with un-known statistical distributions using small training sets. The classification of the segmented objects is based on a set of in-tensity, geometric and textural descriptors of each object. The SVM kernel selected is the RBF (radial basis function) with the parameters gamma = 0.03 and C = 1000. The classified image of the study site is shown in Fig. 16. The good visual agreement between the classified image and the input radar image already indicates how well the classifier performed.
The confusion matrix shows the good quality of the clas-sification, with an overall accuracy of 92 % and Kappa equal to 0.88 (Table 3) (Congalton, 1991), indicating the adequacy of the proposed method to separate water, snow and soil in radar images of ice-free regions in maritime Antarctica. The integration into the same processing sequence of some of the most appropriate filters to deal with the spatial arrangement of textures, the a priori delineation of the objects constituting the landscape and the use of one of the most robust classi-fiers, are the keys for the performances obtained. The only issues in the classification arise in snow patches facing west
Figure 13. Classification results using (a) backscattering threshold water with wet snow at −20.5 dB, (b) backscattering threshold water with wet snow at −19.5 dB.
Figure 14. Discrimination of wet snow, bare soil and water using simple band maths: (a) difference between the dry-snow scene (28 Septem-ber 2012, HH Pol) and target scene (12 January 2012), (b) band ratio between the dry-snow scene and the target scene.
Figure 15. Initial steps on the object-oriented classification scheme: (a) filtered image by suppression of its extremes values with a con-trast criterion (mathematical morphology h-max and h-min opera-tors), (b) detail of the segmentation by watershed with the delin-eation of the objects of the filtered image.
to north-west, where a significant part of the area was classi-fied as bare soil.
5 Discussion
Snow characteristics in the Meseta Norte at Fildes Penin-sula on 12 and 13 January 2012 have been described by field mapping of test snow patches and by analysing snow pits.
Snow distribution showed a typical maritime Antarctic sum-mer melt pattern with snow patches from tens to hundreds of metres long, concentrating on concavities and prevailing on south-facing slopes. The snow was in advanced melting stage, with isothermal near 0◦C temperatures even during the night, showing the delay effects of latent heat exchange dur-ing freezdur-ing. The downslope sectors of several snow patches showed ponding and saturated slush. Snow pits down to ca. 70 cm showed that grain size was generally 2–4 mm and crys-tals showed melting with frequent clustering evidencing ad-vanced metamorphism and warm conditions (Braun, 2001). Snow pits revealed frequent ice layers associated to melting events, refreezing and new snow accumulation. Such ice lay-ers were more frequent in snow patches facing NW to SE, while south-facing snow patches rarely showed ice layers. This pattern reveals the effects of insolation and possibly warm air advection on snow stratigraphy and the significance of snowmelt events during the snow accumulation season. Snow densities agree with the relatively mild climate of the region, with high values ranging from 470 to 600 kg m−3, close to the typical late melting season 350 to 550 kg m−3 indicated by Dewalle and Rango (2008).
Figure 16. Distribution of wet snow in the Meseta Norte using an object-oriented classification with SVM (support vector machine).
X-band radar backscatter is essentially influenced by the characteristics of the upper 15 cm of the snow pack (Rees, 2006; Rott et al., 2013). Near the surface, most of the snow patches showed a lack of ice layers, coarse-grained snow and high densities, ranging from 470 to 600 kg m−3. Despite the limitations induced by the abnormal heating of the temper-ature minilogger cases, the data show that only minor cool-ing occurred durcool-ing the short summer night, with limited re-freezing, while the daily maxima reflect the overall snowmelt conditions affecting the area. The high moisture of the snow pack should have limited the refreezing below the surface, thus buffering changes in snow metamorphism when com-pared to the timing of snow pit observation. Unfortunately, the poor set-up of the miniloggers completely limits the use of the diurnal temperature records.
Backscattering depends on the dryness of the snow, on the incident angle and on the roughness of the surface. The HH polarization scene showed a better discriminating poten-tial between wet snow, bare soil and water than the VV-pol scene, which completely merged the water and snow signals, while also showing important overlap with bare soil. These results agree with those presented by other authors, which have also found better results for snow cover classification when using HH-polarization scenes in C-band (Baghdadi et al., 1998; Mora et al., 2013). Holah et al. (2005), in a case study on soils using in C-band and multiple incidence an-gles, also show that HH provided higher sensitivity to surface
roughness than VV. Additionally, VV-polarization is more sensitive to water roughness changes. The differences in in-cident angle between the HH (45.6◦) and VV (29.8◦) scenes in our study, with the higher values of the former resulting in improved backscattering resolution and classification ef-ficiency (Woodhouse, 2006), may have also played a role in the differences between the scenes. Therefore, for an accu-rate comparison of the different discriminating potential of both polarizations, two scenes with similar incidence angles should be used.
Snow backscattering in the HH-pol scene of 12 January 2012 showed values from −4.4 to −23.6 dB, with a mean of −18.0 and a standard deviation of 2.5. The mean value is in agreement with the wet-snow signal from other regions, as described by Shi and Dozier (1997) (−5 to −20 dB) and in range with the experimental margin described by Ulaby and Stiles (1981). The minimum was measured at SP2, with an average slope angle of 34◦, which was probably not well resolved with the digital elevation model (DEM).
Given the limitations of the VV-pol scene, the HH-pol scene was selected to test the use of single-band classifica-tion methods for identifying wet snow. The results showed a significant overlap between the signature of wet snow and lake water. Wet snow showed higher dB and visual inspection shows that spatial distribution of values in snow patches is more uniform, whilst lakes show higher speckle. The mixed signal between wet snow and water generates a large
num-ber of errors when conducting a pixel-based image classi-fication, with numerous pixels classified as water in slope sites where bare soil occurs and a significant mix of snow and water. One of the reasons for the poor discrimination po-tential is the high moisture content of snow, and another is the high moisture of soils during the summer, with saturation occurring in many locations. The tests carried out with sim-ple thresholds and band maths did not provide robust results. However, the threshold-based maps allow for identifying the snow patches, although with significant noise and too much snow in bare-soil areas.
Supported by the visual inspection of the HH-polarization scene and with the terrain-based expert knowledge suggest-ing that snow-patch boundaries could be easily identified in the scene, an object-oriented approach was tested as an alter-native to the limited performing pixel-based methods. Filter-ing and image segmentation were important steps for clean-ing the noisy areas and the classification results improved very significantly, with an overall accuracy of 92 %. The sulting classification was very good. Noisy areas were re-moved and a very good overall performance was obtained.
Problems occurred in snow patches facing north-west, which have been misclassified as bare soil. This problem has also been found when analysing the VV-polarization scene and is probably related to artefacts associated with the ge-ometry of acquisition, along a right-looking ascending or-bit. Slope and aspect effects on backscattering have been assessed by different authors to develop geometric correc-tions (e.g. Mi et al., 2014; Small et al., 2010). Here, we have adopted a simple but robust approach through Range Doppler Terrain Correction, taking into account the advantage of a 5 m digital elevation model. In this procedure, the incidence angle and terrain slope are both considered in the absolute radiometric calibration to sigma nought in ESA-SNAP soft-ware (Kellndorfer et al., 1998), and in the subsequent phase of Range Doppler Terrain Correction. Using imagery show-ing multiple SAR incident angle backscattershow-ing responses and both ascending and descending passes would be the best approach to inferring a more complete radiometric perfor-mance of the terrain signal and is recommended for regional-izing the results. Unfortunately, in this case only two scenes were available. The synergistic use of an ascending and a de-scending scene with a short time interval (1 day) should also be an adequate option to better identify the snowmelt patterns and fill the spatial gaps.
Although showing good classification results due to the low backscattering in the analysed scenes, under strong winds, the water bodies may show high brightness due to Bragg scattering, making them difficult to distinguish from snow. In order to avoid this issue, a lake mask obtained ei-ther from a windless scene or from an optical scene or map may be used.
6 Conclusions
TerraSAR-X imagery shows clear advantages in high cloudi-ness environments when compared to optical images, since the radar signal traverses the cloud cover and is not depen-dent on daylight. However, the radar signal structure is very dependent on the topography and the dielectric variables of the terrain and, in the case of the snow, on grain size and the equivalent snow water, implying a large variability in backscattering according to local factors and time. The use of Single Look Slant Range Complex (SSC) images permitted a sophisticated terrain correction, reducing layover and shad-owing effects with a precise external DEM. The High Reso-lution Spotlight Mode and a refined speckle filtering proved to be useful for determining the limits of snow patches, which were validated with terrain data.
In the present study we conducted a very detailed survey of snow conditions over 2 days in the austral summer of 2012, with simultaneous acquisition of two TerraSAR-X scenes in SpotLight mode in HH and VV polarization modes, and a third HH polarization scene was obtained in 28 September 2012 as a reference dry-snow scene. Snow patches were in advanced melting stage, with wet and coarse-grained snow at all studied sites and ponding in the downslope sectors of some snow patches. As a consequence of snowmelt, and also of active layer thaw, the bare soils of Fildes Peninsula showed significant moisture content.
The analysis of the TerraSAR-X scenes and the compari-son with ground-truthing from snow patches, lakes and bare-soil test areas showed that the only scene with potential for discrimination of the three surface classes was the one ob-tained with HH polarization. The lack of quality of the VV scene may have been emphasized by the low incidence angle of the acquisition. Despite different average backscattering in the HH scene, significant mixing still occurred between the three classes. With the objective of mapping wet-snow distribution, we tested single-band pixel-based classification methods and an object-oriented approach. After several tests with the latter, this has proven to be the one providing best classification results, with overall accuracies of 92 %. Some inaccurate classifications were obtained in north-west- to west-facing snow patches, and especially in steeper slopes. The reason for this is probably associated with the geometry of image acquisition and further research is needed to miti-gate this issue.
The method presented here, using SpotLight mode im-agery together with detailed synchronous reference data, of-fers a very high-resolution mapping of snow patches in the maritime Antarctic for the first time, allowing us to identify features on a scale of a few metres. Given the lack of knowl-edge of snowmelt in the ice-free terrains of the Antarctic Peninsula, the present results show that X-band imagery in HH-pol and with a high incident angle, can be used as a good approach for monitoring snowmelt patterns during the sum-mer in key areas. Such an approach is especially useful for
monitoring ecosystem dynamics (i.e. at GTN-P, CALM-S or LTER observatories), modelling permafrost and active layer thaw, but also for remotely assessing snow conditions be-fore opening summer research stations and thus implement-ing better plannimplement-ing for deployimplement-ing equipment and personnel.
7 Data availability
The remote sensing imagery used belong to the Ger-man Aerospace Center (DLR) acquired in the frame-work of the contract VIEIRA_LAN1276 and cannot be made available by the authors. Image references are TDX1_SAR_SSC_HS_S_SRA_20120112T233259_ 20120112T233300, TDX1_SAR_SSC_HS_S_SRA_ 20120113T231558_20120113T231559 and TSX1_SAR_ SSC_HS_S_SRA_20120928T083959_20120928T084000.
Competing interests. The authors declare that they have no conflict of interest.
Acknowledgement. This research has been funded by the Por-tuguese Polar Programme and the Fundação para a Ciência e a Tec-nologia under the projects SNOWCHANGE and PERMANTAR-3 (PTDC/AAG-GLO/3908/2012). Imagery was obtained through the DLR TerraSAR-X project LAN1276. The authors warmly thank the Instituto Antártico Chileno for the logistical support provided at Professor Julio Escudero research station on Fildes Peninsula. Christian Haas, John Yackel, an anonymous referee and Marco Jorge are thanked for the comments and insights, which contributed to clarifying the final version of the manuscript.
Edited by: C. Haas
Reviewed by: J. Yackel and one anonymous referee
References
Alia, S. T., Akerley, J., Baluyuta, E. C., Cardiffa, M., Davatzes, N. C, Feigl, K. L., Foxall, W., Fratta, D., Mellors, R. J., Spielman, P., Wang, H. F., and Zemach, E.: Time-series analysis of surface de-formation at Brady Hot Springs geothermal field (Nevada) using interferometric synthetic aperture radar, Geothermics, 61, 114– 120, 2015.
Baghdadi, N., Gauthier, Y., and Bernier, M.: Capability of multi-temporal ERS-1 SAR data for wet-snow Mapping, Remote Sens. Environ., 60, 174–186, 1997.
Baghdadi, N., Livingstone, C. E., and Bernier, M.: Airborne-Band SAR Measurements of Wet Snow-Covered Areas, IEEE T. Geosci. Remote, 36, 1977–1981, doi:10.1109/36.729371, 1998. Baghdadi, N., Fortin, J.-P., and Bernier, M.: Accuracy of wet snow
mapping using simulated Radarsat backscattering coefficients from observed snow cover characteristics, Int. J. Remote Sens., 20, 2049–2068, 1999.
Bañon, M., Justel, A., Velázquez, D., and Quesada, A.: Regional weather survey on Byers Peninsula, Livingston Island, South Shetland Islands, Antarctica, Antarct. Sci., 25, 146–156, 2013. Barboux, C., Strozzi, T., Delaloye, R., Wegmuller, U., and
Col-let, C.: Mapping slope movements in Alpine environments using TerraSAR-X interferometric methods, ISPRS J. Photogramm., 109, 178–192, 2015.
Barrand, N. E., Vaughan, D. G., Steiner, N., Tedesco, M., Kuipers Munneke, P., van den Broeke, M. R., and Hosking, J. S.: Trends in Antarctic Peninsula surface melting conditions from obser-vations and regional climate modeling, J. Geophys. Res.-Earth, 118, 315–330, doi:10.1029/2012JF002559, 2013
Bernier, M., Fortin, J.-P., Gauthier, Y., Gauthier, R., Roy, R., and Vicent, P.: Determination of Snow Water Equivalent using RADARSAT SAR data in eastern Canada, Hydrol. Process., 13, 3041–3051, 1999.
Betbeder, J., Rapinel, S., Corgne, S., Potier, E., and Hubert-Moy, L.: TerraSAR-X dual-pol time-series for mapping of wetland vege-tation, ISPRS J. Photogramm., 107, 90–98, 2015.
Blaschke, T.: Object based image analysis for remote sensing, IS-PRS J. Photogramm., 65, 2–16, 2010.
Braun, M.: Ablation on the ice cap of King George Island (Antarc-tica), Doctoral thesis at the Faculty of Earth Sciences Albert-Ludwigs Universitat Freiburg, Germany, 165 pp., 2001. Brown, I. and Ward R.: The influence of topography on snowpatch
distribution in southern Iceland: a new hypothesis for glacier formation?, Geogr. Ann. A, 78, 197–207, doi:10.2307/521040, 1996.
Bühler, Y., Adams, M. S., Bösch, R., and Stoffel, A.: Mapping snow depth in alpine terrain with unmanned aerial systems (UASs): potential and limitations, The Cryosphere, 10, 1075– 1088, doi:10.5194/tc-10-1075-2016, 2016.
Congalton, R. G.: A review of assessing the accuracy of classifica-tions of remotely sensed data, Remote Sens. Environ., 37, 35–46, 1991.
De Pablo, A., Ramos, M., Molina, A., Vieira, G., Hidalgo, M. A., Prieto, M., Jiménez, J. J., Fernández, S., Recondo, C., Calleja, J. F., Peón, J. J., and Mora, C.: Frozen ground and snow cover monitoring in the South Shetland Islands, Antarctica: Instrumen-tation, effects on ground thermal behaviour and future research, Cuadernos de Investigación Geográfica, doi:10.18172/cig.2917, 2016.
Dewalle, D. R. and Rango, A.: Principles of snow hydrology, Cam-bridge University Press, CamCam-bridge, UK, 428 pp., 2008. Erickson, T., Williams, M., and Winstral, A.: Persitence of
topo-graphic controls on the spatial distribution of snow in rugged mountain terrain, Colorado, United States, Water Resour. Res., 41, W04014, doi:10.1029/2003WR002973, 2005.
Falk, U., Gieseke, H., Kotzur, F., and Braun, M.: Monitoring snow and ice surfaces on King George Island, Antarctic Peninsula, with high-resolution TerraSAR-X time series, Antarct. Sci., 28, 135–149, doi:10.1017/S0954102015000577, 2016.
Green, K. and Pickering, C. M.: Vegetation, microclimate and soils associated with the latest-lying snowpatches in Australia, Plant Ecol. Divers., 2, 289–300, doi:10.1080/17550870903019275, 2009.
Hiemstra, C. A., Liston, G. E., and Reiners, W. A.: Observing, mod-elling, and validating snow redistribution by wind in a Wyoming upper treeline landscape, Ecol. Model., 197, 35–51, 2006.
Holah, N., Baghdadi, N., Zribi, M., Bruand, A., and King, C.: Poten-tial of ASAR/ENVISAT for the characterization of soil surface parameters over bare agricultural fields, Remote Sens. Environ., 96, 78–86, 2005.
Kellndorfer, J. M., Pierce, L. E., Dobson, M. C., and Ulaby, F. T.: Toward Consistent Regional-to-Global-Scale Vegetation Charac-terization Using Orbital SAR Systems. IEEE T. Geosci. Remote, 36, 1396–1411, doi:10.1109/36.718844, 1998.
König, M., Winther, J.-G., and Isaksson, E.: Measuring snow and glacier properties from satellite, Rev. Geophys., 39, 1–27, 2001. Koskinen, J. T. and Pulliainen, J. T.: The use of ERS-1 SAR data in snow melt monitoring, IEEE T. Geosci. Remote, 35, 601–610, 1997.
Longépé, N., Allain, S., Ferro-Famil, L., Pottier, E., and Durand, Y.: Snowpack characterization in mountainous regions using C-Band SAR data and a meteorological model, IEEE T. Geosci. Remote, 47, 406–418, 2009
Magagi, R. and Bernier, M.: Optimal conditions for wet snow de-tection using RADARSAT SAR data, Remote Sens. Environ. 84, 221–233, 2003.
Malnes, E. and Guneriussen, T.: Mapping of snow covered area with Radarsat in Norway, Proceedings to IGARSS, 24–28 June 2002, Toronto, Canada, 2002.
Malnes, E. and Guneriussen, T.: Comparison of Satellite SAR Based Snow Cover Area (SCA) Algortihms, EARSel workshop, 11–13 March 2002, Bern, Svitzerland, 2003.
Malnes, E., Hindberg, H., Eckerstorfer, M., and Farnsworth, W. R.: Comparison of field and synthetic aperture radar retrieval of snow water equivalent at Kapp Linne, Svalbard, Proceedings, In-ternational Snow Science Workshop, 29 September to 3 October 2014, Banff, Canada, 811–816, 2014.
Mi, L., Hoan, N. T., Tateishi, R., Iizuka, K., Alsaaideh, B., and Kobayashi, T.: A Study on Tropical Land Cover Classification Using ALOS PALSAR 50 m Ortho-Rectified Mosaic Data, Adv. Remote Sens., 3, 208–218, doi:10.4236/ars.2014.33014, 2014. Michel, R. F. M.: Classificação, cobertura vegetal e monitoramento
térmico da camada ativa de solos da Península Fildes, ilha Rei George e ilha Ardley, Antártica Marítima, PhD thesis, Federal University of Viçosa, Brazil, 2011.
Mora, C., Vieira, G., and Ramos, M.: Evaluation of Envisat ASAR IMP imagery for snow mapping at varying spatial resolution, Deception Island, South Shetlands – Antarctica, in: Antarctic Glacial and Periglacial Processes, edited by: Hambrey, M., Geo-logical Society, London, UK, doi:10.1144/SP381.19, 2013. Nagler, T. and Rott, H.: Retrieval of wet snow by means of
mul-titemporal SAR Data, IEEE T. Geosci. Remote, 38, 754–765, 2000.
Øvstedal, D. O. and Lewis-Smith, R. I.: Lichens of Antarctica and South Georgia. A Guide to their Identification and Ecology, Cambridge University Press, Cambridge, UK, 411 pp., 2001. Peter, H.-U., Buesser, C., Mustafa, O., and Pfeiffer, S.: Risk
assess-ment for the Fildes Peninsula and Ardley Island and the devel-opment of management plans for designation as Antarctic Spe-cially Protected or Managed Areas. German Federal Environ-ment Agency, Dessau, Germany, 2008.
Rees, W. G.: Remote Sensing of snow and ice, Taylor & Francis, Cambridge, UK, 2006.
Rees, W. S. and Steel, M.: Radar backscatter coefficients and snow detectability for upland terrain in Scotland, Int. J. Remote Sens., 22, 3015–3026, 2001.
Reis, A. R., Catalão, J., Vieira, G., and Nico, G.: Mitigation of at-mospheric phase delay in InSAR time series using ERA-interim model, GPS and MODIS data: application to the permafrost de-formation in Hurd Peninsula, Antarctica, Geoscience and Re-mote Sensing Symposium (IGARSS), 2015 IEEE International, 26–31 July 2015, Lisbon, Portugal, 3454–3457, 2015.
Rott, H. and Nagler, T.: Capabilities of ERS-1 SAR for snow and glacier monitoring in alpine areas, in: Proceedings of the Second ERS-1 Symposium: Space at the Service of Our Environment, Rep. ESA SP-361, 965–970, Hamburg, Germany, 1994. Rott, H., Müller, F., Nagler, T., and Floricioiu, D.: The imbalance
of glaciers after disintegration of Larsen-B ice shelf, Antarctic Peninsula, The Cryosphere, 5, 125–134, doi:10.5194/tc-5-125-2011, 2011.
Rott, H., Nagler, T., Prinz, R., Voglmeier, K., Fromm, Re., Adams, M. S., Yueh, S., Elder, K., Marshall, H.-P., Coccia, A., Imbembo, E., Schuttemeyer, D., and Kern, M.: AlpSAR 2012-13, A field experiment on snow observations and parameter retrievals With KU- and X-Band radar, in: Proceedings of the ESA Living Planet Symposium, 9–13 September 2013, Edinburgh, UK, ESA SP-722, 2-1392, 2013.
Salambier, P. H. and Wilkinson, M. H. F.: Connected operators, IEEE Signal Proc. Mag., 26, 136–157, 2009.
Schubert, A., Faes, A., Kaab, A., and Meier, E.: Glacier surface velocity estimation using repeat TerraSAR-X images: Wavelet-vs. Correlation-based image matching, ISPRS J. Photogramm., 82, 49–62, 2013.
Shi, J. and Dozier, J.: Inferring snow wetness using C-band data from SIR-C’s polarimetric Synthetic Aperture Radar, IEEE T. Geosci. Remote, 33, 905–914, 1995.
Shi, J. and Dozier, J.: Mapping seasonal snow with SIR-C/X-SAR in mountainous areas, Remote Sens. Environ., 59, 294–307, doi:10.1016/S0034-4257(96)00146-0, 1997.
Simonov, I. M.: Physical-geographic description of Fildes Penin-sula (South Shetland Islands), Polar Geography, 1, 223–242, 1977.
Small, D.: Flattening Gamma: radiometric terrain correction for SAR imagery, IEEE T. Geosci. Remote, 49, 3081–3093, 2011. Small, D., Miranda, N., Zuberbühler, L., Schubert, A., and Meier,
E: Terrain-corrected Gamma: Improved thematic land-cover re-trieval for SAR with robust radiometric terrain correction, Proc. “ESA Living Planet Symposium”, 28 June to 2 July 2010, Bergen, Norway, 2010.
Smellie, J. L. and López-Martínez, J.: Introdution to the geology and geomorphology of Deception Island, in: Geology and geo-morphology of deception island, edited by: López Martínez, J., Smellie, J. L., Thomson, J. W., and Thomson, M. R. A., BAS Geomap series, Cambridge: British Antarctic survey, Cambridge, UK, 1–6, 2002.
Soille, P.: Morphological image analysis, Principles and applica-tions, 2nd edition, Springer-Verlag, Berlin-Heidelberg, Germany, 2004.
Steig, E. J., Schneider, D. P., Rutherford, S. D., Mann, M. E., Comiso, J. C., and Shindell, D. T.: Warming of the Antarctic ice-sheet surface since the 1957 International Geophysical Year, Nature, 457, 459–462, doi:10.1038/nature07669, 2009.
Strozzi, T., Wegmiiller, U., and Matzler, C.: Using repeat-pass SAR interferometry for mapping Wet Snowcovers, Geoscience and Remote Sensing Symposium Proceedings, IEEE International, 6–10 July 1998, Seattle, USA, 3, 1650–1652, 1998.
Strozzi, T., Wegmuller, U., and Matzler, C.: Mapping wet snow-covers with SAR interferometry, Int. J. Remote Sens., 20, 2395– 2403, 1999.
Thomas, E., Marshall, G., and McConnell, J.: A doubling in snow accumulation in the western Antarctic Peninsula since 1850, Geophys. Res. Lett., 35, L01706, doi:10.1029/2007GL032529, 2008.
Thorn, C. E.: An introduction to theoretical geomorphology, Unwin Hyman., Boston, USA, 247 pp., 1988.
Ulaby, F. T. and Stiles, W. H.: Microwave response of snow, Adv. Space Res., 1, 131–149, 1981.
Valenti, L., Small, D., and Meier, E.: Snow cover monitoring us-ing multi-temporal ENVISAT/ASAR Data. Proc. of 5th EARSeL LISSIG (Land, Ice, Snow) Workshop, 11–13 February 2008, Bern, Switzerland, 2008.
Vapnik, V. N.: The nature of statistical learning theory, Springer-Verlag, Berlin, Germany, 1995.
Venkataraman, G. and Rao, K. S.: Application of SAR inter-ferometry for Himalayan glaciers, Proc. of Fringe Workshop, 28 November–2 December 2005, Frascati, Italy, 2005.
Venkataraman, G., Singh, G., and Kumar, V.: Snow cover area monitoring using multitemporal TerraSARX data, in: Third TerraSAR-X Science Team Meeting, DLR, 3 January 2008, Freiburg, Germany, 2008.
Vieira, G., Bockheim, J., Guglielmin, M., Balks, M., Abramov, A. A., Boelhouwers, J., Cannone, N., Ganzert, L., Gilichinsky, D. A., Goryachkin, S., López-Martínez, J., Meiklejohn, I., Raffi, R., Ramos, M., Schaefer, C., Serrano, E., Simas, F., Sletten, R., and Wagner, D.: Thermal State of permafrost and active-layer mon-itoring in the Antarctic: advances during the International Polar Year 2007–09, Permafrost Periglac., 21, 182–197, 2010. Vieira, G., Mora, C., Pina, P., and Schaefer, C. E. R.: A proxy for
snow cover and winter ground surface cooling: Mapping usnea spp. communities using high resolution remote sensing imagery (Maritime Antarctica), Geomorphology, 225, 69–75, 2014. Vogt, S. and Braun M.: Influence of glaciers and snow cover on
terrestrial and marine ecosystems as revealed by remotely-sensed data, Pesquisa Antártica Brasileira, 4, 105–118, 2004.
Wiesmann, A. and Mätzler, C.: Microwave emission model of lay-ered snowpacks, Remote Sens. Environ., 70, 307–316, 1999. Winkelmann, R., Levermann, A., Martin, M. A., and Frieler, K.:
Increased future ice discharge from Antarctica owing to higher snowfall, Nature, 492, 239–242, 2012.
Woodhouse, I. H.: Introduction to Microwave Remote Sensing, Tay-lor and Francis, Edinburgh, UK, 284–285, 2006.