Development of Information Management
Solution for Measuring People
Performance
Filip Petrovski
Internship report submitted in partial fulfilment of the
requirements for the Master’s degree in Information
Management
i NOVA Information Management School Instituto Superior de Estatística e Gestão de Informação Universidade Nova de Lisboa Development of Information Management solution for Measuring People Performance by Filip Petrovski M2014047 Internship report submitted in partial fulfilment of the requirements for the Master’s degree in Information Management November 2016
ii
ABSTRACT
The main objective of this report is share my internship experience at Closer Consulting, Portuguese Consultancy Company that specializes in Business Intelligence and Advanced Analytics and the challenges I faced during that period. The project analyses different principles of Business Intelligence and Human Resources, and proposes an Information Management add‐on for the Evalyze Suite, developed by Closer Consulting. The proposed information management solution should be used as a tool to support the decision making process of businesses and organizations that are already using or intends to use Evalyze in their Business Intelligence activities. As a result, the proposed tools should be capable of providing insights on the daily operational tasks and help produce reports for the top management. The main challenge that emerged in this project was delivering a business intelligence solution that propose new metrics in the field that no one was measuring, and to re‐inventing the how performance management is conducted in the customer care department of both individuals businesses and organizations, and call centers. In addition, the report highlights the best practices of developing a Business Intelligence solution in order to support critical decision during the development of this solution. My experience as an intern inspired me to take up the challenge and use my internship experience to complete my master’s project.
iii
KEYWORDS
iv
TABLE OF CONTENTS
ABSTRACT ... ii KEYWORDS ... iii LIST OF ABBREVIATIONS AND ACRONYMS ... vii 1.0 INTRODUCTION ... 1 1.1. Problem identification ... 2 1.2. Commonly used KPIs in Call Centres ... 2 2.0 THEORETICAL FRAMEWORK ... 6 2.1. DW Model ... 10 2.2. Power BI ... 10 2.3. What is Evalyze? ... 12 2.4. Evalyze Operational and Logical model! ... 13 2.5. Standards used while creating the DW ... 13 3.0. PROJECT TIMELINE ... 15 3.1. Interview with the manager ... 15 3.2. Pre‐definition of the metrics and architecture used in the project based on the requirements ... 17 3.3. Data Warehouse architecture ... 18 3.4. ETL ... 20 3.4.1. Issue in the ETL ... 21 3.4.2. ETL’s best practices ... 22 3.5. Development of the dashboards using the best visualization tool on the market. ... 23 3.5.1. Issue with Power BI ... 25 3.5.2. Dashboards ... 26 3.6. Global Indicators (Indicadores Globais) ... 26 3.7. Global Indicators Metrics ... 28 3.7.1. Effectiveness ... 28 3.7.2. Operational Efficiency... 29 3.7.3. Allocation Efficiency ... 30 3.7.4. Loading Efficiency ... 31 3.7.5. Global Productivity ... 32 3.7.6. Total Cost ... 33 3.7.7. Quantitative information ... 34 3.7.8. Time Evolution ... 35 3.8. Source tables ... 37 3.9. Comparison Analysis ( Análise Comparativa ) ... 38 3.9.1. First Page ... 39v 3.9.2. Second Page... 40 3.10. Ranking ... 42 3.10.1. Source tables ... 44 3.11. Technical Challenges ... 44 4.0. CONCLUSION ... 49 5.0. FUTURE WORK ... 51 6.0 APPENDIX ... 52 7.0. REFERENCES ... 53
vi
LIST OF FIGURES
FIGURE 1: POWER BI – EXECUTIVE DASHBOARD [SOURCE: CURATOR, 2016] ... 11
FIGURE 2: POWER BI – EXAMPLE OF TRAVEL ANALYSIS [SOURCE: THE POWER BI TEAM, 2014] ... 12
FIGURE 3: INDICADORES GLOBAIS ... 26
FIGURE 4: TIME NAVIGATOR ... 27
FIGURE 5: CLEAR SELECTED BUTTON ... 28
FIGURE 6: EFFECTIVENESS METRIC ... 28
FIGURE 7: OPERATIONAL EFFICIENCY METRIC ... 29
FIGURE 8: ALLOCATION EFFICIENCY METRIC ... 30
FIGURE 9: LOADING EFFICIENCY METRIC ... 31
FIGURE 10: GLOBAL PRODUCTIVITY METRIC ... 32
FIGURE 11: TOTAL COST METRIC ... 33
FIGURE 12: NUM. OF OPERATORS, NUM. OF ACTIVITIES, ACTIVITIES PER OPERATOR, AVERAGE ACTIVITY COST ... 34
FIGURE 13: TIME EVOLUTION CHARTS ... 35
FIGURE 14: DRILL MODE ON, DRILL UP/DOWN, VALUES ON HOVER ‐ LEFT CHART ... 36
FIGURE 15: DRILL MODE ON, DRILL UP/DOWN VALUES ON HOVER ‐ LEFT CHART ... 36
FIGURE 16: DRILL MODE ON, DRILL UP/DOWN VALUES ON HOVER ‐ RIGHT CHART ... 37
FIGURE 17: POWER BI BACKGROUND MODEL ... 38
FIGURE 18: FIRST PAGE ... 39
FIGURE 19: ANALISE COMPARATIVA MODEL ... 41
FIGURE 20: RANKING DASHBOARD ... 42
FIGURE 21: SELECTED SKILL AND SUPERVISOR ... 43
FIGURE 22: RANKING MODEL ... 44
FIGURE 23: ANALISE COMPARATIVA DASHBOARD FILTERS ... 45
vii
LIST OF ABBREVIATIONS AND ACRONYMS
BI Business Intelligence KPI Key Performance Indicator ETL Extract Transform Load SSIS SQL Server Integration Services SSAS SQL Server Analysis Services1.0 INTRODUCTION
The field of Advanced Business Analytics, which consists of Business Intelligence, Machine Learning, Data Mining has been experiencing significant growth over the last two decades as a result of an increase in global business competition and globalization. This has forced most businesses across the globe to focus on ways of improving their performance levels amid the rising cost of operation. As a result of this, most businesses no longer focus only on finding new clients but also improving the level of loyalty of the existing customers as well as reducing the cost of operation. To achieve this, most of them have turned to implementing a Business Intelligence solution. Arguably, the concept of Business Intelligence is fast gaining attention among businesses and organizations, particularly with respect to its role in decision making (Watson & Wixom, 2007 ). This growth is facilitated by the fact that most businesses and organizations by their digitalization, started gathering lots of data. Having access to those huge amounts of data is letting them to transform all they have into information and knowledge use it as a help both their current and future operations. Moreover, the practical application of different Business Intelligence principles and concepts can help develop and deploy viable solutions to enhance both the internal and the external performance of a business (Wu, Barash & Bartolini , 2007 ).
Being part of an Advanced Analytics world was huge motivation for me to pursue Information Management master’s degree and to do my master thesis as a work project. Being able to work directly in the field of Advanced Analytics on real project, facing the real challenges from the business were great stimulus for me to complete this project. This project will allow me to enter deeply in the Business Intelligence and Human Resources area and the most important KPI’s related to these areas. This internship report will conduct a case study developing a Information management add on of a back office task management solution for call centers, implemented in one customer care outsourcing company. During the 6 months period I will need to identify the most appropriate architecture for a data warehouse that will satisfy the needs of the project. This will also involve identification of the state‐of‐the‐art protocols of measuring the performance that support contact centers and customer care department in large companies. Importantly, the research will focus on addressing the challenges of a modern contact center with user performance in mind. Furthermore, there is
a need to note that since the project intends to develop a new KPI’s in the field, there will be no other solutions to compare with. This implies that in order to establish whether it is successful or not, the project will rely on the performance of the product on the market. As a result, the success of the solution and the profits thereof will be the main jury of this master work.
1.1. Problem identification
Apart from the financial sector, the contact centers sector is one of the biggest industries that require a high level of expertise. While this is case, capacity planning and effective management and evaluation of people are among the main challenges that most large call centers and companies face (Feeny, Lacity & Willcocks, 2005). These challenges further increase if these call centers and companies outsource their call centers’ operation throughout the world. As a result, in most cases, call centers and companies that engage or use similar service rely on factors such as customer waiting time, number of issues resolved in a single day, time taken to attend to a customer, and the number of calls that a representative answers in a day as their most critical and relevant metrics (Budhwar, Luthar & Bhatnagar, 2006). In most cases, the front office has the responsibility of dealing with these metrics on its own. However, since there is a significant growth of call center activities, there is a need to establish back office support, which will be tasked with the supporting contact centers. Such support would include data validation, real‐time evaluation of sales, monitoring of operators, maintenance of individual records, and management of clerical tasks among others. The back office in itself requires effective task assignment and efficient communication (Soda & Zaheer, 2012). While this is the case, most organizations in the corporate world lack proper back office solutions to help manage tasks, as well as track and monitor bottlenecks in their processes and operations.
1.2. Commonly used KPIs in Call Centres
On the market, there are different metrics that are used in call centres and back office to measure the performance of employees. One of the mostly used KPI in call centres is the number of calls waiting as well as the average customer waiting time. In reference to Fogli
(2006), the reliance on the number of calls waiting as a performance measurement metric was meant to ensure that call centre staffs were available to answer the telephones. With regard to the average customers’ waiting time, it is necessary to observe this performance metric is critical to helping establish whether agents are efficient and timely in their discharge of services. Similarly, the level of customer satisfaction is increasingly becoming a critical performance metric for call centres. According to Cheong, Kim and So (2008), most call centres currently use a technology that allows customers to rate the quality of service and their level of satisfaction at the end of the call using third party survey solutions and applications. Arguably, through the analysis of the average rating or score of sampled calls and the customers’ subjective views, the management of call centres is able to establish the performance levels of its agents.
Another KPI that is commonly used in call centres and back office is people management, which is mainly concerned with the measurement of the attrition rate. According to Taylor and Bain (2005), the attrition rate is a lagging indicator that is mainly occurs because of different factors in the economy, both locally and nationally. A high level of attrition rate is associated with a high employee turnover leading to recruitment and high training costs, and lower employee performance. In this case, a high attrition rate has a negative impact on the level of motivation of back office employees and call centres agents, leading to poor performance levels. Attrition rate exist, exists and it will stay as a problem forever. We can try to develop models in order to predict the people that are going to leave, but if we think a bit out of the box we can also develop a solution that will deal with the tasks in the back office, solution that will create proper communication between the front office and the back office and generally in the back office internally. Having this solved on an elegant way should make the work easier and create a possibility for the company to measure its employees correctly and monitor and control their daily task list. If the company is able to measure correctly its employees, it will be able to detect the top performers and also generally to distinguish the good from the bad employees and focus to retain the best one. In general my project is preparing the data to be used for developing models for capacity planning where with proper allocation we will be able to optimize the
allocation of the people, and plan our future work only with the best employees, rather than with all of them.
One of the current solutions that could be used to improve capacity planning and promote proper management of human resources in the back office of call centers is Evalyze Suite. The solution was developed by Closer Consulting, a consulting company with over 10 years of experience in Business Intelligence and advanced analytics (Evalyze, 2016). Closer Consulting boasts of a ton of experience acquired through working with numerous call centers in different parts of the globe include Portugal, Brasil and Angola. This experience helped Closer Consulting develop the Evalyze Suite, which consists of a number of products that help evaluate, analyze and improve that management of contact centers. In reference to Evalyze (2016), Evalyze is capable of measuring the performance of a business and delivering immediate impact by decoding corporate data. Among the major goals of Evalyze include optimization of the time needed to address a back office task, as well as monitoring of the organization’s workload using metrics such as: • Number of created tasks in one day • Number of treated tasks in one day • Number of pending tasks • Number of solved tasks in one day • Number of interactions with the interactions during one day • Average time of treatment for one task • Number of interactions per task • Overview of the pending tasks • Overview of the status of the tasks Speaking from this perspective, the goal of my internship as well as my masters’ project is to apply my information management and business skills acquired in my masters’ classwork to develop a framework for a more detailed tracking of users’ performance. In addition, my goal was to utilize my Business Intelligence knowledge and skills to develop an appropriate Data
Warehouse that will support the Information Management part of Evalyze. To achieve this, I worked as an intern at Closer Consulting’s R&D Department for a period of six months.
My main objectives during my internship and in the accomplishment of my masters’ course was to work and develop practical Key Performance Indicator (KPI) from a business’ point of view. These will include Data Warehouse and Dashboards for Evalyze.BO (Back Office). My intentions were to give the top management a 360 degree vision about the productivity level of the whole back office department. This also included provision of all metrics that supervisors need to effectively monitor individuals in their teams.
Finally, I will propose a framework for monitoring different kinds of businesses where their work can be divided into different tasks. This is to help diversify the application of Evalyze functionalities and ensure that it applicable to different kinds of businesses apart from the call centers.
2.0 THEORETICAL FRAMEWORK
The 21st century businesses face a myriad of challenges that undermine their ability to achieve their goals and objectives in their respective industries. This is irrespective of the fact that the current corporate work has a significant access to a range of technologies as compared to businesses in the 1950s all through to late 1950s. Among the challenges that most businesses face range from management, customer retention, human resource management, and planning for the future among other challenges (Grant, 2016). While businesses need to deal with each of these challenges, the management of employee performance, capacity planning, and the application and utilization of Businesses Intelligence and Data Warehousing tools, framework, and concepts to enhance business performance is a significant challenge.
To begin with, Bititci, Garengo, Dörfler and Nudurupati (2012) argue that one of the main challenges that businesses and organizations face with respect to measure people performance is establishing the right metrics. Arguably, whereas there are numerous types of metrics that have been developed before, there is a need to observe that individual organizations require specific metrics that are strategically linked to their goals and objectives to measure employee performance (Schuler, Jackson & Tarique, 2011). Bititci, Garengo, Dörfler and Nudurupati (2012) further point out that the approaches to performance management are changing drastically and as such, businesses need to remain dynamic in how they measure employee performance. Despite their different approach to the issue of measuring employees performance, there is consistent agreement between Bititci, Garengo, Dörfler and Nudurupati (2012), and Schuler, Jackson and Tarique (2011) that businesses need to redefine how they deal with people performance, and in particular, ensuring that such performance measures reflect the strategic alignment of the business in its respective industry.
In their analyses, Gruman and Saks (2011) propose that businesses and organizations need to establish a framework that promotes employees engagement, since this is a vital component of employee performance management. In this case, Gruman and Saks (2011) suggest that without employee engagement framework in place, organizations face difficulties in establishing effective employee performance systems. Rich, Lepine and Crawford (2010)
agree with Gruman and Saks (2011) on the role of employee engagement. However, these researchers further affirm that employee engagement often support the evaluation of performance of teams as opposed to individuals, and as such, promotes teamwork, enhances relationships between value congruence, and encourages organizational support. Importantly, in both cases, the researchers fail to address how businesses can establish effective system that promotes employee engagement. This is irrespective of the fact that different research and studies point to the fact that employee engagement promotes better performance results as compared to factors such approaches such as better remuneration and better working conditions among others (Rich, Lepine & Crawford, 2010; Gruman & Saks, 2011; Markos & Sridevi, 2010).
One of areas that are fast gaining attention of human resources manager is how to utilize business intelligence concepts to manage employee performance. In reference to Rajterič (2010), businesses that have integrated BI in order to address performance management issues in their environments use varied approaches depending on their maturity levels. In this regard, Rajterič (2010) argues that businesses that are at the initial stages of using BI to manage people performance face challenges since they do not have a central approaches to managing data from different sources, resulting in conflict views thus undermining the business’ capability to make critical decisions. On the other hand, Fedouaki and El Alami (2013) note that businesses that are considered mature with respect to using BI in their operations often rely on a centralized management of BI data sources, a factor that makes easier to make critical decisions. Whereas these researchers differentiates how businesses at different levels of development integrate BI concepts in their operations, they fail to mention the fact that businesses at an advanced level of develop rely different technological frameworks to collect and manage their BI data from a central point.
Importantly, there are a number of factors that Business Intelligence systems need to possess in order effectively help businesses achieve their objectives with respect to performance management. Fedouaki and El Alami, S. (2013) points out that for businesses to successfully use BI in supporting performance management, there is a need to develop different filter methods that helps the organization to gauge its present state against its goals and objectives at a particular time. In this case, the BI system need to be able to filter out irrelevant information and provide only information that is critical to supporting different business functions (Stone & Woodcock, 2014; Larson & Chang, 2016). Similarly, Chiang, Goes and
Stohr (2012) reiterate that the BI system needs to be able to gather both near‐time data and real‐time data, thus enabling the organization in question to understand its real performance and as such, make informed decisions.
Apart from business intelligence, Data Mining is also a critical tool in measuring people performance and capacity planning in organizations. According to Cokins (2004), data mining plays an instrumental role in exploring large quantities of data for compressive analysis in order to establish hidden relationships, uncover trends, associations, patterns and even anomalies with aim of maintaining proactive decision making. Importantly, Ahmed and Elaraby (2014) emphasizes the fact that data mining can help predict how different people as well as areas in an organization will performance both in a near or long term future. As a result, Naqvi (2015) observes that identifying relationships and predicting behavior can help organizations to realign their resources to enhance their optimal value. For instance, this may involves increasing or reducing the workforce in a particular area, mixing different skills, as well as providing specific resources among other factors.
Apart from Data mining, Al‐Zubi, Shaban and Alnaser (2014) identify Data Warehousing as a business intelligence tool that is critical in the decision making process of businesses and organizations. In reference to Linoff and Berry (2011), Data Warehousing refers to the processes of bringing together disparate data from different sections of the organizations with the aim of supporting its decision processes. According to Krishnan (2013), data warehousing has gone through a revolution with the aim of supporting the decision‐making process with respect to collecting, storage and management of data, and rely on both statistical and traditional methods of measurement to implement an analysis and reporting platform. Linoff and Berry (2011) agree with Kimball and Ross (2011) that data warehousing activities need to present the organization’s information in a consistent way, ensure easy accessibility to this information, and be adaptive and resilient to change.
There are a number of tools that have been developed in the past to help implementing and manage data warehousing activities. One of the tools that more businesses and organizations across globe use in their data management activities is the Microsoft Business Intelligence Suite. In reference to LeBlanc, P., Moss, J. M., Sarka, D., & Ryan, D. (2015), the Microsoft Business Intelligence Suite has different tools that developers and data scientists reply on to perform different functions quickly and efficiently. These researchers and scholars further
note that this suite is changing rapidly to widen the scope of its tools in order to enhance its ability to deal with the changing landscape in data warehousing, big data and other business intelligence functions. For instance, Microsoft (2016) notes that one of the tools that have been integrated into the Microsoft Business Intelligence Suite is the Power BI. The Power BI plays an instrumental role in data visualization. According to Microsoft (2016), Power BI transforms data in businesses and organizations into rich visuals that can be collected and organized, thus giving the ability to focus only on what matters. In reference to Cannon (2011) and Borup (2015), data visualization provides a framework to convey information in visual forms rather than numerical or verbal format. Borup (2015) further points out that good data visualization should be able to quickly expose the meaning of data in terms of
trends, status and patterns at a glance, which might otherwise take time to comprehend.
Another data visualization tool that plays an integral role in data visualization that is now part of the Microsoft Business Intelligence Suite is Datazen. According to Hathi (2015), Datazen focuses on mobile business intelligence and data visualization on different platforms such as Android, iOS and Windows devices. Hathi (2015) further notes that the Datazen technology is an important complement to Microsoft’s Power BI. The increasing collaboration of Datazen and Power BI as dashboard tool affirms the fact that dashboards rely on data visualization capabilities in order to provide a true picture of what specific data means. According to Stirrup (2016), people cannot make informed decisions without accurate data representation in dashboards. Therefore, these tools are critical in providing a clear picture of what the particular data implies and as a result, help decision makers make informed choices.
In conclusion, researchers, scholars and business analysts agree that business intelligence and data mining are some of the critical tools that organizations can deploy to enhance their capacity planning and measure people performance. While this is the case, there is a need to observe that most research and studies focus on how organizations as a whole can use data mining and BI tool as opposed to individual departments. Speaking from this perspective, there is research can use this limitation in the past studies to conduct a study on how to deploy solutions for measuring people performance and capacity planning in a back office. Importantly, future research needs develop tools that utilize a combination of different metrics in managing performance as opposed to using individual metrics to measure performance.
2.1. DW Model
Data Warehousing is one of the critical elements in the management of big data in the 21st
century. According to Ponniah (2011), data warehousing plays a critical role in providing critical strategic information. One of the widely used data warehousing model is the Kimball Model of data warehousing. In reference to Kimball and Ross (2013), Kimball Model of data warehousing, which is sometimes referred to as, Kimball’s dimensional design approach, approaches the design of a data warehouse from the bottom up. This implies that the facilitating reports and analyses of the data marts are first created before creating or rather developing the actual data warehouse.
One of the critical aspects of Kimball’s model of Data Warehousing is the fact that is usually implemented using a Star Schema. There are various advantages of using Kimball model Star Schema. To begin with, the Star Schema has a better query performance as compared to Operational, or online transaction processing (OLTP) (Kimball & Ross, 2013). This is because the Star Schema has fewer tables, and the dimensions are connected via the central fact table, thus making the design more consistent and accurate as far as query results are concerned. Similarly, the primary and foreign keys guarantee referential integrity of the data store in a data warehouse with a Star Schema design, and help link different tables in the data warehouse. Similarly, the Star Schema design have better administration and performance because of its capability to reduce the average time for loading huge amount of data into a database, which is achieved through clearly defining of dimensions and facts and classifying them into different tables (Kimball & Ross, 2013). However, it should also be noted that the main weakness of Star Schema design in multidimensional is embedded in the fact that establishing relationships between attributes is difficult. 2.2. Power BI Data visualisation is one of the critical aspects that helps represent huge chucks of data in a simpler form that is easy to understand. According to Dzemyda, Kurasova and Žilinskas (2012), businesses and organizations in the 21st century produce large amount of data and as a result, data visualization is required to help this data become useful. In other words, it is critical to simplify the collected data to make meaning out of it. One of the tools that play an
instrumental role in data visualisation is Microsoft Power BI. In reference to Aspin (2014), Power BI, which technically speaking is part of Sharepoint online, provides a platform for one to upload Excel workbooks into cloud and enable sharing of reports with the desired recipients. Moreover, these Excel workbooks can be automatically updated, thus ensuring smooth flow as far as data processing is concerned. In this regard, Power BI can enable different interested parties to discuss reports irrespective of limiting factors such as distance.
In addition, Power Bi has tools that allow people who are working on a project to use Power Query to share queries as well as complex data processing routines. With this in mind, businesses and organizations can effectively and efficiently use resources such as time by eliminating the need to duplication of effort that could emerge when employees are working in “data silos” (Aspin, 2014). Furthermore, apart from saving business resources, the minimization of cases of duplication of data helps eliminate data integrity problems that could arise along the way. Importantly, as dashboarding tool, Power BI, can be deployed on a number of platforms including Android and Windows operating systems. This means that users of this tool can use it as a mobile app or on the go. Note that all these functions of Power BI are accessed via an interactive dashboard, thus making this visualisation application a better dashboarding tool.
Figure 2: Power BI – Example of Travel Analysis [Source: The Power BI Team, 2014]
2.3. What is Evalyze?
Evalyze.BO (Back Office) plays an instrumental role in Business Intelligence because of its capability to monitor, optimize and allocate tasks the back office tasks to different operators. In this regard, this innovative solutions collaborates with front office in the sense that once it receives processes from the front office, it prioritizes and processes them in instantaneous to the back office operators (Evalyze, 2016). As a result, it manages these processes in the most optimal and effective way until they are successful completed, based on the defined as well as Service Level Agreement (SLA) goals. Thus Evalyze.BO provides a framework for continuous distribution and prioritization of tasks in the business or organization using it at every moment. Therefore, Evalyze.BO is capability of enhancing the productivity of contacts centers by approximately 30% (Evalyze, 2016). This is achieved through intelligent allocation of resources (using Advanced Analytics algorithms, which helps schedule and allocate processes based on the desired service levels – capacity planning) and task performance in the IT system.
2.4. Evalyze Operational and Logical model! Evalyze.BO has a complex operational database model. However, this research will only use simple key tables in DW, which can be described by examining Evalyze’s logical model. The logical model of Evalyze in the background is divided in three main parts interesting namely: • Tasks: This is all the information related to the task itself. As a task, this report considers an occurrence, which can only be solved using specific skills, within a given SLA time (Service Level Agreement). The SLA sets the deadline for the specific task. • Interactions: These are all the details about each interaction between users and the tasks they are working on. As an interaction this report considers all the cases that are entered into one task, as well as save these changes based on each recorded case. Each interaction is done by a user under the directive of the supervisor. The supervisor is managed by the coordinator, who controls the allocation of users to tasks, and ensures that the tasks match with the users’ set of skills. • Users log table: These are all the details about the changes in the status of the user. This report considers when the time when the user first logs onto the solution and the time the use logs off from the solution. 2.5. Standards used while creating the DW There are a specific set of standards that this research will use to create a table in the Data Warehouse. First, the researcher will create two different schemas, one for the fact tables called fct.NameOfTheTable, and second one for the dimensions called dim.NameOfTable. The second standard that the research will rely on concerns naming of columns. Note that each column has its own prefix based on the meaning of the column. The study will use several abbreviations in the facts and dimensions including the following: a) SK ‐ Surrogate Key, as a unique identifier for the row b) CD – Code c) DSC – Description d) AM – Metric e) DT – Date f) NR – Number g) SS – Seconds
h) HH – Hours i) DD – Days j) MM – Months k) QY – Quantity l) FLG ‐ Flag
3.0. PROJECT TIMELINE
The methodology of this internship report has several sections:
• Interviewing the Manager of the R&D department, mainly concentrating on Evalyze in order to gain insight into the final clients’ main challenges, and as a result, lay the basis of focus for this report
• Pre‐definition of the KPI’s that the report will develop
• Data Warehouse architecture
• ETL from the operational model to the DW
• Development of the dashboards using the best visualization tool on the
market.
3.1. Interview with the manager
The researcher interviewed the manager of the R&D department and recorded responses as follows:
Q: Hello, can you please explain the business requirements for one back office solution. What are the main aspects that make Evalyze better than its competitors?
A: Hi, the most important thing that has to be mentioned at the beginning is that Evalyze has no direct competitor who undermines its logic. Moreover, there is no other tool on the market at the moment that has a business value which can match or rather rival Evalyze’s. Regarding back office solutions, our focus has been on proper task allocation rather than just creating and keeping tasks. Our smart algorithm in the background identifies the most suitable operator for a specific task and directly allocates him/her that task. Businesses actually need proper allocation of tasks between the users to reduce the time medium treatment (TMT) of one task. This is also used as a way of measuring the performance of the team as well as a guarantee for proper capacity planning.
Q: What is the logic behind Evalyze.BO? Can you please try to explain the kind of data you keep for each task?
A: Evalyze’s Back Office logic is simple. This solution categorizes different tasks based on the required skills. The solution also establishes whether one task can be done by one person or several people not necessarily from the same team. Therefore, in most cases, the solution helps allocate a single task to several teams to help utilize the expertise and knowledge of each team and as a result, complete the specific task in an efficient way. Importantly, as a business, we track every change that is done to a task, that is, we record every interaction between the operator and the task. This is evaluated and analyzed to improve our processes. Q: Since you mentioned what is important to be evaluated and analyzed, in your opinion, what should be the focus of this internship report? A: According to our analysis so far, we will need to address the topic from two aspects. The first aspect is people’s performance as a whole, or I can say, the performance of the operation as a whole. The second aspect is the performance of individuals or teams. Therefore, creating a dashboard that helps the report compare teams or people, or even operations will be critical. The report can also consider a dashboard that will be used for ranking people.
Q: What do you mean by ‘the performance of the operation’? How can you connect people’s performance with the performance of the whole operation?
A: Well, both are tightly connected. The performance of the whole operation is actually the performance of the task. Let’s say a particular task has a deadline, called SLA (Service Level Agreement), and that is the only relevant way to measure if the task was successfully done or not. The successful completion of this task on time will therefore be used as a measure for the success of all the people working on that task. Therefore, when I talk about measuring performance of one operation, I am simply referring to whether the people working on the task had the knowledge and skills to successfully complete a particular task, and when they used these skills and knowledge to complete the task. Once we have data on the team performance, we are able to evaluate the performance of individuals in depth.
Q: OK. One last question. Please explain what you mean by ‘a life cycle of one task’. Are there any specific facts that the researcher needs to take into consideration?
A: Yes. The life cycle of the task is a bit complex. First, the front office creates tasks that are stored in a database which indicates the number of tasks they create. The next step is to conduct an ETL operation to Evalyze.BO Operational database. Once this data is successfully mapped on an Evalyze.BO Operational database, the task is assigned to a person with the technical know‐how to complete it. Afterwards, the task is accessed and edited by unlimited number of people until it is done.
3.2. Pre‐definition of the metrics and architecture used in the project based on the requirements
As it was suggested by the manager in the interview, this report divided the KPI’s in two parts, Operational KPI’s and Personal KPI’s, and as a result, focused on developing these two groups of KPI’s. Taking into consideration all the facts mentioned by the manager and after deep analysis of the topic, the report focuses on the following metrics for all the fact tables: a) Time of the interaction b) Total time of interactions for one task c) Total time needed for the task to be finished, from beginning to end
d) Time between the creation of the task by the front office and its loading to Evalyze.BO e) Number of interactions needed to close the activity f) Flags for: i. Reopened task ii. Status of the task (Open/Closed) iii. Closed within SLA (yes/no) g) Total working time spend by the user in a day h) Total time of interactions of the operator in one day
This being defined, we will also have to define the architecture of the whole solution. According to the BI standards we should have the following type of architecture:
Source ‐‐‐ (ETL)‐‐‐ Staging Area ‐‐‐(ETL)‐‐‐DW‐‐‐ Cube ( Tabular or Multidimensional ) ‐‐ Reports After the required analysis and consultation with the senior consultants, we defined that we will do ETL directly to the DW and then we will import the data directly to Power BI, since in the background, Power BI works with the data exactly the same as SSAS Tabular mode. The technology we are going to use for this project will be completely from Microsoft BI Suite, so the tools are going to be the following: • SQL Server Management Studio • SQL Server Integration Services • Power BI 3.3. Data Warehouse architecture Since the solution has two logical parts, it is more appropriate to design the data warehouse with three separate logical fact tables. As mentioned before, while examining the logical model of Evalyze, the report will replicate the three main sources and create the following fact tables:
1. Activities – This is the fact table which will summarize all the tasks with the complementary metrics. This fact table has activity as a transaction and has all the metrics associated with the activity. The metrics that are pre‐calculated in this table are going to be used for calculating the main metrics in the dashboards later. a) Metrics: i. AM_SS_TOTAL_INTERACTIONS_TIME – The sum of all the time spent working on interactions. ii. AM_NR_INTERACTION – The total number of interactions that are associated with the given activity.
iii. AM_SS_TIME_TREATMENT – The time spent between the first and the last interaction.
iv. AM_SS_TIME_IMPORTATION – The time spent between the creation of an
activity and its importation.
v. AM_SS_RESPONSE_TIME – The time spent between the creation of an activity
and the beginning of the first interaction that is associated with the activity.
vi. AM_TIME_CLOSED – The time needed for the activity to be closed.
vii. AM_ETL – This is the difference between the time when the activity was created and the time it was imported.
2. Interactions – This is a fact table that will include all the interactions done between the operators and the tasks. This is another important table that will be used as the Interactions table, which includes all the interactions associated with the activities.
a) Metrics
i. AM_SS_TIME_TREATMENT ‐ represents the time spent working on the
interaction.
3. Ociosidade – This is the table that will focus on the workday of the users. It will provide information about the total working time and the total productive time on Evalyze. This fact table will store the statuses of the users in the solution as well as the changes that occur in the users’ statuses.
a) Metrics:
i. NR_INTERACTIONS ‐ counts all the interactions for a given operator.
ii. AM_TOTAL_INTERACTION_TIME ‐ sum of all the time spent working on
interactions per user.
iii. AM_TOTAL_WORK_TIME ‐ represents the total working time of the operator.
These three fact tables were the requirements recommended by the project manager. They are sufficient for providing insights as far as company performance is concerned. The next
steps involve defining all the dimensions which describe the transactions from the fact tables. The following dimensions are used in these steps:
• Time ‐ A date dimension table contains all the information concerning specific
dates. The table has the following attributes: day, week, month, quarter and year. This is a calendar table which is useful for determining factors such as business days between two dates, holidays, etc. Time dimension is the most important dimension in a Data Warehouse because every analysis conducted in the Data Warehouse is based on time.
• Operation – This dimension is necessary to help in making a standard DW for
all the operations in the future. This report analyzes one operation; however, since the client is an outsourcing company, it has more than one client (operation). The dimension is critical for this analysis.
• Operador ‐ This is another important dimension. The dimension has the
company hierarchy as its critical element: user ‐ supervisor ‐ coordinator. The dimension also defines the role of each user. Basically, the dimension contains records of all the users and their respective supervisors, both current and past.
• Team – The skill required to complete one task in the DW is called a team. According to Evalyze, skills are called teams. The dimension will also be referred to as a skill in the visualization part of the project. • Status ‐ This dimension contains all the statuses of an activity such as closed, in progress, canceled, pending, declined etc. 3.4. ETL The process that followed the definition of the Data Warehouse structure is the ETL process. Note that this report does not highlight the Staging table since ETL does not have complex processes, and transformations can easily be done in the loading process. While creating this ETL process, there are various practices that will play a critical role. Note that the ETL process was done using SQL Server Integration Services. Separated ETLs, each for every fact, and a dimension table were used in the data extraction process. In order to create the ETLs, the production database tables were replicated but changed and new metrics were added to address the needs of the business reports for this study. Importantly, fact tables consist of 2
types of fields, that is, surrogate keys and metrics. The fact tables for this report will create use of three types of columns: SK (Surrogate Key), CD (Code) and metrics, which has a shortcut as AM. These codes are used in order to record more details in the fact tables. Moreover, these codes make it easier to validate the results of the ETL Phase.
3.4.1. Issue in the ETL
There is an unexpected issue that emerged while working on the ETL. Namely, the interactions table only kept records of users who did the interactions; nonetheless, the supervisors’ and coordinators’ table changed over time. In order to track history, this report contains a historical table that has records of all the user and parent changes. This forced the report to change its logic and create a parallel process for tracking the history of interactions where the changes of the users’ supervisors and coordinators are tracked based on the date and hour of the interaction. The UsersRCA_History is used to obtain all of the combinations User ‐ Parent User that have happened and ended as well as some changes that have been made. The Parent User is named as Supervisor. The current (last) combination of User ‐ Parent User is stored in UsersRCA. In order to get all of the combinations in one table, a union of both tables needs to be used.
In the time interval of every interaction, every user has a unique supervisor, and that supervisor (as user) has a unique parent user, named as the Coordinator.
To make this mapping of time intervals correctly, every interaction needs to be matched with exactly one row from the union of rows from the tables UsersRCA and UsersRCA_History. That is why each row from the union is partitioned in a specific time interval. (The partition was made by the LastUpdate column). This means that the report intends to obtain a record for every user and his/her supervisor, and the interval in which the supervisor was in charge of the user, as well as the interval in which the coordinator was in charge of the supervisor. In other words, these processes help to obtain the following hierarchy: user – supervisor – coordinator, and the proper time interval that suits the specific match.
Finally, the interactions are joined with the above mentioned hierarchy by obtaining the time of the interaction between the intervals of the user – supervisor – coordinator combination.
This helps to correctly match a user’s supervisor and coordinator while working on the specific interaction. This will be used only to get the historical data of the interactions, whereas the new data will be properly loaded every day.
StartDate1 and EndDate1 represent the time interval of when the supervisor was responsible for the user, whereas StartDate2 and EndDate2 represent the time interval of when the coordinator was responsible for the supervisor. The idea of all the ‘cases’ above in the code is to get the global interval of the pairing user‐supervisor‐coordinator.
3.4.2. ETL’s best practices
1. Prevent the overloading of huge data by loading only the new dates i.e. data that has a date different from the date of the last load. This is done by using a variable @LastLoad. The date of the last loaded interaction is recorded from the destination table, and with every new load, only new data is loaded, which shortens the time of loading. This kind of prevention is done in the fact tables Interactions and Ociosidade.
2. Using FLG_ACTIVE ‐ The process allows making historical records of the data. However, not all tables keep history. This kind of flag is used in the Activities fact table. In order to use such flag, it is necessary to use a specific tool of SSIS called Checksum that allows unique integer value to be given to each row and be used as some sort of unique identifier. This value is actually a sum of all the columns in the row that are of same integer type. This guarantees data validation without checking multiple columns in a row to see if something has changed. As it can be observed from Figure 5 above, a checksum is created for every new record and then with a simple Look Up, the checksum of the new records can be compared with the checksum of the already existing records to see if some of the existing records were updated. Namely, if it was updated, a new row would be created with a FLG_ACTIVE=1, and the FL_ACTIVE in the old (updated) row would then have 0 value. Similarly, if the new record with the specific checksum is not among the already existing records, it will be added as a new row with FLG_ACTIVE=1.
In order to create the dimension tables, a simple ETL is used. A slowly changing dimension that enables assignment of proper dimension’s attribute value is used. The tool slowly changing dimension is used for creating all the dimension tables except the Operador
3.5. Development of the dashboards using the best visualization tool on the market.
The most critical part of this project was done after creating the DW. After conducting the ETL processes and populating the fact tables according to the theory, it was necessary to create a multidimensional model that will be used as a source for dashboards, ad hoc reports, etc.
One of the main challenges that emerged was the difficulty in creating a connection between Power BI and the cube without an Active Directory once a cube is created on Azure server. Therefore, it was necessary to find a better way to address the problem in order to eliminate this constraint and reduce the risk for prospect future clients. One of the approaches in solving this problem is through creation of a direct connection with the Data Warehouse model. Since Closer Consulting is Microsoft Gold Partner in Business Intelligence, it was necessary to choose between the two most advanced tools of Microsoft at the time when this report was being prepared, Datazen and Power BI. The challenge in making the decision was based on the fact that the two options use different logic when it comes to working and making a bad choice could cause problems in future.
This report opted to use Power BI because of its great capabilities and the full support that is offered by Microsoft. On the other hand, Power BI works more like cube in the background, since the work environment is similar to working in SQL Server Analysis Services. This explains the challenges that emerged as far as connecting the Power BI dashboards directly with the data warehouse was concerned. After testing the tool, it was time to create the logic of each dashboard. Importantly, the report concentrates on quality rather than quantity. Therefore, the report considers dynamic dashboards that show data from different perspective, as opposed to using numerous dashboards that have limited capabilities.
Similarly, based on the project manager’s requirements and expectations, two dashboards were needed: one for comparison and the other for ranking. In addition, the report added a third dashboard to show the metrics on a global level for the whole operation at once. Once
defined, there were 3 concepts that were ready to be developed:
a) Indicadores Globais – a dashboard that shows data on the level of operation
b) Analise Comparativa – a 2‐pages long dashboard to compare two logical groups of metrics (Metrics associated with the activity, and Metrics associated with user).
c) Ranking – a dashboard for ranking the operators from all possible
perspectives; these will be used as a dynamic rank list.
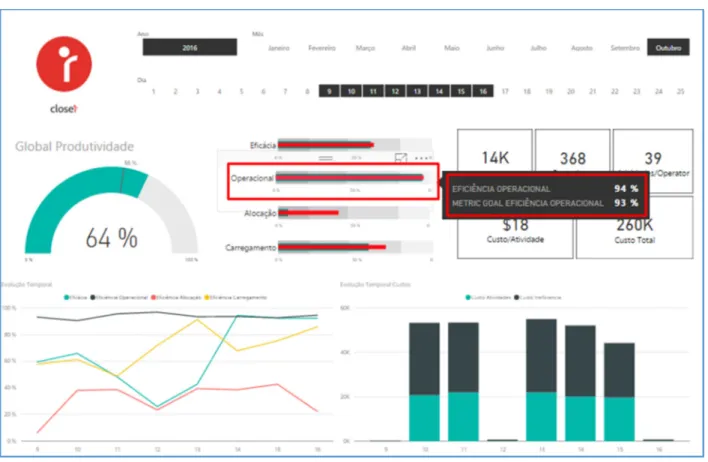
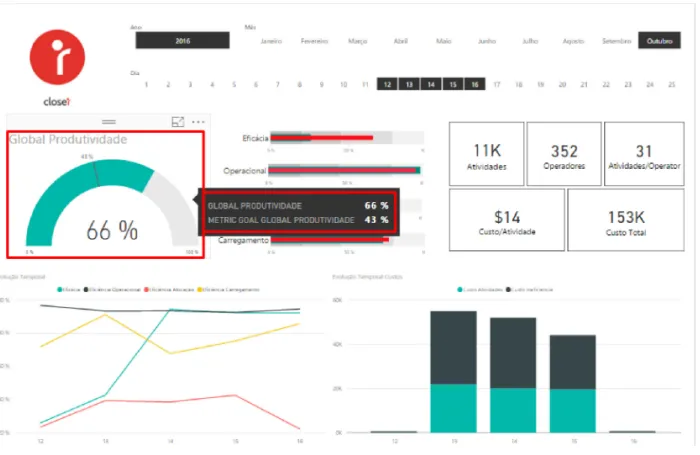
The final step of the analysis and definition phase is the definition of the metrics that will be used in the analysis, as well as, ensuring that all the needs defined by the client were satisfied. As mentioned earlier, it is critical to create two main logics, one to analyze the performance of the tasks as a whole and another to analyze people’s performance. At first, it was critical to measure the performance of the tasks based on their SLA. If the activity passes the SLA time and is yet to be closed, it is considered as “failed” because it does not comply with its Service Level Agreement. The percentage of successfully closed activities will be called Eficacia. This metric is critical and it is the basis of all the analysis in the next steps. The next logic that was examined was the total time of interactions which was spent in order to solve the task. This is another critical KPI in call center businesses. The lower the TMT (“Tempo Medio Tratamento” in Portuguese), the better the performance of the call center. Therefore, the main goal of Evalyze solution is to minimize the TMT for each task.
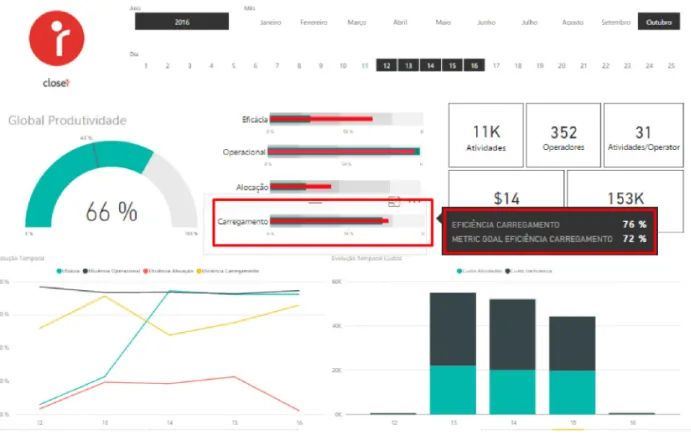
In addition, Efficiencia Operational will show the Efficiency of the Operation as a whole, and will provide rewards in cases where the TMT was lower than the TMT before Evalyze, and will impose penalties where the TMT was higher than before. In line with this, the report compares past operations before the implementation of the Evalyze solution and the future ones when the metric had used TMT during the period between 6 or 12 months in order to evaluate whether Evalyze guarantees constant improvement for the client. Once the most important metrics are widely analyzed, the report will widen its scope and try to assess the performance and efficiency of another phase of the life cycle of one task. The beginning of the task is very important for this report and as a result, it will measure the time between the creation of the task by the front office and its importation into Evalyze. This efficiency will be called Efficiencia Carregamento and will show the performance of the front office and the percentage of the general SLA time that is unproductively spent, in this case while waiting to load.
One of the critical issues concerning these above‐mentioned three metrics is the fact that these three parts of the life cycle of one task, that is, the time needed for importation of the task ( Efficiencia Carregamento), the total time from creation to closing ( Efficacia) and the productive time spent on actual work on the task ( Efficiencia Operacional). As a final efficiency, we will show Efficiencia Alocacao, which measures the productive time of each user in one day. The percentage of time spent on actual interactions with the tasks over the whole time spent at work provides the value of this metric.
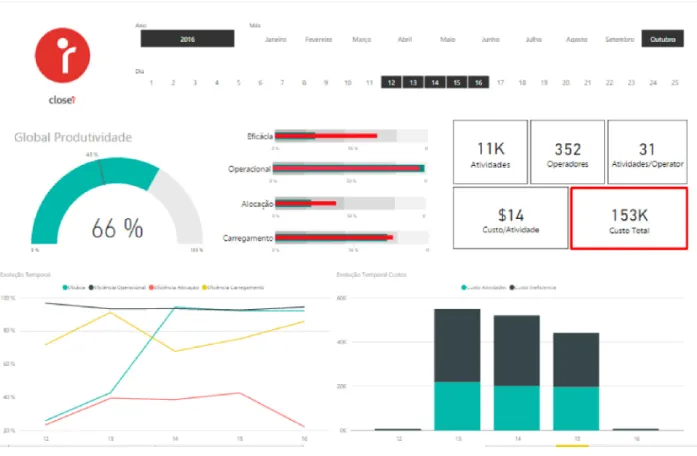
The other measures examined are the total number of activities during that period of time, number of activities per operator, number of activities during the specific period of time and the respective cost of operation. When it comes to the cost group of metrics, the report assesses the average cost of one activity, the total cost of working and the total cost if the operators are not productive. These metrics show that the report is also interested in the average time spent on interactions by one user as well as the number of interactions of the user and the number of activities while the user was working.
3.5.1. Issue with Power BI
After defining the metrics, all the formulas needed to be written in DAX language and calculated directly in Power BI. This revealed a critical limitation in Power BI. Since some of the metrics are calculated in Activities, some in Interactions and others in the Ociosidade table, it is difficult to implement a logic that will be fast and at the same time show metrics from 2 or more fact tables on one dashboard and have a filter that will affect all the possible metrics on the dashboard. Therefore, all the three fact tables in the DW were combined to create a view and logic for calculation of all the possible metrics directly from one table. This did not pose a challenge since Power BI has a similar working functionality as cube in the background. Importantly, a simple flag known as Quantity_activity, Quantity_Iinteraction and Quantity_Ociosidade, which marks the lines from the Activities, Ociosidade and Interactions tables, was created in the view. Note that this view was created to address connectivity problems of all the 3 tables in cases where two different metrics were necessary, each from a different perspective. The use of one source eliminates the need to join tables with a lot of rows and makes filtering the data much easier. The complexity of the dashboards that were created is much lower in this case.
3.5.2. Dashboards
After creating all the metrics and the logic behind the dashboard, it was time to address the last part. As mentioned earlier, this report will focus mainly on three issues, that is:
• Indicadores Globais – Global overview of the company
• Analise Comparativa – Dynamic dashboard for comparison between two
operators, teams, skills or operations
• Ociosidade Ranking – Ranking of all the users based on different perspectives
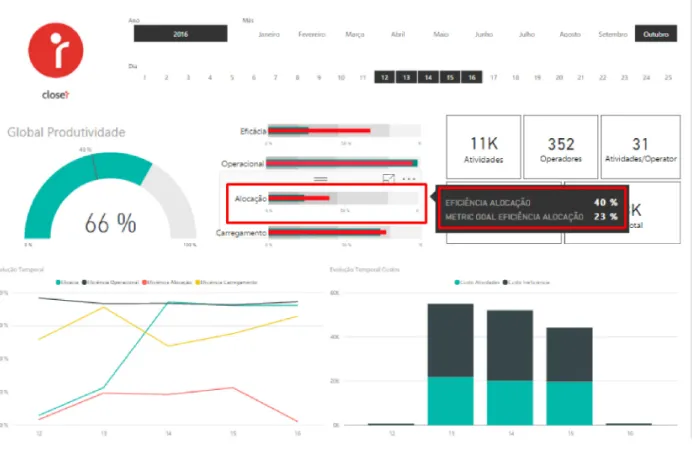
3.6. Global Indicators (Indicadores Globais)
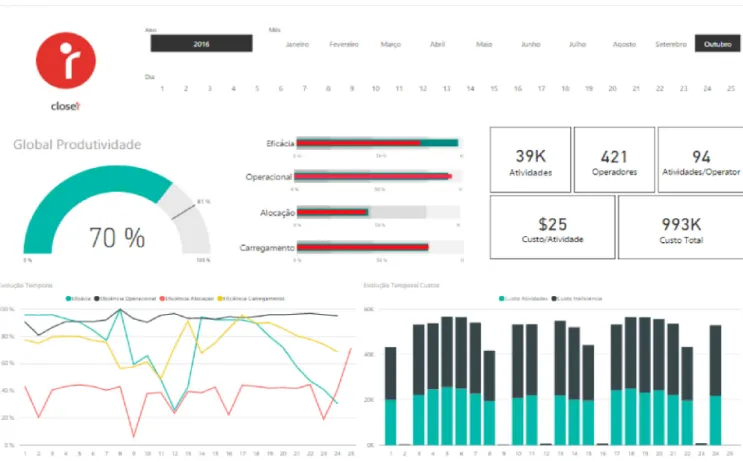
Figure 3: Indicadores Globais
This dashboard is a global indicator of the company’s performance in a given period of time. The objective of this dashboard is to provide an instant global picture of the performance of the business. All the data is filtered according to the selected period of time. This dashboard is divided into two logical parts. The upper part shows the general performance in the selected time period, whereas the lower part, the charts, highlights the performance per day.
There are time charts in the lower part, which indicate the evolution of the metrics shown in the upper part. This can help detect the possible issues in the data. The time charts have a drill down option enabled, which shows the data in a time hierarchy (for the selected period) as implemented in the time dimension table. For example, if a certain month is selected, then the drill up will show the corresponding year while the drill down will show a detailed view of each day in the month selected.
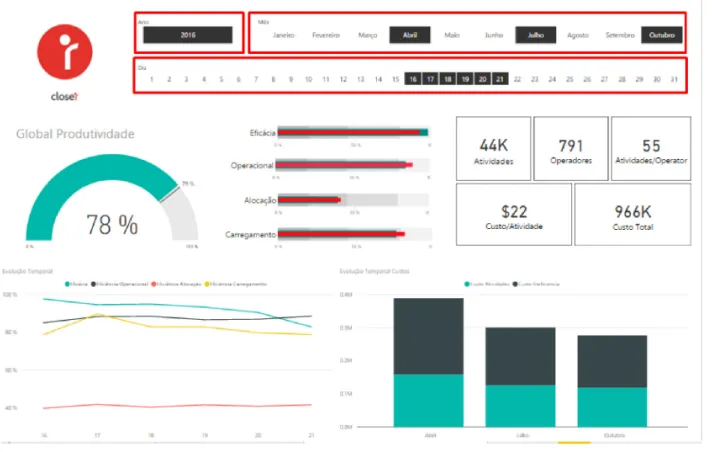
Figure 4: Time navigator
The time navigator as indicated in Figure 7 above provides a framework for one to choose a time period and the dashboard shows the performances only for the chosen time period. Multiple years/months/days can be selected at once just by clicking on them. The time period does not have be continuous, but custom chosen. For example, in the Figure 7 above, only April, July and October are selected with the days from the 16th to the 21st and the data below is filtered just for the days selected in these three months.
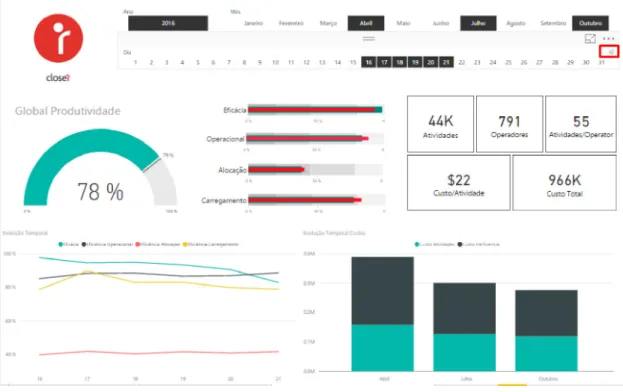
When the year/month filter is changed, the months/days selected are not cleared, however, there is an easy way to do this only by clicking the “clear selected” button in the right top
corner as shown in Figure 8 below. This applies to every part (Year, Month, Day) of the time navigator.
Figure 5: Clear selected button
3.7. Global Indicators Metrics
3.7.1. Effectiveness
![Figure 1: Power BI – Executive Dashboard [Source: Curator, 2016]](https://thumb-eu.123doks.com/thumbv2/123dok_br/19233445.968473/19.892.109.778.695.1117/figure-power-bi-executive-dashboard-source-curator.webp)
![Figure 2: Power BI – Example of Travel Analysis [Source: The Power BI Team, 2014]](https://thumb-eu.123doks.com/thumbv2/123dok_br/19233445.968473/20.892.103.813.133.557/figure-power-example-travel-analysis-source-power-team.webp)