MASTER OF SCIENCE IN
FINANCE
M
ASTERS
F
INAL
W
ORK
PROJECT
EQUITY RESEARCH
:
T
HE
G
OLDMAN
S
ACHS
G
ROUP
,
I
NC
.
F
RANCISCO
L
UÍS
F
ELISBERTO
S
UPERVISOR
:
P
ROF
.
D
OUTOR
J
OÃO
C
ARVALHO DAS
N
EVES
Acknowledgements
This is an undertaking that would not be possible without the support of several people.
To my family, especially my parents and sister, that supported me throughout my educational and now
professional paths.
To my professors, for all the dedication and knowledge they have shared with me, specially professor
Clara Raposo and professor, and project supervisor João Carvalho das Neves, for his unconditional
support and guidance over the last months.
Last but not least, to my friends and colleagues for making this an enjoyable journey. The insights from
my friend Miguel Frasco were of great help.
Thank you!
Index
Acknowledgements i
Index ii
Abstract iii
Resumo iv
Index of Figures v
Index of Tables vi
Research Snapshot 1
Investment Summary 2
Business Description 3
Macroeconomic Outlook 7
Business segment’s historical performance 9
Business segment’s Outlook 11
Financial Analysis: Consolidated 13
Forecast procedures 15
Valuation Methodologies 16
Investment Risks 20
Risks to price target analysis 22
Appendix A – Statement of Financial Position 23
Appendix B – Income Statement 25
Appendix C – Cash Flow Statement 27
Appendix D – Statement of retained earnings 28
Appendix E – Results, by business segment 29
Appendix F – DuPont Identity 32
Appendix G – Financial ratios 33
Appendix H – Excess return valuation 34
Appendix I – Multiples valuation 35
Appendix J – Credit Exposure 36
Appendix K – Credit ratings 37
Appendix L – Corporate Governance 38
References 40
Abbreviations 41
Disclosure 44
Abstract
This report encompasses a valuation of The Goldman Sachs Group, Inc. elaborated as a Master’s
of
Finance Final Work Project at ISEG
–
University of Lisbon. The study follows the format recommended
by the CFA Institute (Pinto, Henry, Robinson, and Stowe, 2010). To conduct this research, we considered
public available data on October 5
th, 2017, collected from various sources, such as company reports and
Bloomberg L.P., among others. Therefore, events after this date are not reflected in this analysis.
We decided to conduct a valuation of Goldman Sachs for two main reasons, them being: conducting
this type of work on financial service firms represents, in my opinion, a greater challenge compared to
industrial companies (as it was previously performed during the master degree); the second reason is
because, in my opinion, The Goldman Sachs Group, Inc. is one of the most interesting companies in the
world for all its history, controversies and power in the major financial markets.
To reach a recommendation, we used an Excess Return model to value the equity of the firm, as well as
a multiples analysis to complement the previous model. With a price target of $ 230.25 for YE18 and a
downside potential of -5.0% from the current price of $ 242.55, our final recommendation for The
Goldman Sachs Group, Inc. (NYSE: GS)
is “
Reduce
”.
JEL classification: G1; G2
Resumo
Este relatório contém uma avaliação do grupo financeiro
The Goldman Sachs Group, Inc., elaborado
como Projeto Final do Mestrado em Finanças do ISEG
–
Universidade de Lisboa. O estudo segue o
formato recomendado pelo
CFA Institute (Pinto, Henry, Robinson, e Stowe, 2010). Para efetuar a
avaliação, foi considerada informação pública a 5 de outubro de 2017, recolhida de diversas fontes, tais
como relatórios anuais ou
Bloomberg L.P. Consequentemente, eventos ocorridos após esta data não
são considerados nesta análise.
As razões que levaram à escolha da Goldman Sachs foram essencialmente duas: devido à complexidade
que empresas financeiras apresentam, é um maior desafio quando comparando com empresas
industriais (como realizado durante o mestrado); e é, na opinião do autor, uma das empresas mais
interessantes a nível mundial por toda a sua história, controvérsias e poder nos principais mercados
financeiros.
Para obter uma recomendação, foi utilizado um modelo de Excesso de Retorno para valorizar o capital
próprio do banco e uma avaliação por múltiplos para complementar o modelo principal. Com um
preço-alvo de $ 230.25 e potencial de desvalorização de -5.0% a partir do preço atual de $ 242.55, a nossa
recomendação final para The Goldman Sachs Group, Inc. (NYSE:
GS) é “Reduzir”.
Classificação JEL: G1; G2
Index of Figures
Figure 1 – Historical share price 1
Figure 2 – Monte Carlo simulation 1
Figure 3 – Total revenues, by location 2
Figure 4 – FICC revenues 2
Figure 5 – Brand value 2
Figure 6 – Global locations 3
Figure 7 – End-of-year number of employees 3
Figure 8 – Largest common shareholders 4
Figure 9 – ISS Governance QualityScoreTM 4
Figure 10 –Porter’s five forces 5
Figure 11 – Real GDP growth, by country 7
Figure 12 – Year-end inflation rate, by country 7
Figure 13 – Unemployment rate, by country 7
Figure 14 – Debt-to-GDP ratio, by country 8
Figure 15 –IB’s revenues, by source 9
Figure 16 – Investment Banking bridge FY15A-FY16A and 6m16A-6m17A 9
Figure 17 –ICS’s revenues, by source 9
Figure 18 –IM’s revenues, by source 9
Figure 19 – Institutional Client Services bridge FY15A-FY16A and 6m16A-6m17A 9
Figure 20 –I&L’s revenues, by source 10
Figure 21 – Investment Management bridge FY15A-FY16A and 6m16A-6m17A 10
Figure 22 – Consolidated revenue, by segment 10
Figure 23 – Investing & Lending FY15A-FY16A and 6m16A-6m17A 10
Figure 24 – EBT margin 10
Figure 25 – VIX Index 52-week performance 11
Figure 26 – IB industry degree of rivalry 11
Figure 27 – ICS industry degree of rivalry 11
Figure 28 – IM industry degree of rivalry 12
Figure 29 – I&L industry degree of rivalry 12
Figure 30 – Consolidated EBITDA bridge FY15A 13
Figure 31 – Consolidated EBITDA bridge FY16A 13
Figure 32 – Minimum capital requirements 14
Figure 33 – IB revenue forecast 15
Figure 34 – ICS revenue forecast 15
Figure 35 – I&L revenue forecast 15
Figure 36 – IM revenue forecast 15
Figure 37 – Average daily VaR 20
Figure 38 –GS’s risk matrix 20
Figure 39 – YE18 Price Target Sensitivity 22
Figure 40 –GS’s four business segments 38
Figure 41 –GS’s organizational chart 39
Index of Tables
Table 1 –Analyst’s risk assessment 1
Table 2 – FY16 key metrics 1
Table 3 – Consolidated revenues 1
Table 4 – Excess return valuation 1
Table 5 – Multiples valuation 1
Table 6 – Valuation sensitivity analysis 1
Table 7 – ESG Grades for Goldman Sachs 4
Table 8 – NEOs compensation 4
Table 9 – SWOT analysis 5
Table 10 – 6m17 key metrics 14
Table 11 – Capital ratios – FY16 and 6m17 14
Table 12 –GS’s credit exposure, by type and region 20
Table 13 – Decomposition of GCLA – 6m17A 21
Table 14 – Investment rating, by risk 22
Table 15 –GS’s valuation sensitivity analysis 22
Table 16 –GS’s upside potential sensitivity analysis 22
Table 17 – Monte Carlo price percentiles 22
Table 18 – Statement of financial position (consolidated) 23
Table 19 – Common size statement of financial position (consolidated) 24
Table 20 – Income statement (consolidated) 25
Table 21 – Common size income statement (consolidated) 26
Table 22 – Cash Flow statement (consolidated) 27
Table 23 – Statement of retained earnings 28
Table 24 – Total assets under supervision 29
Table 25 – IM segment results 29
Table 26 – IB segment results 29
Table 27 – ICS segment results (decomposed) 30
Table 28 – ICS segment results 30
Table 29 – I&L segment results 31
Table 30 – Total net interest income 31
Table 31 – Total results, by segment 31
Table 32 –GS’s DuPont identity 32
Table 33 – Capital ratios and other financial ratios 33
Table 34 – CET1 decomposition – 6m17A 33
Table 35 – GS Excess return valuation 34
Table 36 – GS Valuation through multiples 35
Table 37 – GS Credit exposure 36
Table 38 –Credit rating for Group’s major entities 37
Table 39 – Executive officers of The Goldman Sachs Group, Inc. 38
FY18 Price Target of $ 230.25 (- 5.0%); Recommendation is to Reduce
Goldman Sachs is an American-based global leading investment bank, present in the major financial centers around the globe. The business is divided into four business segments: Investment Banking (IB); Investment Management (IM); Institutional Client Services (ICS); and Investing & Lending (IL).
Ticker NYSE: GS 52-Wk High $252,89 Shares Outstg. 386.88m 5 Year Beta 1.273
Website www.goldmansachs.com 52-Wk Low $166,40 Market Cap. $93,57bn Float % 90,20%
Industry Diversified Financials Current Price $242,80 Dividend Yield 1,25% Institut. Own. % 74,07%
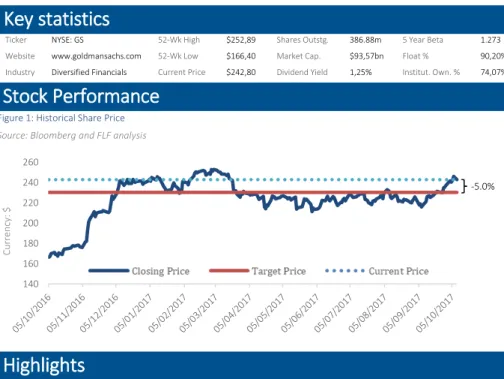
Figure 1: Historical Share Price
Source: Bloomberg and FLF analysis
▪ With a price target of $ 230.25 and a downside potential of -5.0% from current price of $ 242.55, our recommendation for The Goldman Sachs Group, Inc. stands for Reduce. We estimate EPS of $ 16.09 in FY17F and $ 16.15 in FY18F, contrasting to $ 16.58 in FY16A and $ 12.40 in FY15A. The conclusions from our Market Approach (multiples) supports our conclusion from our DCF Approach. By observing the results of the Market Approach, we conclude that GS is undervalued when comparing to its peers by 13%. This is justified, in our opinion, by the recent performance of some of GS’s core businesses.
▪ In an attempt to find new streams of revenue, as its core businesses are pressed by tight regulations, the company launched Marcus by Goldman Sachs. Going head to head against retail banks and the new fintech firms, which are emerging, this shift to digital platforms marks the entry in the consumer lending venture. Marcus offers personal loans of up to $30.000 and is a step further from the online savings accounts starting at $1. We expect these platforms to boost deposits and interest revenues in the next years.
▪ GS presented a healthy performance throughout the first two quarters, beating investors’
estimates. Net revenues in FY17 were $15.91 billion, 12% higher than FY16, improving the pre-tax margin by 340 basis points for 31.7%. Debt underwriting and investment management had one of its best performances, however the FICC unit registered an underwhelming result. The firm also maintained strong liquidity and capital ratios. Building on the positive results of the first two quarters, we forecast annual revenues to increase around 4% in FY17, and from this year onwards 1.53% CAGR until FY21. It is our belief that that the firm will focus on restructuring troublesome business units and continue to invest in new technologies, products and services.
140 160 180 200 220 240 260
A bank for the other 99%
Key statistics
Stock Performance
FY16 YoY Δ
Net Revenues $30.6bn (9%) Pre-Tax Earnings $10.3 +17%
Net Income $7.4bn +22%
Diluted Eps $16.29 +34%
ROE 9.4% +200bps
BVPS $177.09 +6.7%
Source: Statutory reports
in $m 1Q 2Q 3Q 4Q FY
17A 8.026 7.887 - - 31.826 16A 6.338 7.932 8.168 8.170 30.608 15A 10.617 9.069 6.861 7.273 33.820 14A 9.328 9.125 8.387 7.688 34.528 13A 10.090 8.612 6.722 8.782 34.206 12A 9.949 6.627 8.351 9.236 34.163 Source: Statutory reports and FLF analysis
Highlights
Equity Invested $ 75.244 PV of Equity Excess Return 17.279 Value of Equity 92.523 Number of shares 401,830 Value Per Share $ 230,25
Current price $ 242,55 Upside Potential -5%
Source: Bloomberg and FLF analysis
Multiple Mean Implied Equity value
P/E FY16A 13,54 $ 224,59
P/E FY17F 13,72 220,68
P/B FY16A 1,37 277,85
P/B FY17F 1,36 286,53
Fair Value $ 252,41 Current Price $ 242,55 Upside Potential 4%
Source: Bloomberg and FLF analysis
Reduce
Medium risk
5 October 2017Portugal
Table 1: Analyst’s Risk Assessment
Source: FLF analysis
Low Medium High
Our risk assessment reflects intense internal competition across all markets, but protected from the outside by regulation and high costs.
The Goldman Sachs Group, Inc.
Table 3: Consolidated Revenues
Table 4: Excess return valuation
Figure 2: Monte Carlo Simulation Table 5: Multiples Valuation
Cu rre nc y: $ -5.0% 0 1000 2000 3000 4000 5000 6000 1
21 140 159 177 196 215 342 253 272 291 309 328 347
Price Target Mean: $236.99 ERM: $230.25 Current: $242.55 Fre qu enc y
Source: Cristal Ball software and FLF analysis Table 2: FY16 Key metrics
Market risk premium
3.00% 3,50% 4,00% 4.50% 5.00% 5,50% 6,00%
R is k-fr ee r at
e 1,82% 370,73 318,56 278,94 247,71 222,36 201,29 183,43
2,02% 351,57 304,2 267,74 238,69 214,91 195,01 178,05
2,22% 334,25 291,03 257,35 230,25 207,90 189,07 172,93
2,42% 318,52 278,91 247,69 222,34 201,27 183,42 168,04
2,62% 304,17 267,71 238,67 214,90 195.00 178,04 163,36
Table 6: Valuation sensitivity analysis Source: Cristal Ball software and FLF analysis
0 2 4 6 8 10 12 FY 0 7A FY 0 8A FY 0 9A FY 1 0A FY 1 1A FY 1 2A FY 1 3A FY 1 4A FY 1 5A FY 1 6A $bn
With a price target of $ 230.25 for YE18F and a downside potential of -5.0% from current price $242.80, our recommendation for Goldman Sachs is Reduce. GS’s stock growth is expected to be low to moderate, following the trend from past months, for two reasons. Firstly, although GS is undervalued by -13% when comparing to its peers, with respect to equity price multiples, we expect it to continue that way, and secondly, it currently trades close to intrinsic value.
Being a global business, with a presence in all major financial centers has its own advantages and disadvantages. Diversification of revenue sources and access to markets are some of the advantages that one needs to acknowledge, however the changing laws and regulations that the company faces in the different parts of the globe where they operate represent a challenge for Goldman Sachs which can have a negative impact on the company. By analyzing existing investments, we expect the relative size of operations by region of activity to remain close to current and historical values (Figure 3).
Valuation methods
The target price results from the application of an absolute valuation method to the equity, more specifically, the Excess Return Model. For a variety of reasons specified in the following sections of the present report, the analysis was conducted on a consolidated level. To support the conclusions reached with this model, we conducted a valuation through a relative valuation method, using equally weighted multiple comparables. A set of criteria was applied when selecting the peer comparable companies to ensure that this was a solid way to support the conclusions of the much robust discount method.
Recent stock performance
The stock, which is present in the S&P 500, have ranged from $166,4 to $252,89 in the past 52-weeks, and has traded around the target price and below the current price, for the last 25 weeks.
Rebuilding FICC
In the first half of the year, revenues from the worrying Fixed Income, Currency and Commodities unit (FICC), a core business of the firm, suffered a significant decline (40%) compared to its homologous period, presenting a result of $2.85 billion (Figure 4). This figure was $9.4 billion in 2010. With the current plan in place to cut costs, enter new areas and restructure the division, we expect revenues to return to positive yearly variations in 2019.
Risks to the investment case
Investors should be aware of threats that may impact the business. Key risks to our estimates and price target include regulatory changes, unexpected changes in interest rates, slowing of global growth, and decreases in asset values that can impact, among others, fees from asset-management.
Position in the Industry
In an industry where reputation and relationships play big roles, Goldman Sachs’ most valuable asset is its brand (Figure 5). Since the 2008 crisis, the brand has suffered several setbacks with reputational damage, nonetheless, was able, to a certain degree, to conjure an image of power to the markets. The launch of Marcus represents the company’s attempt to adopt a strategy more relatable to the masses. Innovation in new products and services, sustainable corporate governance policies
Investment Summary
0 2,000 4,000 6,000 8,000 10,000 Cu rre nc y: $ m59% 58% 58%
56%
60%
25% 26% 26% 27% 26%
16% 16% 16% 17%
14% 0% 10% 20% 30% 40% 50% 60% 70%
FY12A FY13A FY14A FY15A FY16A
Americas EMEA Asia
Figure 3
Total revenues, by location
Source: Statutory reports and FLF analysis
Figure 4 FICC Revenues
Source: Statutory reports and FLF analysis
and transparency will be determinant to successfully demonstrate this new image to the market.
The Goldman Sachs Group, Inc. (NYSE: GS) is an American financial company based in the State of Delaware, which, together with its consolidated subsidiaries, provides a diversified array of financial services to multiple clients, such as: individuals; financial institutions; corporations; and governments. Founded in 1869, the firm is a leading investment management, securities and investment banking firm with presence in all major financial centers around the globe.
The firm1 is a financial holding as well as a bank holding company regulated by the
Federal Reserve System, which is supervised by the Federal Reserve Board. It is through GS Bank USA, the key U.S. bank subsidiary, that the majority of the firm’s consumer-oriented activities are partially or entirely conducted. Goldman Sachs International (GSI) and Goldman Sachs International Bank (GSIB) are the main E.U. operational branches, currently headquartered in the U.K.
As of the end of 2016, the firm has offices in more than 30 countries distributed by the North and South Americas, EMEA and Asia (Figures 6 and 7). Roughly 47% of the firm’s staff is based outside the Americas and 40% of revenues in 2016 were also generated outside this region.
Goldman Sachs divides its activities in four business segments: Investment Banking, Institutional Client Services (ICS), Investing & Lending and Investment Management.
Investment Banking provides Financial Advisory services concerning mergers and acquisitions, restructurings, divestitures, spin-offs, corporate defense activities and risk management. The firm also offers equity and debt underwriting such as public offerings, capital raises and private placements of equity and debt instruments.
In Institutional Client Services, the firm acts as a market maker and supports client transactions in currency, equity, fixed income and commodity products, mostly with institutional investors. It also provides brokerage services like financing and securities lending, and operates in the major stock and derivatives exchanges worldwide as a market maker and clearing agent. This is the most important business segment for the firm.
Through the Investment & Lending segment, GS takes a long-term investing approach in infrastructure, real estate, corporate and other equity and debt-related investments. It also provides banking services such as consumer lending, through the new online platform Marcus by Goldman Sachs, deposits and corporate lending.
The Investment Management business segment provides wealth advisory services to high-net-worth clients, including portfolio management, brokerage and financial counseling. It offers also several investment products across the major asset classes and investment management services to its individual and institutional clients.
The Group prepares and presents its consolidated financial statements in accordance with the U.S. GAAP and has investment grade rating (Appendix K).
1When referring to “Goldman Sachs”, the “firm”, the “group”and “GS”, it is to be understood The Goldman Sachs
Group, Inc. (Group Inc., or parent company), and its consolidated subsidiaries
Business Description
32.4 32.9
34 36.8
34.4
30 31 32 33 34 35 36 37 38
FY12A FY13A FY14A FY15A FY16A
# th
o
us
and
e
mploy
ee
s
Figure 6 Global locations
Source: Company website
Figure 7
End-of-year number of employees
Ownership Structure
The ownership of GS is divided in Common Shareholders and Preferred Shareholders. The holders of the first have the right to participate and vote in general shareholders meetings, profit sharing, obtain information, among others. The holders of the latter, have the same rights with the main exceptions of having preference in dividends, and do not have the right to vote in general meetings.
According to the latest 13F filling, as of June 29th, 2017, institutional holdings account
for 74% of the total common shareholder structure. A total of 1.567 institutions, of which 1.293 are institutional holders, held Goldman Sachs’ common stock (Figure 8). Insiders hold less than 1% of total common shares outstanding.
Corporate Governance
Goldman Sachs follows the Anglo-Saxon model of corporate governance in which the shareholders elect the members of the Board of Directors. The latter then elects the executive officers that, alongside the management committee, run the day-to-day operations of the firm. The Board of Directors has established five Committees: Audit; Compensation; Corporate Governance & Nominating; Risk; and Public Responsibilities. Throughout 2016 and first half of 2017, numerous changes were done in the executive ranks, as well as an addition to the Board of Directors. The latter is composed by eleven members, including a Lead Director, that ensures an open and free discussion among its independent members, and the Chairman. From these eleven members, one is an insider – Lloyd C. Blankfein – and two are former GS top employees. The rest of the members are believed to be independent (Appendix L).
Given the complexity of the business, the shareholder structure, the number of committees and the size of the company, I believe that the board has a high level of independence and objectivity to fulfill its responsibilities to the shareholders.
According to the ISS Governance QualityScoreTM (Figure 9), Goldman Sachs has a
decile score of 7 out of 10. In this methodology, lower scores represent lower governance risk. This indicates that GS has a moderate to high governance risk.
Goldman Sachs was one of first financial institutions to acknowledge the importance of environmental sustainability. In 2015 it established its Environmental Policy Framework, thus formalizing its commitment to mobilize capital to scale up clean energy and foster sustainable economic growth.
According to Bloomberg (Table 7), the company demonstrates an above average performance concerning environmental areas, neutral in social issues and has a below average performance in terms of governance, when compared to its peers.
NEOs Compensation
Public companies are required by the S.E.C. to determine every year which executives are named executive officers (NEOs), under the proxy disclosure rules. These are the company’s CEO, CFO and the three most highly compensated executive officers other than the CEO and CFO. They are also obligated to disclose the annual compensation of the NEOs. Regarding Goldman Sachs they were Lloyd C. Blankfein, Gary D. Cohn, Harvey M. Schwartz, Michael S. Sherwood and Mark Schwartz for both 2015 and 2016 (Table 8).
“RobecoSAM Rank” 75
“Sustainalytics Rank” 87.7
“ISS QualityScore” 7
“CDP Climate Score” 8
“Bloomberg ESG Disclosure” 48.2
FY16A FY15A
Salary 14,85 15,15
Bonus 19,44 22,64
Stock awards 61,07 66,54
Non-equity incentive plan 47,00 0,00
Change in pension value 0,25 0,03
All other compensation 8,73 8,16
Total compensation 151,32 112,51
0 2 4 6 8 10
Board Structure
Compensation
Shareholder Rights Audit & Risk
Oversight
Table 8
NEOs Compensation
Source: Statutory reports and FLF analysis Table 7
ESG grades for Goldman Sachs
Source: Bloomberg Figure 9
ISS Governance QualityScoreTM Source: ISS and FLF analysis
Figure 8
Largest Common Shareholders
Goldman Sachs Competitive Position
Table 9
SWOT Analysis
Source: FLF Analysis
Strengths Weaknesses
. Strong brand and presence across the major financial centers;
. Diverse operations with wide array of financial products and services provided;
. High R&D, comparing to competitors, and capacity to recruit and retain talent;
. Strong financial position.
. Stained public image after bribery & fraud cases and litigation issues;
. Market and economic fluctuations produce variable revenues.
Opportunities Threats
. Expansion in emerging markets;
. Cross selling opportunities;
. Consolidating industry;
. Growth potential in the investment management and lending segments.
. Uncertainty on regulations;
. Volatility in financial markets;
. Variability in interest rates; . Possibility of conflicts of interest.
Porter
’s Five Forces
It is important to retain that although Goldman Sachs is a global group with presence in all the major financial centers, it is still an American banking group subject primarily to American law and regulations. Additionally, all the big players and competitors of GS in the investment banking business are either American or international, with presence in the American market. These reasons allow for the following analysis to be focused on the American market without losing the global overview of the entire company (Figure 10).
Bargaining Power of Consumers – Low (2)
Goldman Sachs’ clients, especially HNWI, don’t have a lot of bargaining power as they are highly dependent on the company’s services. These services have a large value added. Although GS can survive the loss of several non-institutional clients, it offers complementary products and services to address this risk.
Bargaining Power of Suppliers – Significant (3)
Being a supplier in the Investment Banking industry is a very subjective concept. Goldman Sachs, as all firms, has several companies that supply services to the bank (databases, communications, among others). These suppliers don’t have much bargaining power. However, the most important inputs to the business are knowledge, where competition to recruit and retain highly skilled employees is very high, and capital. This capital can arise from depositors and other creditors, investors in the firm, other banks and the Federal Reserve System. Depositors and other
Figure 10
Porter’s Five Forces
Source: FLF Analysis
0 1 2 3 4 Bargaining
Power of Consumers
Bargaining Power of Suppliers
Industry Rivalry Threat of New
creditors individually don’t possess great bargaining power but, as a whole, can be very important for both the capitalization and liquidity of the bank. A large firm that is issuing new stock is a kind of product supplier, as this is the input that GS needs to sell its services to other customers, making the line that separates a supplier and a consumer very difficult to differentiate. Other banks and financial institutions that offer liquidity don’t have much bargain power because the duration of such commitments is very low. The Federal Reserve System, as a supplier of liquidity and guidance, and ultimate regulator holds a great bargaining power over GS. There are, however, institutions that, although not direct suppliers, have a greater power over the products and input costs of Goldman Sachs – the Congress and the Treasury Department. These institutions, alongside the Fed, decide which products and services can be sold, how and to whom they are marketed and what compensations can the company accept for them.
Industry Rivalry – Significant (4)
For several years, this large industry has been increasing its concentration and the major players have been able to secure a high market share. Yet, there are still many competitors within this same market, and unnoticeable differentiation on products and services that banks provide. This is due to regulatory constraints as well as low switching costs for the clients. Reputation and previous relationships are therefore critical to succeed in this market.
In respect to its four business segments, the main competitors of Goldman Sachs are JPMorgan Chase & Co, Deutsche Bank AG and Morgan Stanley. The latter is considered GS’s main rival due to its similarity in terms of size and operations, and is frequently used while evaluating GS’s results relatively to its peers.
Threat of New Entrants – Low (2)
Through the signing of the Dodd-Frank Act in 2010, it became harder for new institutions to enter this already concentrated market. Among other reasons, new companies face increasing obstacles when entering new markets, such as: intense regulations; difficulty in developing and establish network of contacts; managing reputation; infrastructures; and specialized staff. All these reasons can become a source of cost inefficiencies for new companies. Thus, the probability of existing companies that are already well established to enter a new market is higher than for those which are only now emerging.
Threat of Substitutes – Moderate (3)
In terms of its core businesses, the possibility for new products or services to emerge is very limited due to the regulations in place. I&L is a business segment that is expanding, however it faces the threats of new and more technological products and services. The development of FinTech companies is shaking the industry with new products that have lower costs and are easier for consumers. It is important to emphasize that Goldman Sachs is investing heavily in new technologies and products, such as the new platform Marcus by Goldman Sachs, in an attempt to establish themselves in this new era of FinTech products.
Global
The global economy has been gradually gaining strength, and it will most likely continue to do so over the next few years (Figures 11 through 14). Global GDP growth should see an increase from 2.42% in 2016 to 2.88% in 2017 and remain close to 3% until 2022 – driven by the countries in the Asian continent. China and India will continue with vigorous growth but other large emerging countries like the Russian Federation, Brazil and Argentina will return to a period of growth from 2017 onwards, thus exiting recession. Although the growth outlook is favorable due to recovery in investment and structural reforms, American and European countries will remain in the tail of growth, with rates close to 2% annually.
Financial markets have also improved, as reflected in low bond yields and high equity prices.
Although this is clearly an indication of positive outlook for the following years, these developments hold significant uncertainties that should be taken into consideration, such as the rise of protectionism, complacency of policymakers or the break of military conflicts.
United States
U.S. real GDP growth rate is expected to grow to 2.30% in 2017 and 2.50% in 2018 from the 1.60% mark presented in 2016, but returning to values below the 2.00% threshold after 2019. Inflation is anticipated to stay above the target of 2.00% and unemployment will continue to stay around natural levels close to 5,00%, leading to further increases in the main refinancing operations rate from the U.S. Federal Reserve. This rate is expected to rise to 1.50% before the end of 2017, return to regular levels of 2.00% in 2018, and is expected that in 2019 this rate will rise to 3.00%. Debt levels are above 100% of GDP and will continue to rise from 107.35% in 2016 to expected values above 115.00% in 2021.
Europe
In the Euro Area, real GDP growth will remain close to 1.50% per year and inflation will continue its growing path to the ECB’s target, close to 2,00%. ECB will maintain its main refinancing operations rate at 0.00% and the pace of its monthly asset purchase at €60 billion until the end of 2017, and later if necessary. As inflation approaches its target and economic indicators across the Euro Area improve its sustainability, it is expectable that the current QE program decrease its monthly purchases and eventually cease to exist, and the main refinancing rate should start to increase to normal values. Unemployment will decrease past the 10.00% mark in 2017 and continue to do so but will remain high. Debt levels are expected to steadily decrease from around 90.00% of GDP in 2017 to close to 80.00% of GDP in 2022.
In the U.K., the economy will take a hit after the decision to leave the European Union. Real GDP growth is expected to slow down in the next two years from 1,86% in 2016 to 1,46% in 2018, but increase to values close to 1,90% by 2022. Inflation will take an opposite direction and will decrease from an estimated 2.75% annual inflation in 2017 to 2.00% in 2021. As well as in the Euro Area, interest rates are at historical low levels
Macroeconomic Outlook
0.00% 1.00% 2.00% 3.00% 4.00% 5.00% 6.00%
FY16A FY17F FY18F FY19F FY20F FY21F 0.00%
1.00% 2.00% 3.00% 4.00% 5.00% 6.00% 7.00% 8.00% 9.00%
FY16A FY17F FY18F FY19F FY20F FY21F
Figure 11
Real GDP growth, by country
Source: IMF and FLF analysis
Figure 12
Year-end Inflation rate, by country
Source: IMF and FLF analysis
2.50% 3.50% 4.50% 5.50% 6.50% 7.50% 8.50% 9.50% 10.50%
FY16A FY17F FY18F FY19F FY20F FY21F
Figure 13
Unemployment rate, by country
(0.25%, in the UK) and a QE program is in place that should begin to be tapered after the end of 2017.
Asia
The Japanese economy has been characterized by substantial amounts of debt, low unemployment rates, slow real growth rates and years of low inflation with periods of deflation in between. Debt levels will decrease but remain above 200% of GDP, growth of GDP will have a moderate recovery and inflation is predicted to cross 1.00% in 2018, but with difficulties to reach the 2.00% target.
In China, real GDP growth is projected to continue to deaccelerate from 6,70% in 2016 to close to 5,7% in 2022 and inflation is expected to grow to values around 3,00% by 2020. Government debt is set to increase to values close to 60.00% of GDP and unemployment will remain low.
As the Chinese economy slows down, the growth of the Indian economy is expected to accelerate even more from 6.83% to values above 8.00% in 2021 while retaining low unemployment levels and acceptable decreasing values of debt. Inflation is likely to remain close to 5%.
40.00% 90.00% 140.00% 190.00% 240.00%
FY16A FY17F FY18F FY19F FY20F FY21F
Figure 14
Debt-to-GDP ratio, by country
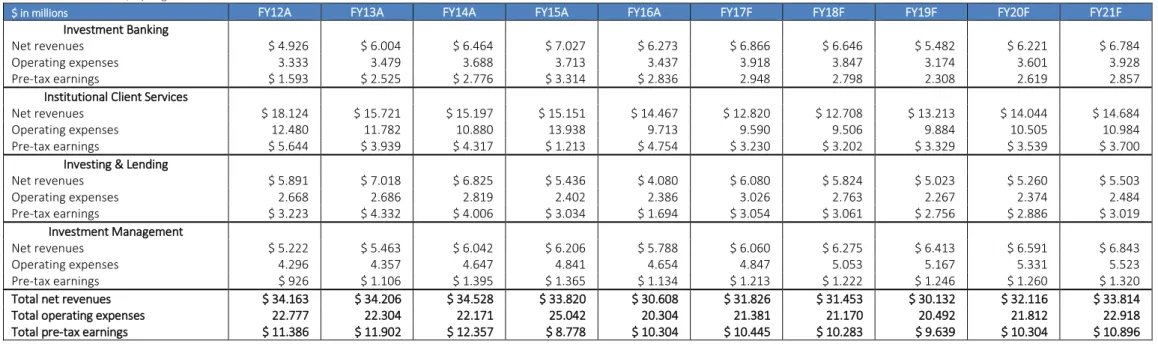
Investment Banking
IB´s revenues (Figure 15) demonstrated an upwards trend from $4.9bn in FY12 to $7.0bn in FY15. FY16 saw a decrease of revenues to $6.3bn, mainly, due to a decrease in financial advisory fees. We emphasize the impact of the increase in financial advisory fees (+48%) in supporting the growth of this segment, since revenues from underwriting, especially equity, increased by just 13% from FY12 to FY16.
Following the revenue tendency in those years, pre-tax earnings increased considerably from $1.6bn to $2.8bn, representing a jump of 78% due to controlled operating expenses that remained close to $3.5bn (Figure 16).
Institutional Client Services
In the opposite direction, ICS’s revenues (Figure 17) decreased from FY12 ($18.1bn) to FY16 ($14.5bn). Equity services’ revenue decreased more than $1bn, yet FICC had a more expressive decrease – almost $2.5bn in the same period.
Following measures to control costs, operating expenses decreased from $12.5bn in FY12 to $9.7bn in FY16, resulting in pre-tax earnings of $5.6bn and $4.8bn in FY12 and FY16, respectively (Figure 19).
Business segment’s historical performance
Figure 16
Investment Banking bridge FY15A-FY16A and 6m16A-6m17A
Source: Statutory reports and Team analysis
Figure 19
Institutional Client Services bridge FY15A-FY16A and 6m16A-6m17A
Source: Statutory reports and FLF analysis
1, 97 5 1, 97 8 2, 47 4 3, 47 0 2, 93 2 987 1, 65 9 1, 75 0 1, 54 6 891 1, 96 4 2, 36 7 2, 24 0 2, 01 1 2, 45 0 0 500 1,000 1,500 2,000 2,500 3,000 3,500 4,000
FY12A FY13A FY14A FY15A FY16A
Cu rre nc y: $ bn
Fin. Advisory Eq. underw. Debt underw.
4,
10
5
4,
38
6 4,80
0 4, 88 7 4, 79 8
701 662 776 780
421
416 415 466 539 569
0 1,000 2,000 3,000 4,000 5,000 6,000
FY12A FY13A FY14A FY15A FY16A
Cu rre nc y: $ bn
Manag. & other fees Incent. fees Transaction rev.
Figure 15
IB’s revenue, by source
Source: Statutory reports and FLF analysis
Figure 18
IM’s revenue by source
Source: Statutory reports and FLF analysis Figure 17
ICS’s revenue, by source
Source: Statutory reports and FLF analysis
9, 91 4 8, 65 1 8, 46 1 7, 32 2 7, 55 6 3, 17 1 2, 59 4 2, 07
9 3,02
8 2, 19 4 3, 05 3 3, 10 3 3, 15 3 3, 15 6 3, 07 8 1, 98 6 1, 37 3 1, 50 4 1, 64 5 1, 63 9 0 2,000 4,000 6,000 8,000 10,000 12,000
FY12A FY13A FY14A FY15A FY16A
Cu rre nc y: $ bn
FICC Eq. client execution
Commissions and fees Securities services
Investment management
Revenues from IM (Figure 18) grew from $5.2bn in FY12 to $6.0bn in FY14 and $6.2bn in FY15. However, revenues decreased in FY16 to $5.8bn. This growth was mainly due to an increase in management and other fees, and a smaller contribution of transaction revenues which resulted from a surge in AUS.
Operating expenses also increased in this period but at a slower rate, from $4.3bn to $4.7bn, resulting in pre-tax earnings of $0.9bn and $1.1bn in FY12 and FY16, respectively (Figure 21).
Investing & Lending
Following a great FY13, revenues of I&L (Figure 20) started to decrease. Revenues stood at $5.9bn in FY12 but declined to $4.1bn in FY16. A decline in revenues from equity securities investment of $1.3bn was the main reason for the result, even though revenues from debt securities and loans also decreased.
Operating expenses were reduced in $300m from the $2.7bn in FY12 to the $2.4bn in FY16 ensuing pre-tax earnings of $3.2bn and $1.7bn in FY12 and FY16 respectively (Figure 23).
Figure 21
Investment Management bridge FY15A-FY16A and 6m16A-6m17A
Source: Statutory reports and FLF analysis
Figure 23
Investment & Lending bridge FY15A-FY16A and 6m16A-6m17A
Source: Statutory reports and FLF analysis
3, 92 2 4, 96 2 4, 57 9 3, 78 1 2, 57 3 1, 96 9 2, 05 6 2, 24 6 1, 65 5 1, 50 7 0 1,000 2,000 3,000 4,000 5,000 6,000
FY12A FY13A FY14A FY15A FY16A
Cu rre nc y: $ bn
Equity securities Debt securities & loans
Figure 20
I&L’s revenue, by source
Source: Statutory reports and FLF analysis
0% 10% 20% 30% 40% 50% 60% 70% 80% 90% 100%
FY12A FY13A FY14A FY15A FY16A
IB ICS IM I&L
Figure 22
Consolidated revenue, by source
Source: Statutory reports and FLF analysis
0% 10% 20% 30% 40% 50% 60% 70% 80% 90% 100%
FY12A FY13A FY14A FY15A FY16A
IB ICS IM I&L
Figure 24 EBT margin
Source: Statutory reports and FLF analysis
We expect several main factors to impact the financial markets, especially in the U.S. and Europe, in the following years:
• Brexit negotiations started in March of 2017 and should be completed in 2019. Depending on the conditions of the deal, the economic and financial landscape in Europe might change.
• Stock valuation appears to be inflated by common metrics, such as the P/E ratio. On a cyclically adjusted basis, U.S. stocks have only been this expensive two times before –preceding the 1929 market crash and in the “dotcom” bubble. Similar situation is happening in the UK;
• The removal of stimulus (Quantitative easing) by the Federal Reserve and the European Central bank will drive global bond yields to higher levels, therefore, diminishing the attractiveness of riskier assets, such as stocks; • Volatility – as measured by the VIX Index, computed by the CBOE (Figure 25)
– as been constantly at extremely low values. Low volatility during large periods can be seen as the “calm before the storm”. Empirical evidence has shown that volatility is mean reverting, however the time that it will take to revert is unknown. Hence, earnings will continue to improve consistently or stock prices will decline.
Based on these factors, we don’t expect a market crash in the markets, but a correction in stock prices. This should occur during 2019, but the markets shall return to normal levels in the immediate future.
Investment Banking
We have a moderate outlook for the Investment Banking sector (Figure 26).
After a great second half of 2015 filled with megadeals, pushing global M&A deal values to the highest level since 2007, 2016 and 2017 have seen a decrease in deal making due to uncertainty at political and economic levels in several key regions. We expect this uncertainty to carry on and, once clarity emerges in key countries, M&A activity should start to increase again. Goldman Sachs, alongside the other 4 largest U.S. investment banks, have held the largest global market share among its peers in M&A. With the increase in M&A action in China, where these banks do not hold an expressive presence, these market share will decrease leading to potentially lower revenues.
We expect IPO transactions and debt offerings to follow a similar pattern, being somewhat impacted by the ending of easy money policies in the U.S. and E.U.
Institutional Client Services
We maintain a moderate stance towards ICS (Figure 27).
Trading income for investment banks peaked around 2010 during the financial crisis. At this point banks had more freedom and were subject to much less regulatory constraints. Since then, much has changed: technological developments have decreased human influence; regulation separated and diminished the scope of the business; but most importantly, behavior changes – clients are more selective and the banks learned from the mistakes made in the past. From revenues around $100 billion, the twelve largest investment banks, now make $70 billion, despite the fact that the economy has grown. We expect market revenues from FICC to continue to decrease in the following years leading to an adjustment of strategies, and market
Business segment’s Outlook
0 1 2 3 4 5 Competitor size Similarity of players
Easy to expand
Number of players Low switching costs Undifferentiated product Figure 25
VIX Index 52-week performance
Source: CBOE and FLF analysis
Figure 26
IB industry degree of rivalry
Source: FLF analysis
Figure 27
ICS industry degree of rivalry
Source: FLF analysis
0 1 2 3 4 5 Competitor size Similarity of players
Easy to expand
orientation. Some firms will downsize or exit the market increasing the market share of the resistant companies.
Despite the low level of concentration, the brokerage industry is becoming increasingly concentrated. Technological advancements will continue to provide economies of scale and the tendency is to bundle other services provided by the firms, offering better and differentiated services to clients.
Investment Management
Our attitude towards the future of IB is positive (Figure 28).
This is an industry that will suffer many changes in the next years, and only the most adaptable firms will succeed. The volume of investable assets is set to grow by a yearly compound growth rate of almost 6% till 2020, from the current $64 trillion to $100 trillion, due to an increase of HNWIs, SWFs and individual pension plans. Alongside the rising assets, commercial and regulatory costs of funds will rise, putting pressure on fees, technological innovation and economies of scale so that banks remain competitive. Transparency and harmonization of regulatory requirements will be progressively harmonized around the globe. Alternative investments will become less alternative and, together with passive products, will account for 35% of assets managed by the industry, as the separation between beta and alpha will lead investors to allocate higher portions of their portfolios to low fee and broader beta market exposure.
For the bank, products offered to clients will change in favor of low fee portfolios (average effective management fee will continue to decrease) and an alternative way of growing will continue to be the acquisition of smaller funds.
Investing & Lending
Outlook for the I&L segment is moderate (Figure 29).
Revenues from Investing are directly dependent on market performance. Therefore, and according to our estimates stated above, we expect a decrease in revenues in the next couple of years with a recovery in the subsequent years.
A lot is changing in the retail lending landscape – demographics, greater competition, regulation and technology. Banks need to face all these challenges to thrive in the future. Choices need to be made about which markets to operate, which clients to serve and where to innovate to gain a competitive edge over the other lenders, while maintaining costs under control.
Global investments in FinTech firms are becoming more mainstream and shaking the banking industry. The traditional ways that clients have used the banks for payments, borrowing or deposit, are changing – physical presence is giving way to virtual presence. Today we can do almost everything on our smartphones on-the-go and the tendency is to move more services to mobile platforms as a form to reduce costs and reach more customers. FinTech companies have accelerated this move with innovative and more convenient products and services. Banks have slowly embraced this new reality and have now realized its necessity and potential, with both in-house technological developments and acquisition of smaller firms
We expect this tendency to continue in the following years.
0 1 2 3 4 5
Competitor size
Similarity of players
Easy to expand
Number of players Low switching
costs Undifferentiated
product
Figure 28
IM industry degree of rivalry
Source: FLF analysis
Figure 29
I&L industry degree of rivalry
Source: FLF analysis
0 1 2 3 4 5
Competitor size
Similarity of players
Easy to expand
Number of players Low switching
costs Undifferentiated
product
Profit & Loss
Total revenue from the periods FY15A-16A and 6m16A-17A saw a decrease of 9.5% ($33.8bn to $30.6bn) and increase of 11% ($14.3bn to $15.9bn), respectively. For the period ending at the end of 2016, total Non-interest revenues saw a decrease in almost all components, specially investment banking (without net interest income) and other principal transactions, of around $2.7bn. Although interest income grew by more than 14% to $9.7bn, net interest income decreased to $2.6bn caused by the expressive increase of 32% (reaching $7.1bn) in interest expense.
The biggest component (totaling 57% of total in FY16) of the operating expenses are the compensation and benefits to employees. As this is a variable expense dependent on results, it registered a decrease in FY16 of 8% to $11.6bn. Non-compensation expenses decreased $3.7bn to $8.7bn due to a decline, from an anomalous value in FY15, of other expenses. Therefore, total operating expenses declined $4.7bn to around $20.3bn.
Pre-tax earnings increased from $8.8bn to $10.3bn and net earnings from $6.1bn to $7.4bn, leading to basic EPS of $16.6 in FY16, from $12.4 in FY15.
Dividends declared totaled $2.6 per share in FY16, comparing to the $2.55 in FY15.
When comparing the first semesters of 2016 and 2017, we observe an increase of 16% in total non-interest revenues to $14.6bn and a decrease of 20% in net interest income (from $1.6bn to $1.3bn). Hence, total revenues grew to $15.9bn in the first half of 2017, a jump of 12%.
Again, compensation expenses accompanied the raise in revenues, followed also by the total non-compensation expenses. Together, increased $0.6bn reaching $10.9bn in 6m17. Pre-tax earnings soared 25% from $4.0bn to $5.0bn (Figures 30 and 31).
Balance Sheet
Total assets closed at $860.2bn in FY16, a decrease of 0.1% from the $861.4bn in FY16. Cash and cash equivalents had a positive variation of $28.3bn mainly due to abnormal positive net cash flow from investing activities. Financing activities also provided positive cash flows in FY16, but these decreased $15.7bn mainly due to the repayment of long-term financings. The cash flows from operating activities were $5.6bn in FY16, a reduction of $2.3bn triggered by an increase in net earnings of the period and a net positive change in financial instruments sold, but not yet purchased, even though receivables and payables (excluding loans receivables) had a net negative change of $35bn, when comparing to FY15. The most significant variations in assets were the decrease in collateralized agreements ($10.4bn) and the decline of $17.6bn in financial instruments owned, at fair value, primarily due to the lower investment banking activity.
Liabilities decreased by roughly the same amount as did total assets, from $774.7bn in FY15 to $773.3bn in FY16. The main drivers for this variation were: (i) rise of 27% in deposits, totaling $124.1bn in FY16; (ii) decrease of $13.6bn in collateralized financings to $100.9bn; (iii) decrease in payables of $21.9bn; (iv) upsurge from $175.4bn in FY15 to $189.1bn of unsecured long-term borrowings.
Total shareholders’ equity remained stable in FY16 at $86.9bn. In track with previous years, preferred stock was issued but a very similar amount was also redeemed maintaining the end balance of preferred stock at $11.2bn. The main components of shareholders’ equity in FY16 were: additional paid-in capital ($52.6bn) – increase of
Financial Analysis: Consolidated
Total non-interest revenues Interest Income Interest expense Compensation and benefits Total non-compensation expenses Pre-tax earnings 30.756 8.452 (5.388) (12.678) (12.364) ) 8.778 0 Currency: $bn
10 20 30 40
Figure 30
Consolidated EBITDA bridge FY15A
Source: Statutory reports and FLF analysis
Figure 31
Consolidated EBITDA bridge FY16A
Source: Statutory reports and FLF analysis
Total non-interest revenues
Interest Income
0 10 20 30 40
$1.3bn against FY15; retained earnings ($89.0bn) – positive change of $5.7bn; stock held in treasury, at cost (($68.7bn)) – decreased $6.1bn in FY16 due to the repurchase program still in place.
Comparing total assets between 6m16 and 6m17. We observe that they improved from $896.9bn to $906.5bn. This positive variation was due to improvements in receivables and financial instruments owned, at fair value. Liabilities increased by the same amount, totaling $819.8bn at the end of the first half of 2017, with the most significant items continuing to be, in descending order, unsecured long-term borrowings, payables to customers and counterparties, financial instruments sold, but not yet purchased, and deposits. This order has been constant in the last quarters. According, to the basic accounting equation, shareholders’ equity remained similar in 6m17 to 6m16. The positive increase in retained earnings was offset by a negative variation in stock held in treasury, at cost.
It is also important to mention that almost all the Balance sheet (97%) is marked to market or carried at amounts that approximate fair value, meaning that the equity reflects market value. The great part of the balance was comprised of more liquid assets, when comparing to previous periods.
Regulatory Capital
The Group is subject to the Federal Reserve Board’s revised risk-based capital and leverage regulations, including some transitional provisions (the Revised Capital Framework). This RCF is based mostly on Basel III, plus some provisions from de Dodd-Frank Act and, under it, GS is considered an “Advanced approach” banking organization and a global systemically important bank (G-SIB). With the implementation of the RCF, three additional capital ratio requirements, that phase over time, were introduced. These additional capital ratio requirements must be satisfied totally with capital that qualifies as CET1: (i) the capital conservation buffer, that began to phase-in on January 1, 2016 and will continue to do so in raises of 0.625% per year until January 1, 2019, when it will reach 2.5% of RWA’s; (ii) the G-SIB buffer, that has the same timeline to be fully phase-in, applies only to G-SIB institutions and is set at 2.5%; (iii) the counter-cyclical buffer, of up to 2.5%, is designed to counteract systemic vulnerabilities and applies only to “Advanced approach” banking organizations – it is currently set at 0%. The standardized approach to calculate RWAs was also revised by the Basel Committee.
Goldman Sachs is, and has been, in a comfortable position in terms of capital adequacy. All ratios are at a safe distance from minimum requirements (Figure 32) and, in a Basel III Advanced approach, have increased since FY12 to current levels (Table 11). The Tier 1 Leverage ratio, which is calculated by dividing Tier 1 Capital by the average TA (consolidated), is more than two times what is required by the authorities – was 9.4% in FY16. Basel III Advanced RWA’s, on the other hand, decreased from $577.7bn in FY15 to $549.7bn in FY16.
Both the Group and all banking subsidiaries, individually and at consolidated level, are subject to national capital requirements and failure to meet the minimum regulatory capital levels could result in limitations on the ability of the firm to make certain compensation payments and distribute capital in the forms of dividends or share repurchases (Appendix G)
2 6m17 included a $485mm reduction to provision for taxes as a result of the firm’s adoption of the share-based accounting standard, resulting in an increase to diluted EPS of $1.16 and annualized ROE of 1.3%
FY16 YoY Δ
Net Revenues $30.6bn (9%)
Pre-Tax Earnings $10.3 +17%
Net Income $7.4bn +22%
Diluted Eps $16.29 +34%
ROE 9.4% +200bps
BVPS $177.09 +6.7%
6m17 YoY Δ
Net Revenues $15.9bn +12%
Pre-Tax Earnings $5.0bn +25%
Net Income $4.1bn +38%
Diluted Eps2 $9.10 +42%
Annualized ROE2 10.1% +260bps
BVPS $187.32 +6%
FY16 6m17
CET1 ratio
Standardized 14.0% 13.5%
Basel III Advanced 12.7% 12.2%
Tier 1 capital ratio
Standardized 16.1% 15.5%
Basel III Advanced 14.6% 14.1%
Total capital ratio
Standardized 19.1% 18.2%
Basel III Advanced 17.2% 16.3% Table 2
FY16 Key metrics
Source: Company presentation
Table 10
6m17 Key metrics
Source: Company presentation
Table 11
Capital Ratios – FY16 and 6m17
Source: Statutory reports
5, 87 5% 7, 37 5% 9, 37 5% 4, 00 0% 9, 50 0% 11 ,0 00 % 13 ,0 00 % 4, 00 0%
CET1 Tier 1
capital ratio Total capital ratio Tier 1 leverage ratio December 2016 Minimum Ratio
January 2019 Estimated Minimum Ratio
Figure 32
Minimum Capital Requirements
Revenue
We estimated revenue separately to the four business segments and then consolidated them to reach the total revenues for the group. To forecast all variables, we took into consideration the historical data and its dynamics present in the statutory reports, management predictions, economic trends and the understanding of future trends by market analysts (Figure 33 through 36).
Investment Banking revenues depend greatly in the dynamics in M&A, and debt and equity issuances. Therefore, we forecasted revenues for this segment based on historical performance and the expected developments in these areas;
IM’s revenues are dependent on AUS. We forecasted AUS, based on the experts’ expectations of future developments in the asset management industry, and derived the revenues for this segment;
Investing & Lending revenues were regressed based on historical data adjusted to the market assumptions present in this report;
ICS’s revenues were also regressed based on historical data and future expectations. We analyzed carefully the FICC revenues due to its relevance, by researching how management plans and future trends were interpreted by analysts. We incorporated these opinions in our forecasts.
The forecast for the Net Interest Income took into consideration the amount in deposits and loans in previous years, and the expected effects of the new products and services offered by the bank.
Operating Expenses
The primary component of operating costs is compensation and benefits. This item, alongside professional fees are dependent on revenues, thus, we forecasted them based on our revenues forecast and assuming total staff at period-end at 34.100 from FY17F till FY21F (average from previous years supported by dynamics in 6m17). The remaining operating expenses were regressed based on historical trends and both historical and forecasted revenues.
Equity capital structure
We believe that the current programs of common share repurchase and issuance of preferred stock will continue in the foreseeable future. Preferred dividends were calculated based on existing classes (and corresponding rates) and expected increase in central bank interest rates that will impact the variable component of dividends paid.
All information present in the report was taken into consideration while forecasting the financials of the group (Appendices A through F).
Forecast procedures
4,000 4,500 5,000 5,500 6,000 6,500 7,000 7,500 FY 1 2A FY 1 3A FY 1 4A FY 1 5A FY 1 6A FY 1 7F FY 1 8F FY 1 9F FY 2 0F FY 2 1F 10,000 11,000 12,000 13,000 14,000 15,000 16,000 17,000 18,000 19,000 FY 1 2A FY 1 3A FY 1 4A FY 1 5A FY 1 6A FY 1 7F FY 1 8F FY 1 9F FY 2 0F FY 2 1F 3,000 3,500 4,000 4,500 5,000 5,500 6,000 6,500 7,000 7,500 FY 1 2A FY 1 3A FY 1 4A FY 1 5A FY 1 6A FY 1 7F FY 1 8F FY 1 9F FY 2 0F FY 2 1F 4,500 5,000 5,500 6,000 6,500 7,000 FY 1 2A FY 1 3A FY 1 4A FY 1 5A FY 1 6A FY 1 7F FY 1 8F FY 1 9F FY 2 0F FY 2 1F Figure 33IB revenue forecast
Source: Statutory reports and FLF analysis
Figure 34
ICS revenue forecast
Source: Statutory reports and FLF analysis
Figure 35
I&L revenue forecast
Source: Statutory reports and FLF analysis
Figure 36
IM revenue forecast
Valuing financial service firms is different from valuing non-financial service firms, and can pose a challenge. There are several explanations for this: firstly, the regulation present in the financial sector is much higher than in other sectors, and the effects of these requirements must be considered; secondly, the nature of the business makes it extremely difficult to forecast future cash-flows, as the definitions of reinvestment and debt are unclear.
Financial service firms can be divided into four different large groups: banks; insurance companies; investment banks and investment firms – some companies can several groups. This is the case of Goldman Sachs that has the banking, investment banking and investment segments, increasing the complexity of this valuation.
A company applies its capital, usually debt and equity, raised from creditors and shareholders respectively, in order to invest in assets. So, when conducting such valuation, we tend to focus on the value of assets, or the enterprise value, and not equity. For a FSF, debt does not take the usual connotation, instead of a source of capital, it can be seen as raw material. The definition of what constitutes raises questions like whether or not deposits should be treated as debt by the bank. And in the case of interest bearing deposits, the difference between those deposits and debt issued by the bank has very little dissimilarities. Thus, if we characterized customer deposits as debt, we should calculate the operating income before interest paid to deposits – and we would be discarding a large portion of the banks’ revenues from normal operations. Hence, capital, for FSFs should just include equity capital.
Financial service firms are also highly regulated all around the world, with differences only in the degree of regulation imposed, and face several constraints: FSFs have minimum capital ratios that are required to maintain at every moment, in order to guarantee that the firm does not scale up more than it can afford and that the interests of all stakeholders, including depositors and shareholders are not at risk; legislation, like the Volcker Rule present in the Dodd-Frank Act in the U.S. or the MiFID II in the EU, which limits where they can invest their funds; new entries or mergers and other operations are heavily scrutinized by the regulators.
In terms of capital expenditure, FSFs invest more in intangibles assets, such as human capital, compared to the investments in factories and equipment (fixed tangibles assets). Meaning that the major part of investments for the future is disclosed in the financial statements as operating expenses. Accordingly, the statement of changes in cash-flows presents low amounts of CapEx and depreciation. Furthermore, working capital is much more volatile in FSFs than it is in the non-financial service firms. Due to this difficulty in determining reinvestment, we are faced with some obstacles when valuing Goldman Sachs: we cannot estimate cash flows and expected future growth rate without estimating reinvestment. And as demonstrated, this is extremely difficult.
We usually value a firm by discounting expected cash flows before debt payments at the WACC rate. Given all constrains and specifications described above, it was necessary to use different ways to value GS. One approach is the equity approach. We would discount an equity related variable with the cost of equity, and apply this approach to the multiples valuation by using price multiples (like P/E and Price to book ratios) instead of value ratios such as Value to EBITDA.
The initial idea was to value the company’s different geographies individually, and then consolidate the data to obtain the valuation of The Goldman Sachs Group Inc. This would be the best way to value the group, given they face different market environments – different economic situations, market conditions or even different competitors, although the business is the same from America to Asia passing through Europe. Goldman does not supply enough geographical data to pursue this approach and, as stated above, because the multiples valuation should be done with price multiples we can only apply them in a consolidated manner. This situation adds
Valuation Methodologies
forecasting and valuation constraints as we cannot ponder the different stages of the different businesses of the Group.
After establishing that the valuation would be done at a consolidated level, the main methods to be used in the valuation were analyzed. The initial idea was to use a DCF approach by discounting FCFEs using the cost of equity as discounting rate. According to Damodaran, FCFE = Net Income – Increases in Regulatory Capital. Regulatory minimum capital requirements were defined recently in the Basel III agreements and will be fully phased-in the beginning of 2018. Although we can assume that they will remain constant in the time horizon analyzed in this research, to forecast the necessary increases or the deliberate changes done by management is extremely difficult.
An alternative was to apply an Excess Return method of valuation. With this model, Value of Equity = Equity Capital invested currently + PV of Expected future returns to Common Equity investors. The key concept here is Excess return – a firm that earns the fair-market rate of return on equity investments should see the market value of its equity converge to the equity capital currently invested, and a company earning an above-market return should see its equity market value raise above the equity capital currently invested.
Given the complexity of the business and difficulties of forecasting future capital needs of the bank, it makes more sense to use an excess return model to estimate the value of equity (Appendix H).
To apply this model, we need a measure of equity capital currently invested and the expected excess returns to common equity investors in future periods. We forecasted and used the book value of equity of the bank subtracted by the preferred stock equity, as a measure of equity capital currently invested. We selected this measure for two reasons: assets of GS are almost all marked up to market; depreciations are insignificant for in the financials. The current programs of stock buybacks and issuance of preferred stock are considered in the analysis. Net earnings to common equity shareholders was considered a good measure of returns on common equity and economic return earned on equity investments. To reach the excess equity return, we subtracted from the forecasted net earnings to common equity shareholders in every forecasted year, the amount of cost of equity (cost of equity rate multiplied by average Book value of common equity) of that year. At the final forecasted year we computed a terminal value following an approach similar to the Gordon model (not applied to dividends). To reach the PV of Excess return, the computed values were then discounted to YE18 using the cost of equity. The price target is the sum of the average book value of equity for 2018 plus the PV of excess return calculated, divided by the number of outstanding shares at that date.
Calculation of the Discount Rate
As mentioned above, the discount rate to be applied in this valuation is the cost of equity. To determine the cost of equity (Re), we used the Capital Asset Pricing Model
(CAPM). This model describes the relationship between expected return for a security and its systematic risk:
R
e= R
f+
β
x (R
m–
R
f)
According to CAPM, investors are compensated in two ways: the time value of money and risk assumed. The time value of money is given by the risk-free rate – the rate of return that an investor expects for placing his funds in any investment over a period. The risk component is obtained by multiplying a measure of systematic risk (Beta) and the market risk premium – surplus return of the market comparing to the risk-free rate.
▪ Risk-free rate: It should be the rate of return of an investment with zero risk. This
is a theoretical rate of return. Consequently, it is the minimum rate of return an investor expects for a given investment. Because such rate does not exist in the real world (even the safest investment come with a small amount of risk), we