M
ASTER OF
S
CIENCE IN
F
INANCE
M
ASTERS
F
INAL
W
ORK
DISSERTATION
HOUSEHOLD SAVING DECISIONS
–
AN EMPIRICAL
ANALYSIS BASED ON SHARE
PEDRO DESLANDES CORREIA VASCONCELOS
MARQUES
M
ASTER OF
S
CIENCE IN
F
INANCE
M
ASTERS
F
INAL
W
ORK
DISSERTATION
HOUSEHOLD SAVING DECISIONS
–
AN EMPIRICAL
A
NALYSIS
B
ASED ON
S
HARE
PEDRO DESLANDES CORREIA VASCONCELOS
MARQUES
S
UPERVISOR
:
PROF. MARIA TERESA MEDEIROS GARCIA
iii
Abstract
This work studies the household saving behavior in what concerns to the ownership of
IRA’s in Europe. Detailed analysis is presented of factors that might influence the
ownership of IRA’s. The empirical analysis is based on Survey of Health Ageing and
Retirement in Europe (SHARE) and used data from Wave 2 (2006-2007) and Wave 4
(2010-2011). Nine countries were selected from the ones included in both waves of
SHARE and that belong to EU. To evaluate the impact of retirement in the ownership
of IRA’s, were used samples for people in pre-retirement age (<65 years) and
post-retirement age (≥65 years). The results suggest that age, years of education,
income and ownership of dwelling influence positively and significantly household
saving, while number of children, marital status and risk aversion have a negatively
effect. Marital status and income are not statistically significant for retired people.
iv
Contents
1. Introduction... 1
2. Literature Review ... 4
3. Data and Data selection ... 15
4. The Model ... 17
5. Descriptive Statistics ... 19
6. Empirical Results ... 22
7. Conclusions... 26
References ... 31
v
Tables List
Table 1 – Definition of variables ... 33
Table 2 – Description of waves by models and its total observations ... 33
Table 3 – SHARE population owning Individual retirement accounts (all population) . 34
Table 4 – SHARE population owning Individual retirement accounts (population
aged between 50 and 65) ... 34
Table 5 – SHARE population owning Individual retirement accounts (population
aged more than 65) ... 35
Table 6 – Distribution of who has Individual retirement accounts in SHARE
population (all population) ... 35
Table 7 – Distribution of who has Individual retirement accounts in SHARE
population (population aged between 50 and 65) ... 36
Table 8 – Distribution of who has Individual retirement accounts in SHARE
population (population aged more than 65) ... 36
Table 9 – Distribution of who has Individual retirement accounts in SHARE
population by gender (all population) ... 37
Table 10 – Distribution of who has Individual retirement accounts in SHARE
population by gender (population aged between 50 and 65) ... 37
Table 11 – Distribution of who has Individual retirement accounts in SHARE
population by gender (population aged more than 65) ... 37
Table 12 – Household saving rates by percentage of household disposable income.... 38
Table 13 – Marginal effects from Probit Regression ... 39
Table 14 – Marginal effects from Probit Regression (population aged between 50 and 65) ... 40
Table 15 – Marginal effects from Probit Regression (population aged more than 65) . 41
Table 16 – Marginal effects from Probit Regression (Portugal population) ... 42
vi
Acronyms List
SHARE – Survey of Health, Ageing and Retirement in Europe
IRA’s – Individual Retirement Accounts
EU – European Union
USA – United States of America
MISSOC – Mutual Information System on Social Protection
LCH – Life-cycle Hypothesis
SSS – Social Security Systems
TIAA-CREF – Teachers Insurance and Annuity Association of America - College Retirement Equities Fund
INE – Statistics Portugal (Instituto Nacional de Estatística)
IDEF – Household Expenditure Survey (Inquérito às Despesas das Famílias)
GDP – Gross Domestic Product
HRS – Health and Retirement Study
TCRS – Transamerica Center for Retirement Studies
ELSA – English Longitudinal Study of Aging
JSTAR – Japanese Study of Aging and Retirement
CHARLS – China Health and Retirement Longitudinal Study
vii
Acknowledgements
I would like to thank Professor Teresa Garcia, for her monitoring and support, and also
for her total availability during the work.
I also would like to thank my family for support and encourage me during this period.
Lastly, thank SHARE Project for providing the access to SHARE’s database.
1
1.
Introduction
Today the world faces the greatest economic and financial crisis since the Great
Depression which started, in 1929, in United States of America and whose effects were
felt in the most diverse countries (Martinez-Fernandez et al, 2012).
The current crisis were preceded by a period of strong world economic growth, a
relatively stable and low inflation and a poor regulation that led the states, financial
institutions, firms and households to a situation of over indebtedness that proved to
be unsustainable (Coe et al, 1988).
The current situation is dominated by an economic and financial crisis of high
dimensions that reveal a world in fast change and transformation, where there are
occurring shocks, ruptures and reforms at rhythm with no precedents and where there
is permanent uncertainty, questioning and jeopardizing the sustainability of major
economic and social institutions constructed over the last decades (Colander et al,
2009).
To the global economic and financial problems joined the social problems as for
example the poverty, criminality and violence, youth delinquency, social exclusion,
racism, unemployment and social differences (Bartlett and Uvalid, 2013).
On the other hand, the recent demographic trends didn’t help this situation since it is
characterized by low levels of birth rate in the most developed countries and high
2
the increase in life expectancy and the consequent worldwide aging and by high
migration flows (Martinez-Fernandez et al, 2012).
All these problems have caused in the social security systems a lower proportion of
working age population and a higher proportion of older people as well as people
receiving social benefits with a consequent increase in expenditures and decrease in
revenues. Hence, the impact on SSS financial sustainability and the need for reform. At
the same time, many private sector schemes are facing severe funding difficulties as a
result of poor stock market returns, fall in interest rates and increased longevity
(Bloom et al, 2007).
Given this macroeconomic scenario it is important to try to understand how people
and households are reacting to these all problems that affected their jobs, their
incomes, their consumption and saving habits, their levels of debt, and that deep
profoundly changed their lives, and if they are really increasing their levels of saving as
they should be doing.
In this way, and since the actual global crisis is jeopardizing the sustainability and
credibility of the major economic and social institutions, this work has the objective of
analyzing the households reactions to survive this global crisis, especially in what
concerns to the changes in their saving habits.
To perform this study, it is necessary to analyze the combination of a wide range of
factors, such as age, gender, nationality, education, marital status, job situation,
income, among others, and understand if these factors statistically influence
3
The empirical analysis is based on the micro data of the European project Survey of
Health, Ageing and Retirement in Europe (SHARE). SHARE consists in a questionnaire
that is only answered by people, with 50 years or over, from 20 European countries
and Israel and is organized in five waves1 and includes information about health,
socio-economic status and family networks.
With this work, I want to complement the existent literature about the household
saving decisions in Europe (some countries of EU), its determinants and their influence
on it, as well as improve the SHARE publications since it has few works in this topic. In
addition provide a study about the household behavior in Portugal and examine the
changes between the two periods where several Social Security System reforms took
place.
This dissertation is organized in seven sections. In the second section, there is a
literature review about the determinants of household saving and behavior. In section
three, it’s presented the data base to be used (SHARE) and which data is going to be
used. In the next section, it’s explained the model and the methodology to be used.
The fifth section presents the results and the analysis for the descriptive statistics
about the ownership of Individual Retirement Accounts by country, age and gender. In
the Empirical Results, the results obtained by application of the different models are
presented, justified and compared with the studies already done. Lastly, in seventh
section are referred the main conclusions, the limitations of the work and some
suggestions for future works.
4
2.
Literature Review
The current economic and financial crisis and the recent demographic trends are
causing pressure and strain in the financial sustainability of the systems that provide
financial security for retired people, endangering the future of those systems.
For this reason, people are starting to realize and being more concerned about the
extent of this problem, and because of that they should be taking more saving
decisions.
According to Garcia et al (2011) the promotion of private savings is the most difficult
policy target to achieve because individuals take their own saving decisions and it is up
to them to adopt a saving behavior. The authors refer that “individual behaviour with
respect to retirement saving is highly dependent on the default options of personal
pension plans, as well as on various socio-economic and psychological characteristics”.
With this work it is intended to analyze the households’ reactions to survive this global
crisis, especially in what concerns to the changes in their saving habits.
In this way it is important to understand which are the motives that lead people to
take saving decisions and the factors and/or variables that influence those decisions.
Several authors have already studied the subject and there are some works and
5
According to Sturm (1983) the main motives that influence households saving
decisions are retirement (saving for retirement), uncertainty (preventive saving) and
bequest.
People save for retirement because they want to have a more comfortable life when
stop to work, assuring they will have the wealth level required to finance their
retirement consumption. The financial sustainability problems of the aforementioned
systems have an important role here. It makes people think if they will receive, from
pension(s), enough money to maintain their current life quality.
Life Cycle Hypothesis is the theory that dominates the analysis of how saving rate
behaves. According to this theory, the main motivation for households saving is to
accumulate resources for later expenditure and to support their consumption when
they retire and if the income grows at a constant rate, aggregate household saving
tends to grow at the same rate (Modigliani, 1966). In this way, if households income is
lower, they tend to save less, as well as when they have higher spending needs.
This theory also says that household saving should be positive during their working
span and negative when they retire and wealth should be hump-shaped (Modigliani,
1986) and at any time the discounted present value of all future consumption is equal
to the discounted present value of all future earned income plus the present net
wealth.
Looking at Chart 1, is possible to see that during pre-retirement people consume less
than the disposal income, accumulating, in this way, wealth. At retirement age, wealth
6
higher consumption than disposal income, meaning that begins the dis-saving period.
It is possible to conclude that during the pre-retirement period, households have
positive saving, negative through retirement converging to 0 until death.
Feldstein (1974) defends that social security contributions reduce disposable income,
as well as, reduce the private saving. He also defends that private saving decrease, if
there is no net income by the combination of social security taxes and benefits. In this
way, he concluded that SSS essentially depresses personal savings.
Jappelli and Modigliani (2003) concluded that total saving is the relevant measure of
the change in assets accumulated for retirement because people are able to change
optional saving in response to the changes in the compulsory saving. They also refer
that compulsory saving programs and the application of retirement plans guarantee
people the sufficient reserves to be used during their retirement.
Life Cycle Hypothesis assumes that future events, as the date of death or the income
stream, are known and certain. However, we know that future is unknown and
uncertain. For this reason, households are motivated to do some preventive saving.
Besides these two motives, people can also save for bequest, i.e. households
accumulate wealth beyond the levels required to financial retirement consumption. In
a stationary economy, saving for bequest means transference of a constant level of
assets from one generation to the next, with null effect on saving ratio. However, in a
growing economy the bequest transferred between the two generations is growing
7
In addition to these three main motives, we can also consider other motives that lead
households take saving decisions. For example, people can save during the year for his
vacations, for other expenditures as wedding celebrations, a car, a house, education or
any other kind of investment.
Sturm (1983) points demographic factors, household characteristics, the effects of rate
of growth and institutional and financial factors as influencers of household savings.
As demographic factors, there is life expectancy – when it increases, household saving
ratio increases too – retirement age – increase the household saving ratio, when it
declines – and age distribution – aggregate household saving ratio depends on the
relative share of households of certain ages in the number of households.
In the side of the household characteristics, Sturm refers the family size, the average
age of entry into job market of young people and the female participation ratio. Sturm
mentions the family size because over the life cycle, normal households vary the
number of members which have influence in the consumption and therefore in saving.
Closely related to this variable, Sturm mentions the average age of entry into job
market of young people and the period of formal education because when it increases,
it tends to extend the duration of young adults in household and therefore influence
household consumption and saving ratio. Finally the author refers the female
participation ratio which determines the households with two income sources.
In the last group of factors, institutional and financial factors, Sturm points the
financial intermediation and capital markets, compulsory public pension schemes,
8
About financial intermediation and capital markets, the author refers that variations in
saving ratios can be explained by the differences in the functioning of financial markets
and by the government regulations of those markets. He also refers that variations in
the interest rate have an ambiguous effect on saving rate, since a change will cause an
income and a substitution effect, which operate in opposite directions. On other hand,
the effect of credit availability on saving ratio depends on the households’ optimal
consumption in relation to their actual income time profile. If there are no credit
limitations, young households would possibly be net borrowers because of their
relatively low level of income and high expenditures related to household formation.
To Sturm compulsory public pension schemes can affect households’ life-time budget
restriction in two ways. So, life time disposable income decrease by the amount of
payroll taxes paid as contributions to the scheme and increase by the amount of
pension payments received after retirement.
To this author an increase in the inflation will increase precautionary savings because it
increases income uncertainty.
The influence of income is controversial and appears to be no plausible explanation for
the high marginal propensity to save out of the transfers, once it is inconsistent with
the fact that equalizing income distribution reduces saving.
Finally, Sturm refers that the effect of taxation in saving is dependent of the way that
government manages that resources that are transferred to the public sector in the
9
national saving ratio if the marginal propensity to consume of governments is higher
than the same propensity of private sector.
Lundberg and Ward-Batts (2000) used the first wave of the Health and Retirement
Study (period between 1992 and 1994) to analyze the effects of husband and wife
characteristics in saving behavior, in USA, and concluded that those characteristics are
an important predictor of married couple households saving decisions.
They found that, while age, health status and education of both partners are important
determinants of net worth, simple measures of relative bargaining power do not in
general have significant effects on household assets. However, the age difference in
education between husband and wife is only significant when the husband has eight or
more years of education in comparison with his wife. This fact implies that the wife has
less power over household decision and therefore, household net worth is lower. But,
the age difference seems to not have a significant effect on net worth.
Clark et al (2006) analyzed how the participants reacted, before, during and after, to a
Financial Education Seminars, in USA, conducted from March 2001 to May 2002 by the
Client Services division of TIAA-CREF. These seminars had as objective to provide
financial information that assists persons in the retirement planning process.
The answers to the survey in the three different phases showed that educational
events, like this, have influence in retirement saving behavior as well as individuals
10
According to a study of retirement done by Fernandéz-López et al (2010), that used a
Probit model, the main determinants that influence saving behavior in some EU
countries2 are age, financial literacy, income and nationality.
Age, financial literacy and individuals’ income influence positively retirement savings.
This means that as age increases, the probability of saving also increase, as well as the
individuals with higher financial education and knowledge and with higher income.
The same study also refers the nationality as a saving determinant. In this way,
individuals that live in countries like United Kingdom or Sweden, which have
mandatory private pension plans are positively influenced by their nationality, while
individuals from France or Italy, which have no mandatory private pension plans but
public pension systems, are negatively influenced.
Alves and Cardoso (2010), present an evolution of household saving rate in Portugal
between 1985 and 2009, analyzed statistically the relation between household saving
rate and some variables and present the factors that explain the evolution of
household saving rate.
These authors used microeconomic data from Household Expenditure Survey (IDEF),
conducted by the National Statistics Institute (INE) in 2005/06, to estimate some
regressions to explore Portuguese wealth and to analyze statistically the relation
between household saving rate and some variables - household region, age, current
job situation, education level, household size, number of household members working
2
11
beside the representative and presence of spouse/partner in household and her
education level.
In the estimated regressions, the estimated coefficients measure the impact of the
variables on the mean of the distribution of saving (or saving rate) or on its percentiles.
It was concluded that the household saving increases along the life cycle and is positive
related with the level of education, which is evident in the higher percentiles of saving
distribution. It was also concluded that there is a negative relation between
unemployment and saving rate, meaning that the households with unemployed
representative save less than the ones with a representative working. In households
where the representative is retired, the level of saving doesn’t change too much
compared to the ones working, mostly due to the social security rules and the tax
system in that period. The number of household members working has statistical
significance, since the saving rate increase considerably with any additional working
member in the household.Although the household size doesn’t influence significantly
the saving rate but the presence of partner in household does.
In this way, the main point is that the saving rate or level is influenced by the
household capacity to generate income and not by its size.
Lastly, the fact that households owning the dwelling they live presupposes a greater
saving rate or level, which is more significant for the top saving distribution
12
The same authors present also factors that explain the evolution of household saving
rate which are inflation, real interest rate, fiscal policy, GDP growth rate and wealth.
They refer that inflation is positively related household saving rate in two ways. On one
hand, periods of high inflation generate higher uncertainty and in these periods
households tend to increase their savings for precaution. On the other, higher inflation
tends to erode the households financial wealth value, promoting an increase in
households saving rate aiming to compensate for this effect.
Empirically, the relation between saving rate and real interest rate are considered
ambiguous and/or not significant. However, an increase in the real interest rate will
increase the opportunity cost of current consumption comparing to future
consumption, which will cause that households postpone their consumption
expenditures, increasing in this way the saving rate (substitution effect). In other side,
the effect of increasing future income associated with higher earnings from
accumulated savings can lead to an increase in current consumption (income effect).
The study also refers that government decision have influence on saving and
consumption households decisions. Fiscal policy is an example of that, and economic
theory suggests a negative relation between fiscal balances and household saving rate.
This means that a decrease in the fiscal balance, associated with a reduction of taxes
or an increase of spending with households, will lead to an increase in household
saving rate. However, the authors refer that there is a positive relation between
13
Finally, the authors refer that significant variations in wealth are expected to be
reflected in opposite direction variations in the household saving rate.
Jappelli and Padula (2013), estimated two equations using microeconomic data by the
merge of SHARE with SHARELIFE to analyze the relation between financial literacy and
saving decisions. They defined an indicator of current financial literacy and defined
mathematical skills at school age as initial literacy.
They concluded that financial literacy and wealth are positively correlated over the
life-cycle and the early improvements in mathematical skills will eventually increase
households’ financial literacy and, therefore, wealth accumulation.
Alessie et al (2013) used data from SHARELIFE to estimate the effects of pension
wealth on household savings and the main results suggest that, due to the pension
reforms in Europe, households will increase private savings but not enough to smooth
consumption over the life-cycle.
To conclude, Beckmann et al (2013) used data from Euro Survey of the
Oesterreichische Nationalbank to analyze the household saving decisions between
2010 and 2011 of ten European countries3. They considered explicative variables as
age, gender, household size, presence of children, income, education, job situation,
expectations and risk averse. To measure the impact of these variables on saving
behavior, the authors estimated a Probit model and concluded that middle-aged
people are most likely to save when compared with younger and older people,
3 Albania, Bosnia and Herzegovina, Bulgaria, Czech Republic, Croatia, Hungary, Macedonia FYR, Poland,
14
employment, income and education have positive and significant effect on
households’ savings, the number of younger children in household has positive effect
but insignificant and the number of teenage children has also insignificant effect but
negative, households with two persons tend to save more than the ones with single
person, three or more, and finally risk averse people are more likely to save.
The present work follows the methodology used by Fernandéz-López (2010) and
Beckmann et al (2013), the use of Probit models, and using micro data of SHARE to
come up with results and take conclusions about the variables that influence
household saving, in what concerns to the ownership of Individual Retirement
15
3.
Data and Data selection
The current work uses data from Survey of Health Ageing and Retirement in Europe
(SHARE). The SHARE project started in 2004-2005, with Wave 1, collecting data about
health, socio-economics and social networks on people aged 50 or more in various
regions in Europe4. Later in 2006-2007, with Wave 2, new countries5 joined the SHARE
project and was collected a first longitudinal follow–up and a refresher sample was
added to maintain the representativeness of the survey. In 2008-2009, the third wave
of data collection for SHARE, also known as SHARELIFE, questioned all previous
respondents about their entire life history information. In the last wave, Wave 4
(2010-2011), more countries joined the project6 and new integrated social networks module
with respective generated variables were added.
Due to the fact that Wave 3 does not include any variable related to household saving,
it will be taking in consideration Wave 2 to make an analysis about the evolution of
saving decisions in EU before and after the financial crisis. To take conclusions about
household saving in Portugal, will be used Wave 4 because Portugal was only included
in the survey in that wave.
In order to pursue the study, the selected dependent variable is Has individual
Retirement Accounts because this variable assures more accurate answers than, for
example, Amount Individual Retirement Accounts. People are more willing to answer if
they do or not do savings than to tell the amount of savings (table 1).
4
Austria, Belgium, Denmark, France, Germany, Greece, Italy, Netherlands, Spain, Sweden, Switzerland and Israel
5 Czech Republic, Ireland and Poland 6
16
The considered independent variables are Age, Gender, Nationality, Education, Marital
Status, Presence of Partner in household, Household size, Number of Children, Income,
Job situation, Owner of the Dwelling and Risk Aversion.
The dependent variable is included in Assets module, while the independent variables
are spread out by Children, Coverscreen, Demographics, Employment and Pensions,
Expectations, Household Income and Housing modules. Therefore, it was needed to
merge these modules and create a new data file.
This data file was then split into two groups: people with age between 50 and 65
(pre-retirement) and people with more than 65 years (post-retirement). The objective
of this division is to have a better understanding about the differences, in what
concerns to saving decisions, between people in working age and retired people7.
The software that was used to process the data and to construct the referred samples
was IBM-SPSS® v21.0 and to do the regressions, the tables and the statistical tests was
Stata® v12.0.
7
17
4.
The Model
The considered dependent variable is a binary variable, which represent the owning or
not of retirement accounts, assuming value of 1 if the individual answered Yes and
value of 0 otherwise. In this way and following the study done by Fernández-López
(2010) and by Beckman et al (2013) was adopted a Probit model.
A Probit model is a type of regression used when the dependent variable is binary and
it’s represented by the following equation:
∑ , (1)
where represents the unobserved continuous variable that determines the value of
y, α the constant, the vectors of the independent variables, β the parameters and ε
the random disturbance term. The value of y is obtained as follows:
{ }
This equation was estimated for the following countries: Austria, Denmark, France,
Germany, Italy, Netherlands, Portugal, Spain and Sweden. Belgium also belongs to EU
and has data available for both waves but was not selected because the data is split by
French Belgium and Flemish Belgium.
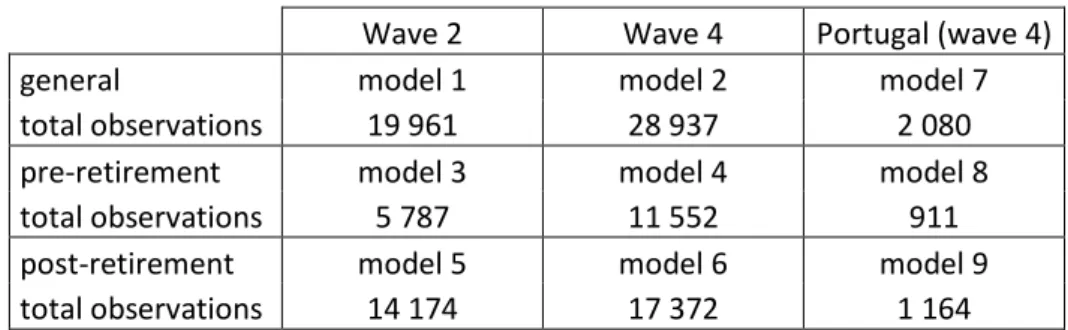
Several versions of the model are estimated according two waves and according pre or
post-retirement ages (table 2). First, it was applied for a general sample with all
countries for both Waves 2 (with 1 240 observations – Model 1) and 4 (with 9 306
18
but for people aged between 50 and 65 with 355 observations in Wave 2 (Model 3)
and 4 450 in Wave 4 (Model 4) and for people aged more than 65 with 885 and 4 856
observations for Wave 2 (Model 5) and 4 (Model 6), respectively. Lastly, it was also
applied for a sample only including Portugal8 and within the same parameters, general
(1 247 observations – Model 7), people aged between 50 and 65 (531 observations –
Model 8) and aged more than 65 (716 observations – Model 9).
In the second section of this work were presented explicative variables used by several
authors that studied and analyze the determinants of household savings. As previously
mentioned and justified, in the present work were tested the following variables: Age
(age), Gender (male), Nationality (nationality), Education (years of education and high
education), Marital Status (married), Partner in household (partner in household),
Household size (household size), Number of children (number of children), Income
(income)9, Job situation (employed), Owner of the Dwelling (own dwelling) and Risk
aversion (risk).
In the model applied for Portugal was excluded the variable Nationality because its
inclusion makes no sense once it is a single country being tested.
8
Introduced only in Wave 4
9 The variable considered for income represents the total income received in previous years (2005 and
19
5.
Descriptive Statistics
Before analyzing the effects of all the variables in saving behavior, it is important to
evaluate the household saving panorama in SHARE population.
The first aspect that can be pointed, looking at tables 3, 4 and 5, is that there is a trend
for higher positive answers for people aged between 50 and 65 comparing to the
general sample and lower positive answers for the ones aged more than 65 also
comparing to the general sample.
This is reflected in a considerable percentage decrease of saving from the population
with age between 50 and 65 years to population aged more than 65 years. In all the
countries, with exception of France and Sweden, this decrease was in about half level
or more of positive answers of population with 50 and 65 years.
With this fact can be concluded that after retirement people start to reduce their
savings and to consume with the savings done during their pre-retirement period.
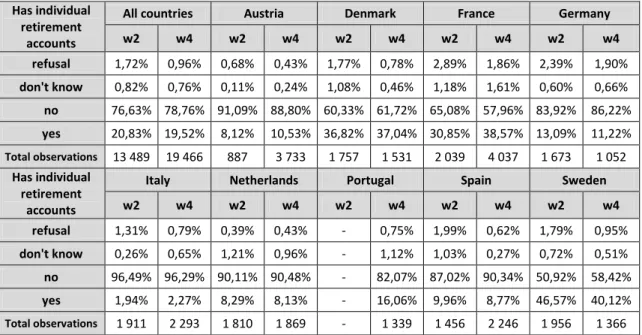
Analyzing how the answers are distributed in the sample population (table 3), it is
possible to see that the percentage of people with Individual Retirement Accounts
decreased from 20.83% (of 13 489 respondents), in Wave 2, to 19.52% (of 19 466
respondents), in Wave 4.
The population aged between 50 and 65 and with more than 65 also followed the
same declining trend. The first decreased from 33.22% (of 3 748 respondents), in
Wave 2, to 28.63% (of 7 432 respondents), in Wave 4 and the other from 16.07% (of
20
The majority of countries follow this declining of saving trend. However, France, Italy
(except for people aged more than 65) and Austria and Denmark (only verified in
general cases) increased their positive answers from Wave 2 to Wave 4.
Denmark, France and Sweden are the countries with highest ownership of Individual
Retirement Accounts, while Italy, Netherlands and Spain are the ones with less. This
fact is verified in all cases but for the population aged more than 65, Austria and
Germany should be included in the countries with less ownership of Individual
Retirement Accounts.
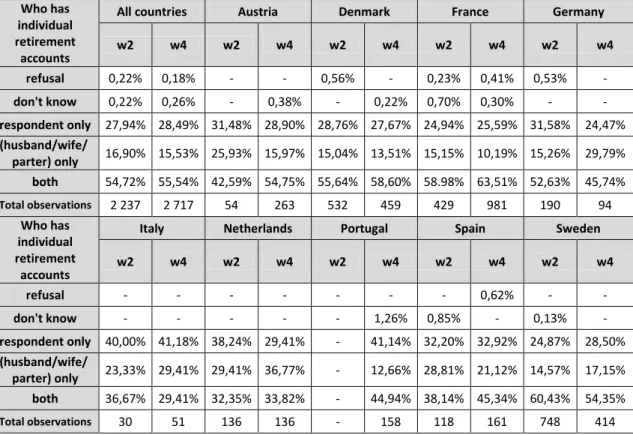
Regarding to who has Individual Retirement Accounts (tables 6, 7 and 8), Denmark,
France and Sweden are also the countries where there is higher percentage of both
household members owning IRA’s, while Italy, Netherlands, Portugal and Spain are the
countries with higher percentage for only one member of household owning IRA’s.
There was an increase of the importance of female participation in household savings
(table 9), from 47.69% of ownership of IRA’s in Wave 2 to 50.20% in Wave 4. All the
countries in the sample followed this increasing trend with exception of Netherlands,
Spain and Sweden. France and Italy are the countries with the highest female
participation ratio, 54.27% and 51.92% in Wave 4, respectively. While Denmark and
Sweden are the ones with lowest female participation ratio, 43.56% and 45.99%, also
values for Wave 4.
It’s important to point the big increase registered in Italy, 40.54% in Wave 2 to 51.92%
21
registered in Spain, which were the country with highest female participation in
Wave 2, from 56.55% to 50.76%.
Looking for the pre-retired population (table 10), it was registered a very small
increase in female percentage, from 51.24% in Wave 2 to 51.97% in Wave 4. Germany,
France and Austria are the countries with most female ownership or IRA’s, 59.49%,
54.95% and 54.35% respectively. The most of countries registered values between 50%
and 52% but Denmark and Portugal are the ones with the lowest rates, 44.83% and
48.44%.
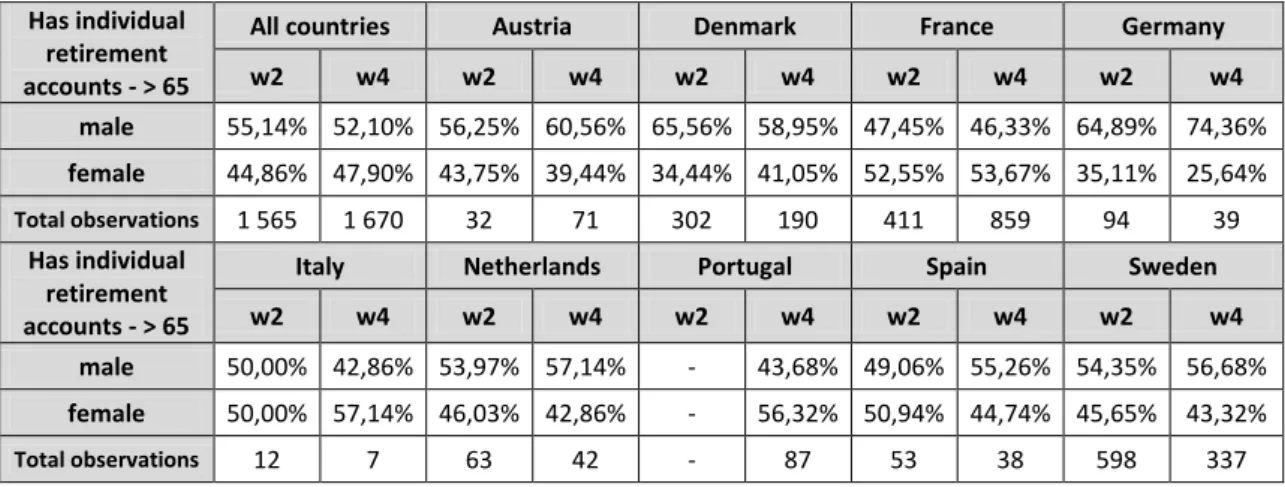
Looking for the retired population, aged more than 65 (table 11), there was also an
increasing trend with Italy and Portugal being the countries with the highest rates,
57.14% and 56.32%, respectively. Germany and Austria did not follow the increasing
trend and are the ones with the lowest rates, 25.64% and 39.44%, respectively.
In summary, after the crisis (from Wave 2 to Wave 4) the percentage of population
owning IRA’s decreased but the female percentage increased, the population in
pre-retirement age show higher ownership of IRA’s percentage than the population in
retirement age and lastly Denmark, France and Sweden are the countries with higher
22
6.
Empirical Results
Table 13 presents results of Marginal effects from a Probit Regression of model 1 and
2, which were tested for Waves 2 and 4, respectively. In both models, the results show
that the variables that have a strong positive relationship with the ownership of
Individual Retirement Accounts are age, years of education and income. On the other
hand, marital status (married) and risk showed a strong negative relationship. This
means that married people and risk averse people are less likely to own Individual
Retirement Accounts. The table also shows the values for the quality of the
estimations and by 83.71% correctly predicted for Wave 2 and 79.97% for Wave 4, it’s
possible to conclude that the estimations have a good quality.
In Wave 2, gender showed statistically significance effect, in which male people are
less likely to own Individual Retirement Accounts. This result is consistent with the
works already done and referred in second section (Literature Review) of this work, in
which the authors point for an increase of female participation ratio and also reflected
in an increase of female percentage of ownership of Individual Retirement Accounts
(tables 9 to 11). The number of children showed also a strong negative relationship
only in Wave 2, which can be explained by the fact that people with children give more
importance to the bequest motive, referred by Sturm (1983) and also by Lundberg and
Ward-Batts (2000).
The presence of partner in household behaved different than the other variables,
changing from strong negatively, in Wave 2, to strong positively relationship, in Wave
23
obtained for married people. However the fact that partners living together doesn’t
mean necessarily they have to be married and then the results show that if both
partners are not married but living together, they’re more likely to own Individual
Retirement Accounts.
In Wave 4, the ownership of dwelling presented strong positively related with the
possession of Individual Retirement Accounts. It can be explained by the fact that
households with high level of wealth tend to show higher levels of saving, including
IRA’s. This outcome is in line with the work of Alves and Cardoso (2010), in which they
conclude that households’ owners of dwelling where they live are associated with
higher levels of saving.
The results for the current job situation (employed) showed a negative relation with
the dependent variable, ownership of Individual Retirement Accounts, but only
statistically significant at 5% in Wave 4, meaning that employed people are less likely
to have IRA’s. This result is not consistent with the conclusions taken by Fern
ández-López et al (2010), Alves and Cardoso (2010) and Beckmann et al (2013).
The variable High Education Degree showed no statistically significance in this test,
which means that obtaining a high degree doesn’t influence the ownership of IRA’s.
Although the number of years of education showed a strong positive relation, in both
Waves tested, being in accordance with the results of Alves and Cardoso (2010) for this
variable.
In Wave 2, household size presented no statistical significance which is consistent with
24
level, in this case for retirement, is not influenced by the household size but its
capacity to generate income. However, in Wave 4 it showed statistically significant
with negative effect in the ownership of IRA’s being not in accordance with those
authors.
The last variable with statistically significance influence in the possession of IRA’s is
nationality that shows the impact of country-level institutional factors in saving level,
which is consistent with Fernández-López et al (2010) that referred that live in a
country with mandatory private pension plans positively influence retirement saving.
However, the current work doesn’t go so further and can only verify the influence of
countries on saving, making no distinction between each country present in the model.
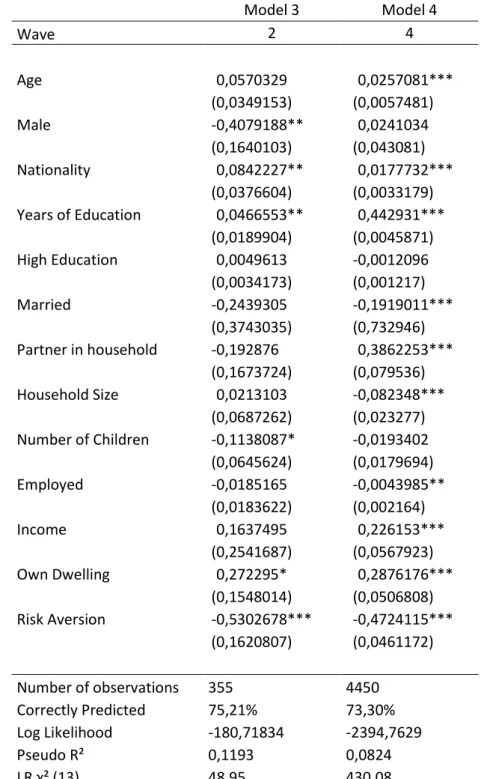
There were also tested models for the SHARE population in pre-retirement age10 (table
14 – models 3 and 4) and for the SHARE population in retirement age (table 15 –
models 5 and 6).
In Wave 2, the variables age, marital status (married), presence of partner in
household and income lost all the statistical significance when tested only for
population in pre-retirement age, while years of education, number of children and
country lost only one significance level. The ownership of dwelling gain significance
level in pre-retirement age but it’s only significant at 10%.
The results suffered no changes in Wave 4 when tested for pre-retirement age, being
the same as for general sample.
10
25
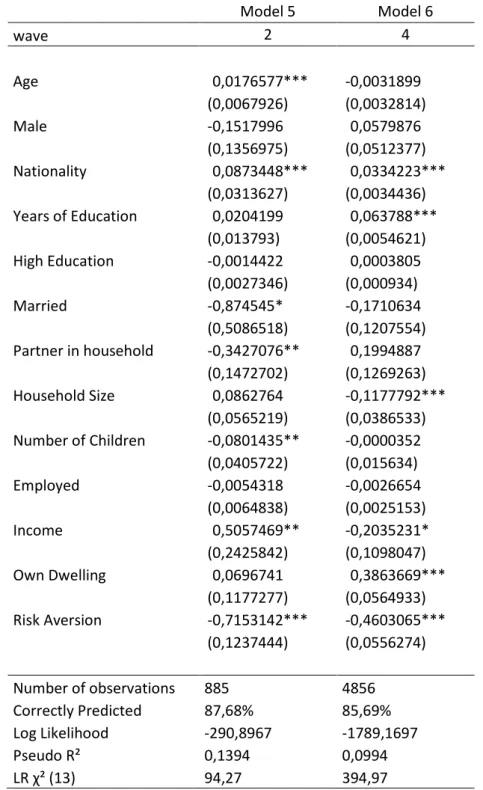
Concerning the models for the SHARE population in retirement age, was found that, in
Wave 2, gender (male), years of education and income are no more statistically
significant and the presence of a partner in household and the number of children lost
one significance level. In wave 4, age, marital status (married), partner in household
and job situation are no longer statistically significant and income is only significant at
10%, losing two levels of significance.
Portugal was the only one country analyzed in individual, only in Wave 4 because
Portugal was only included in SHARE in this Wave. The results are shown in table 16
(models 7, 8 and 9) and age, years of education, income and ownership of dwelling are
the variables with positive significant effect in the possession of Individual Retirement
Accounts. These results are consistent with the study of Alves and Cardoso (2010) and
Garcia et al (2011) and are in line with results obtained for group of countries in
Model 2. The number of children in Portugal showed a negative significant relation and
risk averse people are less likely to possess IRA’s.
The variables age and number of children lose statistical significance when we look for
the population in pre-retirement age and income increases the significance, being
positive related at 1%. However, income loses all significance in the results for
population in retirement age, as well as ownership of dwelling, and age loses two
26
7.
Conclusions
In this work, SHARE data was used to come up with new estimates of the determinants
and variables that influence household saving, in particular ownership of Individual
Retirement Accounts. For that, were applied Probit models to the different samples
created from SHARE data, for both Waves 2 and 4, taking as dependent variable, and
binary, the ownership of Individual Retirement Accounts.
The findings of this work suggest that:
- age influence positively the ownership of IRA. However the most percentage of
ownership of IRA’s is verified in the sample with age between 50 and 65 and not in the
oldest one. This can be maybe explained by the hump-shaped individual propensity to
save, which means that young and old people are less likely to save than mid-age
people. However with SHARE data, young side can’t be analyzed because it only
applies for people aged 50 or more.
- the significant results for gender, points that male individuals are negatively related
with IRA’s, which can be understood as an increase of female participation ratio on
household decisions. The percentages of male and female ownership of IRA’s also
points for an increase in females side, since females raised their percentage in all
samples analyzed.
- the results for nationality showed that the country where individuals live have
27
ownership of IRA’s. The countries with higher percentage of ownership of IRA’s are
Denmark, France and Sweden.
- educated people showed more likely to own IRA’s than no educated ones. However,
the results points for an importance of the years of education (strong positive effect)
and gives no importance to the fact of individuals having a high degree (no significant
effect but positive).
- the results for marital status indicate that married individuals are less likely to own
IRA’s than the ones with different marital status. When individuals get married, they
possibly opt by a different kind of saving, other than owning an individual retirement
account, as well as thinking in their children (bequest motive) if that is the case.
- the presence of partner in household changing from significant negative effect in
Wave 2 to positive, and also significant, in Wave 4 show that after the crisis the fact
that both partners be living together is an important predictor for the ownership of
IRA’s.
- household size (significant in Wave 4) and the number of children (significant in Wave
2) showed both a negative effect on the ownership of IRA’s. Usually, these variables
are interconnected because, in normal households, the number of children defines the
household size. Households with children can opt for bequest instead of the IRA’s and
sometimes as Lundberg and Ward-Batts (2000) affirmed, the cost of children, on
28
- income influence positively the ownership of IRA’s but the results points for
employed individuals being less likely to own IRA’s than the not employed ones, which
seems to be contradictory. As the results for the job situation are only significant in
Wave 4, it can mean that after the crisis being employed is not enough for individuals
to be able to make savings and the income level makes the difference in this case.
- individuals that are owners of dwelling where they live, are more likely to own IRA’s
than the others because they have no expenditures with the rent of home and, for
example, they can apply that money for saving.
- risk averse individuals showed less likely to own IRA’s than the others. According to
Beckmann et al (2013) there is an assumption saying that risk averse people don’t
diversify their portfolios and stick to one well-known saving instrument. By these
results, it can be concluded that IRA’s is not the saving instrument used by them.
- in Portugal, less variables showed significance. Only age, years of education, income
and the ownership of dwelling have positive significance while the number of children
and risk aversion negative. Income and the ownership of dwelling showed no
significance for retirement age.
- By the differentiation between the individuals pre-retired aged and in retired age, the
results showed that in retirement, gender, marital status, presence of partner in
household, job situation and income are no longer significant predictors for the
29
- between the two periods, the results show that household saving level is decreasing,
which can also be verified by the household saving rates reported by Eurostat (table
16). This fact contradicts the argument that people are aware of the problems and
therefore will save more. Actually, people can be aware of this problem but due to the
current financial situation, have no possibility to save. In addition, policy implications
and the reforms on social security concerning a higher saving ratio didn’t work, since
saving rates are decreasing. The extent of this situation is worrying, and if there are no
changes in the future, the world may face another problem that is the poverty in old
age.
Limitations and suggestions for future works:
The age range of the SHARE (aged more than 50) is one limitation of this work because
with this age ranger it’s not possible to analyze the younger population, and for
example to take conclusions about a possible hump-shaped relationship between age
and the ownership of IRA’s. The inexistence, in SHARE, of a variable that assesses
respondents’ financial literacy is another limitation because with variables available it’s
not possible to evaluate the influence of financial education. The method used in this
work doesn’t allow to conclude which countries have positive and negative effects in
the ownership of IRA’s, but only that has influence.
Some suggestions for future works could be the use of different models for each
gender; the use have contractual saving variable as dependent variable; the use of
data of Wave 5, when available, to make an analysis and a comparison in a larger time
30
regions and to understand the differences and/or equalities between them, for
example HRS (USA), TCLS (Transamerica), ELSA (England), JSTAR (Japan), CHARLS
31
References
Agarwal, S. (2007). The impact of homeowners' housing wealth misestimation on consumption and saving decisions. Real Estate Economics, 35(2), 135-154.
Alessie, R., Angelini, V. and Van Santen, P. (2013). Pension wealth and household savings in Europe: Evidence from SHARELIFE. European Economic Review, 63, 308-328.
Alves, N. and Cardoso, F. (2010). Household Saving in Portugal: Micro and Macroeconomic Evidence. Economic Bulletin and Financial Stability Report Articles, 47-67.
Antolin, P.P. and Stewart, F. (2009). Private Pensions and Policy Responses to the Financial and Economic Crisis. OECD Working Papers on Insurance and Private Pensions, 36.
Bartlett, W. and Uvalid, M. (2013). Social Consequences of the Global Economic Crisis in South East Europe. London: London School of Economics and Political Science, LSEE-Research on South Eastern Europe.
Beckmann, E., Hake, M. and Urvova, J. (2013). Determinants of Households’ Savings in Central, Eastern and Southeastern Europe. Focus on European Economic Integration Q3/13.
Bloom, D. E., Canning, D., Mansfield, R. K. and Moore, M. (2007). Demographic change, social security systems, and savings. Journal of Monetary Economics, 54(1), 92-114.
Callen, T. and Thimann, C. (1997). Empirical Determinants of Household Saving-Evidence from OECD Countries. IMF Working Paper Series no. 97/181.
Clark, R. L., d'Ambrosio, M. B., McDermed, A. and Sawant, K. (2006). Retirement plans and saving decisions: the role of information and education. Journal of Pension Economics and Finance, 5(01), 45-67.
Coe, D. T., Durand, M. and Stiehler, U. (1988). The disinflation of the 1980s. OECD Economic Studies, 11, 89-121.
Colander, D., Goldberg, M., Haas, A., Juselius, K., Kirman, A., Lux, T. and Sloth, B. (2009). The Financial Crisis and the Systemic Failure of Academic Economics. Kiel Institute for the World Economy. Kiel Working Paper no. 1489.
Duflo, E. and Saez, E. (2003). Implications of information and social interactions for retirement saving decisions. Pension Research Council Working Paper 2003-13, Philadelphia.
Feldstein, M. (1974). Social Security, Induced Retirement, and Aggregate Capital Accumulation. The Journal of Political Economy, 82(5), 905-926.
Fernandéz-López, S., Otero, L., Rodeiro, D. and Vivel, M. (2010). What Are the Driving Forces of Individuals’ Retirement Savings?. Czech Journal of Economics and Finance, 60(3), 226-251.
32
Holzmann, R. (2005). Old-age income support in the 21st century: An international perspective on pension systems and reform. World Bank Publications.
Jappelli, T., Modigliani, F. (2003). The Age-Saving Profile and the Life-Cycle Hypothesis. Center for Studies in Economics and Finance. Working Paper no. 9.
Jappelli, T. and Padula, M. (2013). Investment in financial literacy and saving decisions. Journal of Banking & Finance, 37(8), 2779-2792.
Lundberg, S. J. and Ward-Batts, J. (2000). Saving for retirement: Household bargaining and household net worth. Claremont McKenna College Robert Day School of Economics and Finance Research Paper no. 2004-03.
Lusardi, A. (2008). Household saving behavior: the role of financial literacy, information, and financial education programs. National Bureau of Economic Research. Working Paper no. 13824.
Martinez-Fernandez, C., Kubo, N., Noya, A. and Weyman, T. (2012). Demographic Change and Local Development: Shrinkage, Regeneration and Social Dynamics. OECD Publishing.
Modigliani, F. (1966). The life cycle hypothesis of saving, the demand for wealth and the supply of capital. Social Research, 160-217.
Modigliani, F. (1986). Life Cycle, Individual Thrift, and the Wealth of Nations. American Economic Review, 76(3), 297-313.
Policy Brief from International Longevity Centre – UK. (2012). Boosting retirement saving across Europe.
Sturm, P. H. (1983). Determinants of saving: theory and evidence. OECD Economic Studies, 1(1983), 147-96.
SHARE questionnaires and guides:
<http://www.share-project.org/t3/share/fileadmin/pdf_questionnaire_wave_2/country_specific_question naire/Generic_version_english/Generic_Share_w2_Questionnaire.pdf>
<http://www.share-project.org/fileadmin/pdf_questionnaire_wave_4/SHARE_generic_wave4_main_quest ionnaire.pdf>
<http://www.share-project.org/fileadmin/pdf_documentation/SHARE_guide_release_2-6-0.pdf>
<http://www.share-project.org/fileadmin/pdf_documentation/SHARE_wave_4_release_guide_1.1.1.pdf>
33
Appendix
Table 1 – Definition of variables
Variable Description
Has individual retirement accounts Assumes value 1 if respondent has IRA’s; 0 otherwise
Age Age of the respondent
Male Assumes value 1 if respondent is male;
0 otherwise
Nationality Nationality of respondent: 11 = Austria;
12 = Germany; 13 = Sweden;
14 = Netherlands; 15 = Spain; 16 = Italy; 17 = France; 18 = Denmark; 33 = Portugal Years of education Number of years of education of respondent High education degree obtained Assumes value 1 if respondent has a high
degree; 0 otherwise
Married Assumes value 1 if respondent is married;
0 otherwise
Partner in household Assumes value 1 if respondent’s partner is in household; 0 otherwise
Household size Number of persons in household
Number of children Number of children in household
Employed Assumes value 1 if respondent is employed;
0 otherwise
Income Income received in previous year
Own dwelling Assumes value 1 if respondent has the
ownership of dwelling; 0 otherwise Risk aversion Attitude toward taking financial risks:
1 = respondent isn’t willing to take any financial risks; 0 otherwise
Table 2 – Description of waves by models and its total observations
Wave 2 Wave 4 Portugal (wave 4)
general model 1 model 2 model 7
total observations 19 961 28 937 2 080
pre-retirement model 3 model 4 model 8
total observations 5 787 11 552 911
post-retirement model 5 model 6 model 9
34
Table3 – SHARE population owning Individual retirement accounts (all population)
Has individual retirement
accounts
All countries Austria Denmark France Germany
w2 w4 w2 w4 w2 w4 w2 w4 w2 w4
refusal 1,72% 0,96% 0,68% 0,43% 1,77% 0,78% 2,89% 1,86% 2,39% 1,90%
don't know 0,82% 0,76% 0,11% 0,24% 1,08% 0,46% 1,18% 1,61% 0,60% 0,66%
no 76,63% 78,76% 91,09% 88,80% 60,33% 61,72% 65,08% 57,96% 83,92% 86,22%
yes 20,83% 19,52% 8,12% 10,53% 36,82% 37,04% 30,85% 38,57% 13,09% 11,22%
Total observations 13 489 19 466 887 3 733 1 757 1 531 2 039 4 037 1 673 1 052
Has individual retirement
accounts
Italy Netherlands Portugal Spain Sweden
w2 w4 w2 w4 w2 w4 w2 w4 w2 w4
refusal 1,31% 0,79% 0,39% 0,43% - 0,75% 1,99% 0,62% 1,79% 0,95%
don't know 0,26% 0,65% 1,21% 0,96% - 1,12% 1,03% 0,27% 0,72% 0,51%
no 96,49% 96,29% 90,11% 90,48% - 82,07% 87,02% 90,34% 50,92% 58,42%
yes 1,94% 2,27% 8,29% 8,13% - 16,06% 9,96% 8,77% 46,57% 40,12%
Total observations 1 911 2 293 1 810 1 869 - 1 339 1 456 2 246 1 956 1 366
Table 4 – SHARE population owning Individual retirement accounts (population aged between 50 and 65)
Has individual retirement accounts - 50-65
All countries Austria Denmark France Germany
w2 w4 w2 w4 w2 w4 w2 w4 w2 w4
refusal 1,73% 0,84% 1,25% 0,20% 1,25% 0,73% 1,92% 1,47% 2,49% 1,22%
don't know 0,75% 0,55% - 0,20% 0,36% 0,44% 0,80% 0,71% 0,42% 0,61%
no 64,30% 69,98% 73,75% 78,29% 36,78% 43,63% 62,34% 56,70% 71,16% 74,01%
yes 33,22% 28,63% 25,00% 21,31% 61,61% 55,20% 34,94% 41,12% 25,93% 24,16%
Total observations 3 748 7 432 160 1 511 560 683 624 1 695 482 327
Has individual retirement accounts - 50-65
Italy Netherlands Portugal Spain Sweden
w2 w4 w2 w4 w2 w4 w2 w4 w2 w4
refusal 2,38% 1,52% 0,17% 0,68% - 0,35% 3,15% 0,61% 1,55% 0,32%
don't know 0,87% 0,63% 1,34% 0,41% - 1,41% 1,45% 0,25% 0,22% 0,96%
no 91,34% 92,17% 83,89% 83,90% - 75,70% 73,12% 79,56% 28,83% 30,87%
yes 5,41% 5,68% 14,60% 15,01% - 22,54% 22,28% 19,58% 69,40% 67,85%
35
Table5 – SHARE population owning Individual retirement accounts (population aged more than 65)
Has individual retirement accounts - > 65
All countries Austria Denmark France Germany
w2 w4 w2 w4 w2 w4 w2 w4 w2 w4
refusal 1,71% 1,03% 0,55% 0,59% 2,00% 0,82% 3,32% 2,14% 2,35% 2,21%
don't know 0,84% 0,90% 0,14% 0,27% 1,42% 0,47% 1,34% 2,26% 0,67% 0,69%
no 81,38% 84,18% 94,91% 95,94% 71,35% 76,30% 66,29% 58,89% 89,09% 91,72%
yes 16,07% 13,89% 4,40% 3,20% 25,23% 22,41% 29,05% 36,71% 7,89% 5,38%
Total observations 9 741 12 025 727 2 219 1 197 848 1 415 2 340 1 191 725
Has individual retirement accounts - > 65
Italy Netherlands Portugal Spain Sweden
w2 w4 w2 w4 w2 w4 w2 w4 w2 w4
refusal 0,96% 0,40% 0,50% 0,26% - 1,05% 1,54% 0,63% 1,86% 1,14%
don't know 0,07% 0,66% 1,15% 1,32% - 0,91% 0,86% 0,28% 0,87% 0,38%
no 98,14% 98,47% 93,16% 94,72% - 86,70% 92,52% 96,44% 57,54% 66,54%
yes 0,83% 0,47% 5,19% 3,70% - 11,34% 5,08% 2,65% 39,73% 31,94%
Total observations 1 449 1 501 1 214 1 136 - 767 1 043 1 434 1 505 1 055
Table6 – Distribution of who has Individual retirement accounts in SHARE population (all population)
Who has individual retirement
accounts
All countries Austria Denmark France Germany
w2 w4 w2 w4 w2 w4 w2 w4 w2 w4
refusal 0,22% 0,18% - - 0,56% - 0,23% 0,41% 0,53% -
don't know 0,22% 0,26% - 0,38% - 0,22% 0,70% 0,30% - -
respondent only 27,94% 28,49% 31,48% 28,90% 28,76% 27,67% 24,94% 25,59% 31,58% 24,47%
(husband/wife/
parter) only 16,90% 15,53% 25,93% 15,97% 15,04% 13,51% 15,15% 10,19% 15,26% 29,79% both 54,72% 55,54% 42,59% 54,75% 55,64% 58,60% 58.98% 63,51% 52,63% 45,74%
Total observations 2 237 2 717 54 263 532 459 429 981 190 94
Who has individual retirement
accounts
Italy Netherlands Portugal Spain Sweden
w2 w4 w2 w4 w2 w4 w2 w4 w2 w4
refusal - - - 0,62% - -
don't know - - - 1,26% 0,85% - 0,13% -
respondent only 40,00% 41,18% 38,24% 29,41% - 41,14% 32,20% 32,92% 24,87% 28,50%
(husband/wife/
parter) only 23,33% 29,41% 29,41% 36,77% - 12,66% 28,81% 21,12% 14,57% 17,15% both 36,67% 29,41% 32,35% 33,82% - 44,94% 38,14% 45,34% 60,43% 54,35%
36
Table 7 – Distribution of who has Individual retirement accounts in SHARE population (population aged between 50 and 65)
Who has individual retirement accounts - 50-65
All countries Austria Denmark France Germany
w2 w4 w2 w4 w2 w4 w2 w4 w2 w4
refusal 0,30% 0,31% - - 0,70% - - 0,79% 0,92% -
don't know 0,20% 0,31% - - - 0,32% 0,63% 0,39% - -
respondent only 28,37% 30,10% 31,25% 30,27% 27,62% 25,56% 31,25% 31,03% 32,11% 29,23%
(husband/wife/
parter) only 16,45% 15,41% 21,87% 15,60% 13,99% 11,82% 15,00% 11,66% 11,93% 21,54% both 54,68% 53,87% 46,88% 54,13% 57,69% 62,30% 53,12% 56,13% 55,04% 49,23%
Total observations 1 015 1 628 32 218 286 313 160 506 109 65
Who has individual retirement accounts - 50-65
Italy Netherlands Portugal Spain Sweden
w2 w4 w2 w4 w2 w4 w2 w4 w2 w4
refusal - - - 0,78% - -
don't know - - - 2,02% 1,35% - - -
respondent only 26,09% 40,91% 40,50% 29,30% - 38,38% 28,38% 32,03% 21,83% 26,62%
(husband/wife/
parter) only 30,43% 27,27% 34,18% 40,40% - 15,15% 29,73% 18,75% 10,71% 10,26% both 43,48% 31,82% 25,32% 30,30% - 44,44% 40,54% 48,44% 64,46% 62,82%
Total observations 23 44 79 99 - 99 74 128 252 156
Table 8 – Distribution of who has Individual retirement accounts in SHARE population (population aged more than 65)
Who has individual retirement accounts - > 65
All countries Austria Denmark France Germany
w2 w4 w2 w4 w2 w4 w2 w4 w2 w4
refusal 0,16% - - - 0,41% - 0,37% - - -
don't know 0,24% 0,18% - 2,22% - - 0,74% 0,21% - -
respondent only 27,58% 26,08% 31,82% 22,22% 30,08% 32,19% 21,19% 19,79% 30,87% 13,79%
(husband/wife/
parter) only 17,27% 15,70% 31,82% 17,78% 16,26% 17,12% 15,24% 8,63% 19,75% 48,28% both 54,75% 58,04% 36,36% 57,78% 53,25% 50,69% 62,46% 71,37% 49,38% 37,93%
Total observations 1 222 1 089 22 45 246 146 269 475 81 29
Who has individual retirement accounts - > 65
Italy Netherlands Portugal Spain Sweden
w2 w4 w2 w4 w2 w4 w2 w4 w2 w4
refusal - - - -
don't know - - - 0,20% -
respondent only 85,71% 42,86% 35,09% 29,73% - 45,76% 38,64% 36,37% 26,41% 29,46%
(husband/wife/
parter) only - 42,86% 22,81% 27,03% - 8,48% 27,27% 30,30% 16,53% 21,32% both 14,29% 14,28% 42,10% 43,24% - 45,76% 34,09% 33,33 56,86% 49,22%