M
ASTER OF
S
CIENCE IN
FINANCE
M
ASTERS
F
INAL
W
ORK
PROJECT
EQUITY RESEARCH
:
REN-
REDES
ENERGÉTICAS
NACIONAIS,
S.G.P.S.,
S.A.
H
ENRIQUE
C
ARVALHO
A
LVES DE
A
MORIM
M
ASTER OF
S
CIENCE IN
FINANCE
M
ASTERS
F
INAL
W
ORK
PROJECT
EQUITY RESEARCH
:
REN-
REDES
ENERGÉTICAS
NACIONAIS,
S.G.P.S.,
S.A.
H
ENRIQUE
C
ARVALHO
A
LVES DE
A
MORIM
S
UPERVISOR
:
Prof. Doutora Clara Patrícia Costa Raposo
Abstract
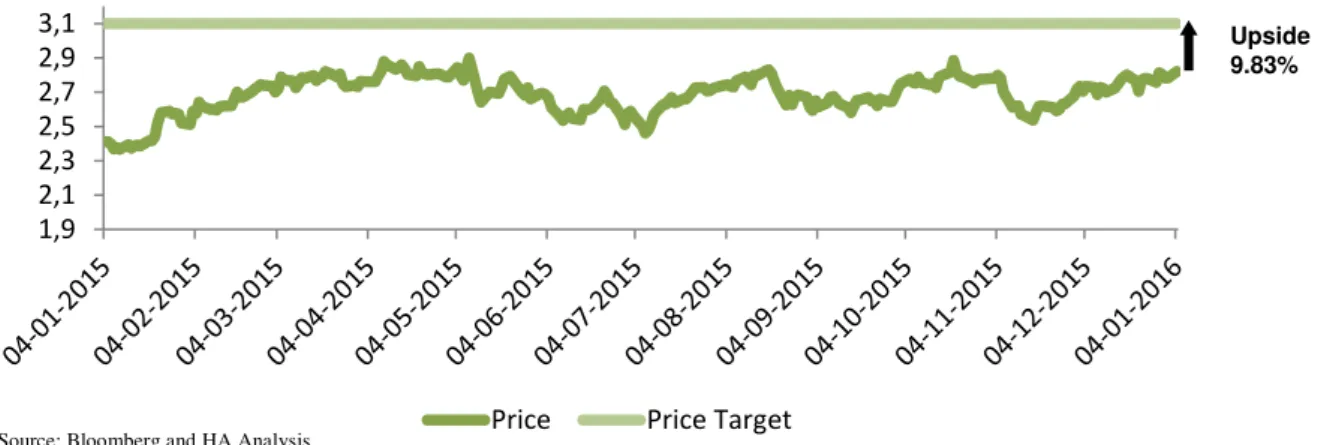
This study contains the valuation and the respective estimation of REN´s intrinsic share
value for 04/01/2016.
Our Equity Research is a continuation of the implementation process of a new
presentation format for this kind of project, combining the rules and style of ISEG´s
Master Final Project and the CFA Institute (Pinto, Henry, Robison, and Stowe, 2010)
recommendations.
REN's choice comes from my personal interest in the energy sector and from its
complex system, from production to the final consumer, being that REN is in the
mid-term of this path, through the transportation of electricity and natural gas.
The price target was reached by using the most appropriate method in terms of
absolute valuation, the Discounted Cash Flow (DCF) Approach.
With a price target of 3.10€ and an upside potential of 9.83% relatively to the share
price at 04/01/2016 (2.82€), the final recommendation
for REN stands for
Neutral
.
Keywords:
REN- Redes Energéticas Nacionais, S.G.P.S., S.A.; Regulation; ERSE;
DCF Valuation.
Resumo
Este estudo contém a avaliação e a respetiva estimativa do valor intrínseco da ação
da REN para 04/01/2016.
O nosso Relatório de Avaliação é uma continuação do processo de implementação
de um novo formato de apresentação para este tipo de projeto, agregando as regras
e estilo do Trabalho Final do Programa de Mestrado do ISEG e as recomendações do
CFA Institute (Pinto, Henry, Robison, and Stowe, 2010).
A escolha da REN provém do meu interesse pessoal no setor energético e do seu
complexo sistema, desde da produção ao consumidor final, sendo que a REN
encontra-se a meio termo deste trajeto, através do transporte de eletricidade e gás
natural.
O preço-alvo foi alcançado usando o método mais apropriado em termos de avaliação
absoluta, o método dos Fluxos de Caixa Descontados (DCF).
Com um preço-
alvo de 3.10€ e um potencial de valorização de 9.83% em relaçã
o ao
preço da ação em 04/01/2016 (2.82€), a recomendação final para a REN é
Neutro
.
Palavras-Chave:
REN- Redes Energéticas Nacionais, S.G.P.S., S.A.; Regulação;
Acknowledgements
To Professor Clara Raposo, thank you for the support, time, patience and friendship
that you had for me during this long process, especially for encouraging me to
overcome the barriers we found during the work process, I can truly say that I grew as
a person with your guidance.
Index
Research Snapshot
...
1
Business Description
...
2
REN´s Introduction ... 2
History ... 2
Main Activities ... 2
Operations ... 2
Company Strategies ... 4
Management and Corporate Governance & Social Responsibility
...
5
Corporate Governance ... 5
Social Responsibility ... 5
Corporate Structure ... 6
Shareholder Structure ... 6
Industry Overview
...
7
Global Economic Outlook ... 7
China Economic Outlook ... 7
Eurozone ... 7
Portugal Economic Outlook ... 8
Energy Sector Outlook ... 8
Regulatory Environment ... 9
Debt and Financing ... 9
Peer Group ... 10
Competitive Position ... 10
Investment Summary
...
11
Valuation
...
12
Valuation Methods ... 12
Historical Financial Analysis ... 12
Forecast Analysis ... 14
Valuation Methodology ... 17
Multiples Approach ... 18
Forecast Financial Analysis ... 19
Investment Risks
...
21
Risk to Price Target Analysis ... 22
Appendix
...
25
Abbreviations
...
51
Appendix
Appendix 1-
REN´s Balance Sheet (€Millions)
25
Appendix 2-
REN´s Consolidated and Individual Profit & Loss (€Millions)
27
Appendix 3-
REN´s Net Working Capital (€Millions)
29
Appendix 4- REN´s Cash Flow Stat
ement (€Millions)
30
Appendix 5- Balance Sheet Assumptions
31
Appendix 6- Profit & Loss Assumptions
32
Appendix 7- REN´s Key Financial Ratios
34
Appendix 8- DCF Valuation
35
Appendix 9- Multiple Valuation
36
Appendix 10- Electricity Complex Transmission System
38
Appendix 11- Electricity Transmission´s Grid Value Chain
39
Appendix 12- Natural Gas Complex Transmission System
40
Appendix 13-
Natural Gas Transmission’s Grid Value Chain
41
Appendix 14- Pilot Zone Development Plan for ENONDAS
42
Appendix 15- REN´s Corporate Governance
42
Appendix 16- REN´s Shareholder Structure 31/12/2015 (Exact Number)
44
Appendix 17-Shareholder Structure (Graph)
45
Appendix 18- Electricity and Natural Gas Infrastructures (31/12/2015)
46
Appendix 19- Electricity and Natural Gas Concessions
46
Appendix 20- REN´s Allowed Revenues
48
List of Figures
Figure 1- Historical Share Price
1
Figure 2- REN`S Logo
2
Figure 3- Electricity Complex System
2
Figure 4- Natural Gas Complex System
3
Figure 5- Dividends per Share
4
Figure 6- REN´s Corporate Governance
5
Figure 7- REN´s Corporate Structure
6
Figure 8- Global GDP Growth
7
Figure 9- GDP Growth for Advanced and Developing Economies
7
Figure 10- China´s GDP Growth and Inflation
7
Figure 11- Eurozone´s GDP Growth and Inflation
8
Figure 12- Eurozone`s Investment and Unemployment Rate
8
Figure 13- Portugal´s GDP Growth and Inflation
8
Figure 14- Portugal´s Investment and Unemployment Rate
8
Figure 15- Renewable and Non-Renewable Electricity Production
9
Figure 16-REN´s Revenues by Weight (2015)
11
Figure 17- % of Total Revenue by Area of Activity
12
Figure 18- REN´s Total Revenue 2012-
2015 (€Millions)
12
Figure 19-
Sources of Total Revenue (€ Millions)
12
Figure 20- Return on RAB by Ar
ea (€ Millions)
13
Figure 21-
Construction Costs, Revenues and CAPEX (€Millions)
13
Figure 22-
Earnings per Year (€Millions)
13
Figure 23-
Total Revenues Forecast (€Millions)
14
Figure 24-
Electricity Return on RAB (€Millions)
15
Figure 25- Forecast ROR
15
Figure 26-
Gas Return on RAB (€Millions)
15
Figure 27-
Forecast of OPEX and OPEX Revenues (€Millions)
16
Figure 28- Forecast CAPEX, Construction Costs and Revenues (
€Millions)
16
Figure 29-
Forecast Debt (€Millions)
16
Figure 30- REN`S Capital Structure
17
Figure 31-
REN´s Revenue Sources (€Millions)
20
Figure 33- REN´s Main Financial Ratios
20
Figure 34- REN´s Risk Matrix
21
Figure 35- Weight of Tax Expenses
21
Figure 36- Interest
Paid on Debt (€Millions)
22
List of Tables
Table 1- REN´s Key Information
1
Table 2- Investment Grade and Risk Classification Matrix
1
Table 3- Forecast Multiples Approach
1
Table 4-
Financial Highlights (€Millions)
1
Table 5-
Proposed Allocations of the 2015 Net Profit (€Millions)
4
Table 6- Number of Employees
5
Table 7- Employees Gender
5
Table 8- Portugal Natural Gas Consumption
9
Table 9- Portugal Electricity Consumption
9
Table 10-
RAB (€Millions)
9
Table 11- REN´s Rating
9
Table 12-
Gross Debt Breakdown (€Millions)
10
Table 13- SWOT Analysis
10
Table 14-
REN´s Financing Sources (€Millions)
10
Table 15- ROR Base
12
Table 16- Net Debt 2012-
2015 (€ Millions)
14
Table 17-
Electricity Revenues Sources (€Millions)
14
Table 18-
Forecast RAB (€Millions)
15
Table 19-
Gas Revenue Sources (€Millions)
15
Table 20-
CAPEX (€Millions)
16
Table 21-
Gross to Net Debt (€Millions)
16
Table 22- DCF Price Target
17
Table 23-
FCFF Calculation (€Millions)
17
Table 24- WACC Calculation
18
Table 25- Peers Multiples 2016F
18
Table 26- EV/EBITDA Multiple
19
Table 27- P/E Multiple
19
Table 28- P/Book Multiple
19
Table 29- Forecast Multiples Approach
19
Table 33- MRP Sensitivity Analysis and Percentage Variation
23
Table 34- WACC and g Sensitivity Analysis
23
Table 35- WACC and g Percentage Variation
24
Table 36- MRP and CP Sensitivity Analysis
24
1,9 2,1 2,3 2,5 2,7 2,9 3,1
Price Price Target
Source: Company Data and HA Analysis
REN- Redes Energéticas Nacionais, S.G.P.S., S.A. (REN) is a Portuguese company that has two main areas of activity: electricity and natural gas. Besides these main areas, REN has companies like RENTELECOM, ENONDAS, REN Trading, REN Serviços and REN FINANCE BV.
With a price target of 3.10€ and using an investment grade and risk classification matrix in Table 2, based on the BPI´s system of classification, our recommendation stands for Neutral.
The price target was achieved by executing the Discount Cash Flow Valuation Method (DCF) for a forecast period between 2016F to 2021F. With this price target we concluded that REN, relatively to the price at 04/01/2016 of 2.82€, was
undervalued with an upside potential of 9.83%.
Besides this method, we used the Multiples Approach Valuation as a support to the DCF Valuation (Table 3).
In terms of risk assessment, we determined that REN had a low risk of investment
due to the fact that the company does not have any competitors and because the main risk, that has a high probability of occurring and a high impact, is the ERSE regulation. From our forecast, it is expected that REN´s profitability will decreased in the first year comparing it to 2015 (Table 4), from an EBITDA of €490 Million in 2015 to €454 Million
in 2016F. The next years will be marked by a recovery in terms of profitability due to an increase in the revenues and a reduction in the costs. At the same time, REN´s debt will decrease and the dividend policy will maintain, with 0.17€ per share.
Research Snapshot
REN´s Key Information
Ticker
Reuters RENE.LS Industry Energy High 2.90€ Listed Euronext Lisbon
Ticker
Bloomberg RENE PL Share Capital €534 Million Low 2.38€ IPO Date 09/07/2007 Website http://www.ren.pt/ Nº Shares 534 Million 04/01/2015 Price at 2.82€ Price Target 3.10€
Table 1- REN´s Key Information
Risk Low Medium Risk Risk High Buy >15% >20% >30%
Neutral >5% and <15% >10% and <20% >15% and <30%
Reduce >-10% and <5% >-10% and <10% >-10% and <30% Sell <-10% <-10% <-10% Table 2- Investment Grade and Risk Classification Matrix
Price Potential EV/EBITDA 3.12 € 10.61%
P/E 2.10 € -25.39% P/B 4.39 € 55.78% Average 3.21 € 13.67%
DCF
valuation 3.10 € 9.83% Table 3- Forecast Multiples Approach
Table 4- Financial Highlights (€Millions)
2012 2013 2014 2015 2016F 2017F 2018F 2019F 2020F 2021F Total
Revenues 811 789 756 819 717 724 730 681 688 697
EBITDA 512 522 505 490 454 467 476 475 486 499
EBIT 314 320 303 280 251 266 277 277 292 308
Net Profit 124 121 113 116 77 88 98 99 113 130
Dividend
per Share 0.17 0.17 0.17 0.17 0.17 0.17 0.17 0.17 0.17 0.17
Neutral
Low Risk
January 2016
Portugal
Source: Company Data and HA Analysis
Figure 1- Historical Share Price
Upside 9.83%
Source: Bloomberg and HA Analysis
Source: BPI Rating Scheme
REN´S Introduction
REN-Redes Energéticas Nacionais S.G.P.S., S.A. (REN), Figure 2, is a Portuguese listed company in which the main activity is the management of the energy National Transmission Grid (NTG), with presence in the areas of electricity and natural gas in Portugal, taking pride on being one of the few operators in Europe with these characteristics.
One of the most important aspects in REN is the fact that the company is regulated. This regulation comes from the fact that REN is a monopoly in the Portugal energy sector (in terms of the NTG), managing the concessions, appendix 19, provided by the Portuguese State. The regulation of the energy sector is in charge of the Energy Services Regulatory Authority (ERSE) and by the Portuguese Competition Authority and Directorate General for Energy and Geology (DGEG).
History
REN was incorporated on 18/08/1994 under the name of REN – Rede Eléctrica Nacional, S.A. as a result of the spin-off of a business unit of EDP – Energias de Portugal, S.A. (EDP). In November 2000, the Portuguese State acquired a 70% stake in REN from EDP as part of the liberalisation of the domestic energy market, which required the legal separation of electricity transmission, distribution and generation companies. Until September 2006, REN's core business was the operation and technical management of the NTG in Portugal, acting also as a sole purchaser of electricity, through the long-term Power Purchase Agreements (PPAs) executed between 1993 and 1996 with the hydro and thermal electricity generation plants in mainland Portugal.
In September 2006, REN acquired certain assets, from GALP Energia, S.A. (GALP), and companies relating to the transportation and underground storage of natural gas and the Liquefied Natural Gas (LNG) terminal and regasification facility in Sines from Transgás.
On 05/01/2007, REN reorganize the group, becoming a holding company that operates electricity and gas businesses through its subsidiaries and management of the concessions, changing its name to REN – Redes Energéticas Nacionais, S.G.P.S., S.A. (REN).
Main Activities
The two major activities provided by REN are the electricity transmission in high voltage and overall technical management of the National Electric System (NES) and the transportation of natural gas at high pressure and overall technical management of the National Natural Gas System (NNGS), ensuring the reception, storage and regasification of LNG and underground storage of natural gas.
Operations Electricity
In the electrical operations, the transmission of extra high voltage electricity (150, 220 and 400 kV) of the NTG, in that REN Rede Eléctrica (a company wholly owned by REN), holds the service concession public for 50 years, until 2057. The concession includes the planning, construction, operation and maintenance of the NTG and also covers planning and overall technical management of the NES to ensure the harmonized functioning of its infrastructures, service continuity and a secure electricity supply.
REN Rede Elétrica has an electricity complex transmission system, Figure 3, which is based in four pillars (generation, distribution, markets and supply and consumption), Appendix 10, and also respects a transmission´s grid value chain, Appendix 11.
Business Description
Figure 2- REN`S Logo
Source: Company Data
Figure 3- Electricity Complex System
Source: Company Data and HA Analysis Transmission
Generation
Consumption
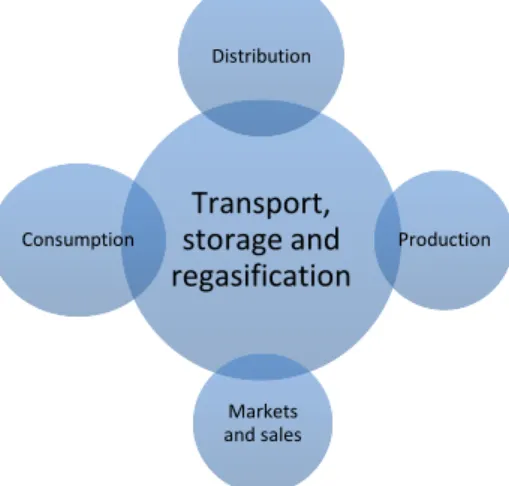
Natural Gas
All the natural gas used in Portugal comes from third countries. A part is received by high-pressure pipeline located in Spain and the other by sea, in the form of LNG.
In terms of the corporate structure role in the natural gas activities, REN Gasodutos
operates theNNGS, which receives the natural gas at the Spanish border, as it leaves storage facilities (REN Armazenagem) or the regasification terminal, in Sines, where the reception, storage and regasification of the LNG is made (REN Atlântico) and then it is delivered to the distributors or high-pressure end users. REN Gasodutos holds the concession for the high-pressure transport of natural gas, which includes overall technical management of the NNGS, through which it coordinates the operation of natural gas distribution and transport infrastructures, ensuring the continuity and security of supply. It is important to note that these activities are also based in a complex transmission system (Figure 4 and Appendix 12) and a transmission´s grid value chain, Appendix 13.
RENTELECOM
RENTELECOM was created in 2002, starting with providing internal services and with leveraging the existing surplus of network capacity in the electricity and gas backbones, but is nowadays an alternative in the wholesale and corporate markets. In terms of positioning, RENTELECOM positions itself on the utilities and telecommunications operators segments, with know-how in solutions for utilities and for telecommunications operators and information technology integrators.
Its business sectors are divided by lease and maintenance of dark fibers, renting spaces and telecommunication infrastructures, housing, leased lines and information technology services.
REN FINANCE BV
REN FINANCE BV works as a special purpose vehicle, meaning that its objective is to issue debt and notes for the parent company, REN.
REN Trading
Company created in 2007, REN Trading has the main purpose of purchase, sale, import and export of electricity and the purchase and selling of power system services as part of the management of the long-term PPAs. The main goal is to maximize profits resulting from the sale of energy and system services on the market and the minimization of costs of the PPAs, according to ERSE, Decree 11210/2008 published in Diário da República.
ENONDAS
Created in 2010, ENONDAS came to exist due to a public concession given by the Portuguese State with the objective of generating wave energy in a Pilot Zone. The public concession is for 45 years and it includes authorization for the installation of infrastructure and connection to the public grid. With this in mind, the company created a Pilot Zone Development Plan (Appendix 14).
REN Serviços
The main purpose for the creation of REN Serviços is to identify and establish business corporation agreements with foreign companies for the electricity or natural gas service infrastructures and the provision of engineering services using REN resources. The investment in foreign companies is a process that is still in the early stage of implementation.
Figure 4- Natural Gas Complex System
Source: Company Data and HA Analysis
Transport,
storage and
regasification
Distribution
Production
0,16 € 0,17 € 0,18 €
20
07
20
09
20
11
20
13
20
15
Dividens per share
Company Strategies
Diversification and business growth through investment in international projects: REN has accumulated experience in the analysis of various markets, opportunities for research, implementation of investment projects and establishing contacts with potential international partners. This strategy comes from REN´s intention of innovating, reinforcing its engineering competitiveness by developing mergers projects and acquisitions as well as Greenfield projects in the segments of electricity transmission and gas. These possible projects are being evaluated in Latin America and Africa regions.
Ongoing commitment to managing the transmission infrastructures of electricity and natural gas in Portugal: Management improvement of the NTG infrastructures
that require the highest level of safety and operational efficiency (Appendix 18). From the management of energy systems, whether of high voltage transmission or natural gas in the components that are in concession.
Looking for opportunities to growth and expand the activity appropriate to the conservative risk profile and financial capacity: This strategy involves working with the Portuguese State, to seek sustainability and rational investments, maintaining the quality of infrastructure and new project developments to satisfy Portugal needs in the energy sector. The investments made in 2015 by REN in Portugal can be seen in Appendix 21.
Management characterized by great discipline and financial control: withthis in
mind, REN already proposed to allocate the 2015 net profit (€116 Million), Table 5. The dividends provided by REN to its shareholders has overall maintained the same (0.171 €), Figure 5.
Table 5- Proposed Allocations of the 2015 Net Profit (€Millions)
Legal Reserves 4.2
Dividends 91.3
Retained
Earnings 14.8
Distribution to Employees
and Subsadiaries 2.4
Source: Company Data and HA Analysis
Figure 5- Dividends per Share
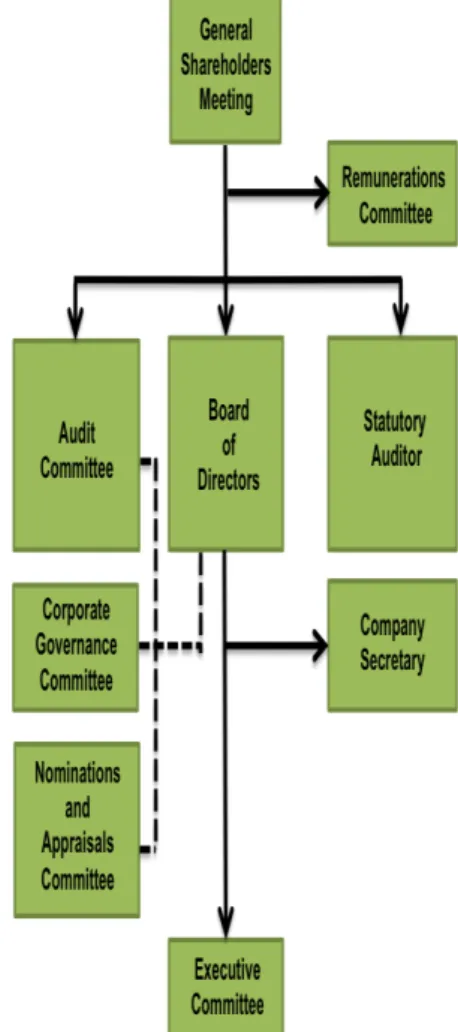
Corporate Governance
REN´s corporate governance, Figure 6 and Appendix 15, is constituted by nine elements, being the most important:
General Shareholders Meeting- consisting of the following members, elected for office corresponding to a three-year-period in the General Shareholders Meeting, Pedro Maia (Chairman of the General Shareholders Meeting Board) and Francisco Santos Costa (Vice-Chairman of the General Shareholders Meeting Board), Appendix 15a.
Board of Directors- composedby 13 members, being that the CEO of the company is Rodrigo Costa, Appendix 15b. These members are also elected in the General Shareholders Meeting.
Executive Committee- the Board of Directors approved to constitute an Executive Committee for the 2015-2017 periods, consisting in three members, Appendix 15c.
Audit Committee- constituted by three independent members, performing its duties of supervision and control of the management activity with autonomy and independence, Appendix 15d.
Statutory Auditor- Deloitte & Associados, SROC S.A. and is also the company´s External Auditor
Remuneration Committee- composedby three independent members, with functions like the identification and clarification of the criteria for determining the remuneration to be paid to members of the corporate bodies, information about the maximum potential on an individual basis to be paid to members of corporate bodies of REN and identifying the circumstances in which these maximum amounts may be payable, Appendix 15e.
Social Responsibility
In terms of social responsibility, REN has created three fundamental pillars, which are,
internal health promotion, involvement and satisfaction of interested parties and
environmental protection.
Internal Health Promotion- this is concentrated in given to their employees, Table 6 and Table 7 the best conditions, providing them a work environment in which they can show their attributes, contributing to their personal growth and for the proper functioning of the organization. This is made by ensuring diversity and equal opportunities, and that all their high standards of hygiene, health and safety are met. With this in mind, REN started creating initiatives like NÓS Program (30 initiatives, 189 participants under the three axes that make up the balance, equality and inclusion) and REN Run Club.
Involvement and Satisfaction of Interested Parties- this pillar focus on the local communities, which means that REN tries to promote an inclusive culture that encourages the involvement of all stakeholders and to give communities an active role, listening to concerns and recommendations, encouraging and rewarding good initiatives, and creating a positive impact on the Portuguese population. This is made with initiatives like Prémio Agir da REN (creating solutions to social problems), Prémio REN (scientific nature award that distinguishes the best master's thesis in the field of energy) and
Share Program (corporate volunteer program).
Environmental Protection- REN is committed to be an active agent in environmental protection, implementing reforestation policies, advocating the rational use of natural resources and pollution prevention, supporting the development of renewable energy and playing an active role in preventing climate change. This is made by partnerships with LIFE Elia for Southern Europe (contributing to the sharing of best practices for the preservation of
Management and Corporate Governance & Social
Responsibility
Table 6- Number of Employees Number of Employees
Year 2014 2015
Employees with
and without term 640 620 Professional
trainees 1 -
Total 641 620
Employees Gender
Year 2014 2015
Male 492 470
Female 149 150
Table 7- Employees Gender
Figure 6- REN´s Corporate Governance
Source: Company Data and HA Analysis
Source: Company Data and HA Analysis
the Mediterranean ecosystems) and Fundação para a Ciência e Tecnologia
and Universidade do Porto (with biodiversity initiatives).
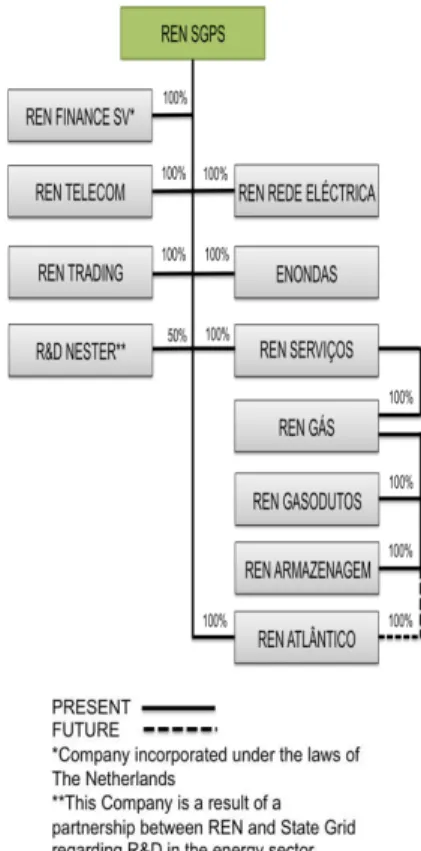
Corporate structure
REN´s corporate structure, as seen in Figure 7, shows that the company controls all of their eleven companies by 100%, with the exception of R&D NESTER,which is a partnership with STATE GRID for development and investigation (I&D) in the energy sector. Besides this, all the other companies are fully controlled by REN.
It is also relevant to affirm that, relatively to partnerships, REN also has one with RED ELÉCTRICA CORPORACIÓN and ENAGÁS.
In the wake of the agreement between Portugal and Spain on the matter of establishing an Iberian market for electricity, REN holds 40% in the capital of OMIP (Iberian Market Operator (Portugal), SGPS, SA) (which in turn holds 50% of the share capital of OMIP, Management Company Regulated Market, SGMR, SA (which in turn holds 50% of OMI CLEAR - Society of Energy Markets Compensation, SGCCCC, SA and 50% of OMI - Polo Español SA (OMEL)).
REN also has 10% in CORESO, S.A. 7.5% in Hidroeléctrica of Cahora Bassa, S.A., 1% in Red Eléctrica Corporación, S.A. and 8% in Medgrid SAS.
Shareholder Structure
The shareholder structure (Appendix 17), at 31/12/2015, had a share capital of
534,000,000€ with a nominal value of 1€ representing 534,000,000 common stocks,
with no special rights to their holders.
When addressing REN´s shareholder structure it is important to have in mind, that the company went through two phases of re-privatization (both in 2014) due to the fulfillment of the objectives set out in Economic and Financial Assistance Program
and the Fundamental Law on Privatization to foster the diversification of the shareholder structure and liquidity of the shares.
There is 38% of free float and 0.7% own shares. Due to restrictions on the ownership of shares, in legal terms, no entity, in Portugal or abroad, may hold, directly or indirectly, more than 25% of the share capital of REN, which is applied to the two main private shareholders, State Grid of China (25%) and Oman Oil (15%).
The exact number of shares of each entity and of the Board of Directors is given on Appendix 16.
Figure 7- REN´s Corporate Structure
Source: IMF, World EconomicOutlook Database and HA Analysis
Global Economic Outlook
Since the energy sector in Portugal depends on third parties, it´s is important to have an idea of the Global GDP growth and its forecast for the following years (Figure 8). The global economic outlook is favorable. From 2014 to 2015 there was a decrease in terms of the GDP growth (-0.32%), but it´s expected to growth in the following years, based on the IMF forecasting.
Figure 9 shows the GDP growth in the advanced and developing economies, giving a deeper analysis of the global economic outlook.
In the case of the advanced economies, from 2014 to 2015 there was a small improvement in terms of the GDP growth (+0.05%) due to the economic growth in the European Union (1.44% in 2014 to 1.99% in 2015). IMF expects that the GDP growth will maintain constant in the following years, between 1.85% and 1.95% until 2021. Outside the European Union, in USA there was a very small negative growth (-0.002%) from 2014 to 2015 but it´s expected, by IMF, to maintain constant in the following years.
Developing economies are characterized by a negative growth from 2014 to 2015 (-0.62%), due to a stagnation in Latin America, especially Brazil (which is in a recession) and from a slowdown in the economic growth in some Asian countries. Nevertheless, the IMF expects an improvement in these emerging economies for the following years.
China Economic Outlook
China is an important player to REN due to the fact that one of their biggest private shareholders is State Grid of China and, in terms of financing, Chinese entities play a big role in funding REN.
In Figure 10, there is a clear tendency of decrease for the GDP growth in China (7.30% in 2014 to 6% in 2021, according to IMF forecast), which can create speculation of a bad future performance of China economy (less investment, less bank loans, for example). The inflation on the other hand has an increasing tendency until 2021, according to IMF forecast.
The China economic outlook may present a moderate risk to REN.
Eurozone
The Eurozone has a very important role in REN´s activity due to the fact that, being REN a company with headquarters and activity in Portugal and being that Portugal is a member of the Eurozone, the policies created by entities like the European Central Bank (ECB) and the economic performance of Eurozone members are important because REN distributes energy (electricity and natural gas) from third countries (the natural gas comes from Spain and the NTG for the electricity is connected with the European Transport Grid that is connected to the Spanish Transport Grid).
In terms of GDP growth and inflation in the Eurozone (Figure11) between 2014 and 2015 there was a significant growth in the GDP (+0.75%, being that the IMF expects it to maintain overall constant for the following years) and a deflation rate of 0.40%, being that the IMF expects a significant rise of the inflation rate for the following years, especially after the ECB decided to implement expansionist monetary policies alongside with a better access to credit and low interest rates for the foreseeable future for the banks. These types of measures are expected to increase the investment and lower the unemployment rate in the Eurozone (Figure12).
Relative to the reference interest rate for ECB (Euribor), it has been characterized by a downward trend from 2014 to 2015. The 3month Euribor went from +0.76% to -0.13%, the 6-month Euribor went from 0.18% (2014) to -0.04% (2015) and 12-month Euribor from 0.33% to 0.06%. This is happening due to the actions of the ECB as mention before.
Industry Overview
0% 1% 2% 3% 4% 20 14 20 15 20 16F 20 17 F 20 18F 20 19F 20 20F 20 21F GDP Growth 2% 3% 4% 5% 6% 20 14 20 15 20 16F 20 17F 20 18 F 20 19F 20 20F 20 21F Advance Economies Developing Economies 0% 2% 4% 6% 8% 20 14 20 15 20 16F 20 17F 20 18F 20 19F 20 20F 20 21F GDP Growth Inflation Figure 8- Global GDP GrowthSource: IMF, World EconomicOutlook Database and HA Analysis
Figure 9- GDP Growth for Advanced and Developing Economies
Source: IMF, World EconomicOutlook Database and HA Analysis
Source: IMF, World EconomicOutlook Database and HA Analysis
Source: IMF, World EconomicOutlook Database and HA Analysis
The economic outlook in the Eurozone gives an idea of a favorable environment to REN.
Portugal economic outlook
REN´s activity is based and regulated in Portugal, meaning that the economic performance of the country impacts in a substantial way the positioning of the company in the Portuguese energy market.
Figure 13 shows that the GDP had a rise of +0.56% from 2014 to 2015 due to, especially, a rise in the exports of goods and services (+0.66%) in Portugal from 2014 to 2015. The IMF expects a reduction of the GDP growth for the following years. Relatively to the inflation rate it seems to follow the trend of the inflation rate in the Eurozone (Figure 11), meaning that from 2014 to 2015 and for the following years (IMF forecast), because of ECB measures to stimulate the Eurozone economies, it´s expected, overall, to increase as well.
In terms of investments and unemployment rate in Portugal (Figure14), the investment in Portugal tends to have its ups and downs (IMF forecast), but the unemployment rate follows the decreasing trend in the Eurozone.
The general government net debt, in terms of percentage of GDP, in 2014 was 120.03% and IMF expects that, for 2015 and the following years, to maintain between 120% and 119% of the Portugal GDP.
The Portugal economic outlook appears to be favorable to REN.
Energy sector outlook
In a global level, there are early signs of a new era for energy worldwide because of aspects like (1) the sharp drop in oil prices that was accompanied by the prices of other fossil fuels in many countries; (2) more than half of the new production capacity installed in 2014 worldwide, respects renewable technologies; (3) more regulatory binding to energy efficiency worldwide and (4) other aspects that are changing the energy sector in the world.
The International Energy Agency (IEA), in a scenario of new policies, shares their vision of the evolution in the energy market until 2040. The IEA expects: (1) an increasing demand of natural gas, derived by a growth of development economies, (2) a continuous rise on the demand of the electricity, continuing the impact of the numerous environmental problems, but with an increasing use of renewable energy sources, especially in the European Union, where IEA expects a growth of 50% in the renewable energy usage until 2040.
In Portugal, the electricity consumption (Table 9), has been oscillating since 2011, but from 2014 to 2015, the electricity consumption increased by 0.2 TWh, showing a recovery and a stabilization of the consumption in Portugal that can be explain by the improvement of the country economy, which means that the energy consumption is correlated to Portugal economic health.
The production of renewable energy for electricity, between 2014 and 2015, didn´t follow the trend establish in Europe and in the advanced economies, Figure 15. In terms of natural gas consumption in Portugal (Table 8), the consumption is the sum from the usage in the conventional market and the electric market, which, from 2011 to 2014 suffered a fall in the consumption but with a recovery in 2015 of 15.3% relatively to the 2014 consumption, pointing to the fact that the natural gas consumption in Portugal is also correlated to the economic health of the country.
The increasing energy consumption in Portugal gives a favorable environment to the company. 0,0% 0,5% 1,0% 1,5% 2,0% 20 14 20 16F 20 18F 20 20F GDP Growth Inflation 5% 10% 15% 20% 20 14 20 15 20 16F 20 17F 20 18F 20 19F 20 20F 20 21F
Investment (% of the GDP)
Unemployment rate -0,20% 0,30% 0,80% 1,30% 1,80% 20 14 20 16F 20 18F 20 20F
GDP Growth Inflation
7% 11% 15% 19% 20 14 20 15 20 16F 20 17F 20 18F 20 19F 20 20F 20 21F
Investment (% of the GDP)
Unemployment rate
Figure 11- Eurozone´s GDP Growth and Inflation
Figure 12- Eurozone`s Investment and Unemployment Rate
Source: IMF, World EconomicOutlook Database and HA Analysis
Figure 13- Portugal´s GDP Growth and Inflation
Figure 14- Portugal´s Investment and Unemployment Rate
Regulatory environment
As mention before, REN is a monopoly due to the fact that the company has concessions given to them for the two major activities (transmission of electricity and natural gas).
The company obtains close to 100% of its revenues from the electricity and natural gas distribution and\or supply companies that are charged according to the tariffs set annually by the independent regulator (ERSE). REN is not exposed to electricity/gas volumes or commodity prices, as its revenues depend entirely on regulatory parameters reviewed every 3 years, meaning that the revenues should be titled
allowed revenues (Appendix 20). One of the main parameters of the allowed revenues is the ROR or the Rate of Return on RAB, a variable rate (different for electricity and gas) that is set yearly by ERSE and that is indexed to the average Portuguese sovereign 10-year bond yields (OT’s). This ROR is then multiplied with the
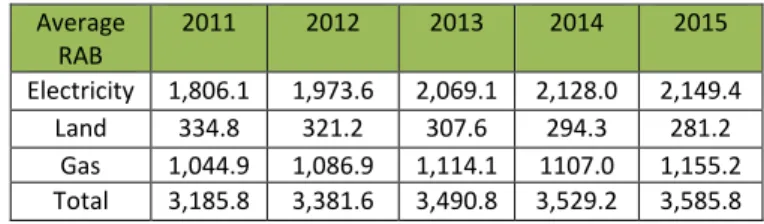
RAB (Regulated Asset Base). RAB is based on the value of the concession assets plus premiums attributed by the regulator, Table 10.
REN depends on the allowed revenues establish by ERSE, representing a higher risk
to the company environment due to the fact that the company is totally reliant on the parameters created by the regulator every 3 years.
Debt and Financing
In terms of debt, 2015 was marked by a decreased of the cost of debt, from4.7% (2014) to 4.1% in 2015. This reduction came from the continuous improvement of the macroeconomic situation in the country and the improvement of REN´s profile risk, for example, a better risk valuation from Standard & Poors, from BB+ to BBB-. In Table 11, we can see REN´s Rating from the 3 major Rating Agencies.
The net debt, from 2014 to 2015, had an increase of +1.2% (29.3€M). The Table 12 shows the items from the gross debt value to the net debt value in 2014 and 2015. In terms of financing, the company is already funded beyond 2016. The major actions taken by REN in 2015 were: (1) an international bond issue of €300 Million with a maturity of 10 years; (2) prepaid two bank loans, totaling €175 Million, whose counterparts were ICBC (Industrial and Commercial Bank of China) and the CBD (China Development Bank), consequently, under credit lines of which effected the financing was extinguished; (3) celebration of a revolving credit facility of €120 Million with ICBC and a maturity of 5 years; (4) it was signed with the EIB (European Investment Bank) a new long-term financing to the amount of €80 Million and (5)
€
Year conventional
Market (TWh) Electric Market (TWh)
Total Consumption
(TWh)
2011 36.2 21.3 57.5
2012 38.3 11.9 50.2
2013 44.5 3.4 47.9
2014 42.1 3.2 45.3
2015 41.2 11.0 52.2
Table 8- Portugal Natural Gas Consumption
Table 9- Portugal Electricity Consumption
Year Consumption (TWh) 2011 50.5 2012 49.1 2013 49.2 2014 48.8 2015 49.0
Table 10- RAB (€Millions)
Average RAB
2011 2012 2013 2014 2015
Electricity 1,806.1 1,973.6 2,069.1 2,128.0 2,149.4 Land 334.8 321.2 307.6 294.3 281.2
Gas 1,044.9 1,086.9 1,114.1 1107.0 1,155.2 Total 3,185.8 3,381.6 3,490.8 3,529.2 3,585.8
Table 11- REN´s Rating
Rating Long term Short term Outlook Moody's Baa3 - Stable Standard
& Poor's BBB- BB+ Positive
Fitch BBB F3 Stable
Source: Company Data and HA Analysis
Source: Company Data and HA Analysis Figure 15- Renewable and Non-Renewable Electricity Production
Source: Company Data and HA Analysis
The financing sources can be seen in Table 14.
The environment surrounding REN´s debt and financing may impose a moderate risk
to the company.
Peer Group
This point will stand out when analyzing the Multiples Approach,but the main aspect of this topic is the fact that REN doesn´t have any competitors in their activity in Portugal due to the fact that REN operates under concessions granted to them, making the company a monopoly in their activity.
From a multiple perspective it is difficult to find a truly comparable peer group due to the fact that none of the European players have an exactly comparable regulation
and most of the peers are focused on one sector (electricity, gas or water). The peer players that are going to be used are REE (Red Eléctrica Corporación SA),
TERNA, EVNGroup and IREN.
The process of the peer group selection is explained in Appendix 9.
REE
REE is a Spanish company that operates in the high-voltage electricity grid in Spain, with 42,008KM of lines. This company is the closest comparable company to REN due to the fact that it operates in the same single Iberian market with a similar regulatory framework, for example, REE is remunerated on a Net RAB system.
TERNA
TERNA is an Italian company that operates the electricity high-voltage grid in the country with over 63,500Km. The company is remunerated under a Net RAB system.
EVNGroup
EVN is an Austrian company founded in 1922 that produces and transports electricity as the main activity. Beside this, the company also operates in natural gas supply, water treatment and waste management.
EVN operates in a large scale, operating in Austria, but also Germany, Bulgaria, Macedonia and Croatia.
IREN
IREN is an Italian company that operates in the sector of electricity and natural gas (production, in the electricity sector, distribution and sale), management of integrated water services and thermal energy for district heating.
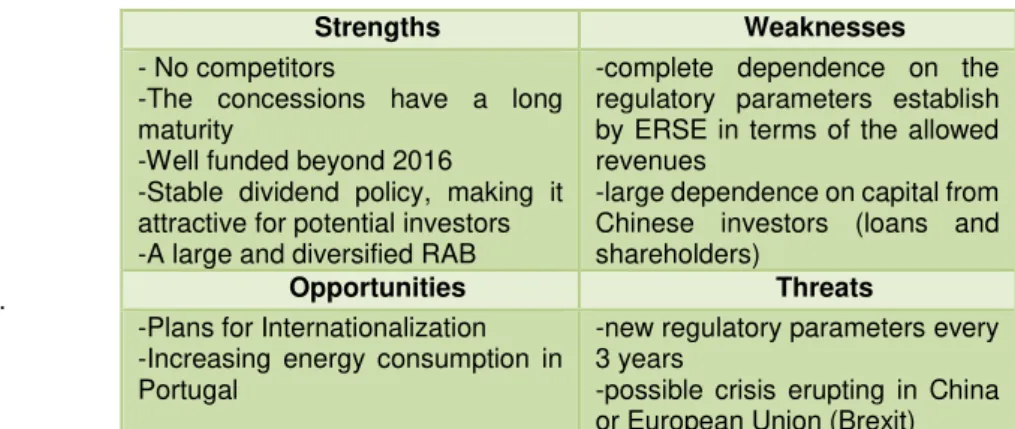
Competitive Position
For the REN´s competitive position, a SWOT analysis (Table 13) is important, due to the fact that this analysis can give an idea of REN´s position in the market.
.
Table 12- Gross Debt Breakdown (€Millions)
2014 2015
Gross Debt 2,604.5 2,542.0 minus
hedging
swaps 17.9 12.8
minus cash and cash
equivalents 114.3 63.7 minus
finacial
pledge 99.4 -
minus
others -63.3 -
Net Debt 2,436.2 2,465.5
2014 2015
Bonds 1,354.2 1,535.7 Bank
Borowings 859 618.5
Commercial
Paper 377 365
Bank
Overdrafts 1.7 0.1
Leasing 3.3 3.1
Sub-Total 2,595.2 2,522.4 Accrued
Interest 25.8 29.9 Prepaid
Interest - 16.6 -10.2 Total 2,604.5 2,542.0
Table 13- SWOT Analysis
Table 14- REN´s Financing Sources (€Millions)
Strengths Weaknesses
- No competitors
-The concessions have a long maturity
-Well funded beyond 2016
-Stable dividend policy, making it attractive for potential investors -A large and diversified RAB
-complete dependence on the regulatory parameters establish by ERSE in terms of the allowed revenues
-large dependence on capital from Chinese investors (loans and shareholders)
Opportunities Threats
-Plans for Internationalization -Increasing energy consumption in Portugal
-new regulatory parameters every 3 years
-possible crisis erupting in China or European Union (Brexit)
Source: Company Data and HA Analysis
63% 33%
4%
Electricity
Gas
Others With a price target of 3.10€, an upside potential of 9.83% relatively to the price at
04/01/2016 (2.82€) and a Low Risk assessment (please refer to the Business Snapshot section and Table 2), our recommendation stands for Neutral.
In terms of valuation methodology, we used the DCF Valuation Method to obtain the price target.
Besides this method, we used the Multiples Valuation Approach. By selecting a peer group, we used this method to support and consolidate the position define in the DCF Valuation.
REN was characterized by an overall stable stock performance in 2015, with the price achieving a maximum value of 2.90 € in 08/05/2015 and a minimum value of 2.38€ in
09/01/2015.
In terms of dividend policy, REN tries to deliver a dividend per share of 0.171€ every
year to its shareholders, dispending from its resources an approximated value of
€91.32 Million.
REN´s main objective is to provide a public service more efficient, safer and a competitive energy system that ensures access to energy for all, at the lowest possible cost.
It has two main activities areas: the electricity and the natural gas, managing the NES
and NNGS for each activity respectively. Besides these two main areas of activity, REN has other businesses like RENTELECOM and ENONDAS, for example, but in a smaller scale (Figure16).
REN is a pure regulated player, meaning that its activity in supervise by a third party, which in the case of the energy market, the supervisor is ERSE.
ERSE is an independent entity, with the main objective of protecting the consumer’s
interests regarding prices, service quality and access to information in terms of the energy market (electricity and natural gas).
ERSE establishes parameters for the base of calculation of REN´s revenues (allowed revenues) and decides if approves or not the investment plans (CAPEX) presented by REN.
This leads us to the main divers of REN´s growth. Due to the big role that the regulator has on REN, the biggest driver of the company, in our consideration, is the ERSE regulation. This driver conditions REN in terms of revenues, for example in establishing the ROR and RAB (where the value of return on RAB arrives from, which in the main driver in terms of revenues), the recovery of depreciation, the construction revenues and costs and in terms of the CAPEX approval.
In terms of the risk to price target, REN´s main vulnerability is its biggest driver, meaning that ERSE regulation has a big role in the risk assessment. This risk covers the fact that, depending from the parameters defined by the regulator, REN´s profitability can be damaged.
Besides this main risk, REN has others that have a small impact or a low probability of happening, which lead us to believe that REN is a low risk company. Another fact that endorses this low risk assessment is due to the lack of competitors that REN has because of the concessions and their duration conceded by the Portuguese State to the company.
Investment Summary
Figure 16-REN´s Revenues by Weight (2015)
REN´s Balance Sheet and Profit and Loss statement (P&L), for the historical and forecast period, can be seen in Appendix 1 and Appendix 2, respectively.
Valuation methods
In terms of absolute valuation, the method used was the Discounted Cash Flow (DCF), using the forecast Free Cash Flow to the Firm (FCFF), being the forecast period from 2016F to 2021F. This let us see how REN´s capital structure is going to vary during the forecast period and how it´s going to affect the evolution of the
Weighted Average Cost of Capital (WACC), allowing us to reach the most reliable enterprise value and price target for the valuation of the company.
Although REN has a stable dividend policy, we assumed that the DCF would fit better as a valuation method for reaching a price target.
In terms of relative valuation, we used the Multiples Approach, using the peers presented in the peer group, please refer to the Industry Overview section. Using this approach we reached a price target derived from the multiples chosen, providing a support and complement to the DCF valuation.
Like it was mention before, REN has two major areas of activity (electricity and natural gas), which represent almost 100% of the company total revenues (Figure 17). We decided that it was imperial and necessary to separate the total revenues and costs between three parts: electricity, natural gas and others. We were obligated to do this due to the fact that REN is a regulated company by ERSE and its revenues arrive from different parameters for each regulated activity, especially for the electricity and gas, meaning that the regulator establishes the way that REN is remunerated, as explained before.
Historical Financial Analysis
The historical period of REN´s analysis covers the years since 2012 to 2015. The total revenues (Figure 18), from 2012(€811 Million) to 2013(€789 Million) decreased and also for 2014 (€756 Million), but increased in 2015 (€819 Million). This happened due to the biggest driver in REN´s performance, the change in the regulation by ERSE. The Figure 19 shows the most important rubrics of the total revenues, the return on RAB (depends on the ROR and RAB), recovery of depreciation, revenues of OPEX and constructions revenues. All of these sources of revenues are affected by the action of the regulator.
Return on RAB- RateReturn on RAB\ROR
The ROR can be considered the biggest driver of REN´s revenues sources. As mention before the ROR is indexed to the average Portuguese sovereign 10-year bond yields
(OT’s) and then multiplied by the RAB, giving the amount for return on RAB, having different base rates for the electricity and gas (Table 15), establish by ERSE. The Figure 20 shows the different return on RAB in the two areas. The reduction that occurred from 2012 to 2015 on the return on RAB is explained by the decreasing tendency in the base of ROR and the decreasing yields in the 10-year Portuguese bonds.
Table 15- ROR Base
Valuation
Base
ROR 2012 2013 2014 2015
Electricity 9.55% 8,06% 7.76% 6%
Gas 8% 8% 7.46% 7.33%
0% 15% 30% 45% 60% 75% 20 12 20 13 20 14 20 15 20 16F 20 17F 20 18 F 20 19F 20 20F 20 21F
Electricity Gas Others
720 745 770 795 820
2012 2013 2014 2015
Total Revenues 90 130 170 210 250 290 20 12 20 13 20 14 20 15
Return on RAB
Recovery of depreciation (net from subsidies) Revenues of OPEX
Construction revenues
Figure 17- % of Total Revenue by Area of Activity
Source: Company Data and HA Analysis
Figure 18- REN´s Total Revenue 2012-2015 (€Millions)
Source: Company Data and HA Analysis
Figure 19- Sources of Total Revenue (€ Millions)
OPEX and Revenues of OPEX
The OPEX is structure by the personal costs, external supplies and services and other operational costs. It had a clear decreasing tendency due to the process of optimization OPEX efficiency by REN. This optimization affects the revenues of OPEX because it is correlated to the OPEX, decreasing it from 2012 to 2015.
Construction Costs and Construction Revenues
The construction costs had a tendency to decrease from 2012 to 2014, with a value of
€173 Millionin 2012 to €143 Million in 2014. In 2015 the contrary occur, with a cost of
€223 Million (+€80 Million) in 2015. The construction costs and construction revenues are correlated to the CAPEX, as it is showed in Figure 21. In terms of the construction costs, the growth in 2015 had a bigger impact in the Gas activity, with a
value of €89 Million in 2015 (2014 was €22 Million) and the Electricity activity with a
value of €133 Million in 2015 (in 2014 was €121 Million).
Being that the construction revenues are also correlated to the CAPEX explains the exponential growth from 2014 (€163 Million) to 2015 (€240 Million).
Profit and Loss (P&L)
Overall, from 2012 to 2015, the Earnings Before Interest, Taxes, Depreciation and Amortization (EBITDA) and Net Profit showed a decreasing trend (Figure 22), primarily due to (1) the changes in the regulatory environment by ERSE, which affects the company revenues (allowed revenues); (2) by the decreasing cost of debt in Portugal (10-year bond yields), which affected the ROR used for the return on RAB, and (3) the changes in CAPEX for each year.
The fact that, since 2014, REN is obligated to pay an Extraordinary Contribution of the Energy Sector (about €25 Million) decreased the net profit even more. From 2014 to 2015 this was not noted because of the capital gain from the sale of REN´s Enagás
stake (+€20.1 Million).
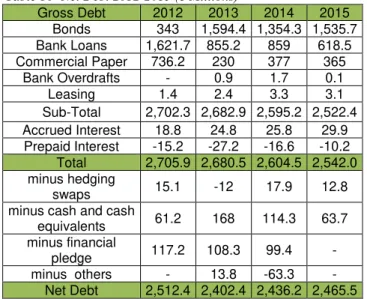
Net Debt
The debt structure and financing sources have already been analyzed from 2014 to 2015, please refer to the Industry Overview section. But from 2012 and 2015, the Table
16shows, in more detail the gross to net debt and the respective financing sources of REN.
REN´s main financing sources thought 2012 to 2015 were bank borrowings and the issuance of bonds, representing 84.74% of the total gross debt in 2015 (60.41% bonds and 24.33% bank borrowings).
Relatively to the net debt, it is reached by taking out, primarily, the cash and cash equivalents and the hedging swaps.
75 100 125 150 175 200 20 12 20 13 20 14 20 15 Electricity Gas Figure 20- Return on RAB by Area (€Millions)
Source: Company Data and HA Analysis
125 150 175 200 225 250 20 12 20 13 20 14 20 15 Capex Constructions Costs Constructions Revenues Figure 21- Construction Costs, Revenues and CAPEX (€Millions)
Source: Company Data and HA Analysis
100 170 240 310 380 450 520
2012 2013 2014 2015
EBITDA EBIT Net Profit
Figure 22- Earnings per Year (€Millions)
640 660 680 700 720 740 20 16F 20 17F 20 18F 20 19 F 20 20F 20 21F Total Revenues Figure 23- Total Revenues Forecast (€Millions)
Table 16- Net Debt 2012-2015 (€ Millions)
Forecast Analyses
For the forecast analyses, the historical performance data from 2012 to 2015 and the regulatory parameters were used to reach the forecast from 2016 to 2021. Since REN seems to follow a trend in specific parameters in the revenues, costs, assets, liabilities, equity and others, the analyses of the historical data seems appropriate to understand and to reach REN´s forecast values and, of course, the usage of the regulatory parameters are imperial as well, being the most important driver of the company, especially in the P&L (revenues and costs).
The assumptions for the Balance Sheet and P&L are in Appendix 5 and Appendix 6, respectively.
Total Revenues
The total revenues (Figure 23), were achieved by doing the sum of the electricity, gas and others.
Electricity Revenues
The electricity revenues were obtain by doing the sum of the revenues sources: the
revenues from assets, OPEX revenues, constructions revenues and other revenues (Table 17).
Table 17- Electricity Revenues Sources (€Millions)
The revenues from assets are compose from the sum of return on RAB, hydro land remuneration, lease revenues from hydro protection zone,remuneration of fully depreciated assets,recovery of depreciation (net from subsidies) and subsidies amortization.
The return on RAB is one of the most significant sources of revenue in the company. As explained before, its value depends on the RAB, Table 18 (composed with electricity, gas and land RAB) and by the ROR (with different base rates, establish by
Gross Debt 2012 2013 2014 2015
Bonds 343 1,594.4 1,354.3 1,535.7 Bank Loans 1,621.7 855.2 859 618.5 Commercial Paper 736.2 230 377 365
Bank Overdrafts - 0.9 1.7 0.1
Leasing 1.4 2.4 3.3 3.1
Sub-Total 2,702.3 2,682.9 2,595.2 2,522.4 Accrued Interest 18.8 24.8 25.8 29.9 Prepaid Interest -15.2 -27.2 -16.6 -10.2
Total 2,705.9 2,680.5 2,604.5 2,542.0 minus hedging
swaps 15.1 -12 17.9 12.8
minus cash and cash
equivalents 61.2 168 114.3 63.7
minus financial
pledge 117.2 108.3 99.4 -
minus others - 13.8 -63.3 -
Net Debt 2,512.4 2,402.4 2,436.2 2,465.5
2016F 2017F 2018F 2019F 2020F 2021F Revenues
from Assets 290 297.7 305.7 305.5 313.7 322.1 Revenues of
OPEX 55 51.4 48 44.9 42 39.2
Construction
Revenues 124.7 124.7 124.7 76.3 76.3 76.3 Other
Revenues 3.3 4.5 3 4.1 3.2 4.3
Source: Company Data and HA Analysis
Source: HA Analysis
25% 30% 35% 120 130 140 150 20 16F 20 17F 20 18F 20 19F 20 20F 20 21F
Return on RAB (Electricity)
% of Revenue
Figure 24- Electricity Return on RAB (€Millions) 36% 37% 38% 39% 40% 80 85 90 95 100 20 16F 20 17F 20 18 F 20 19F 20 20F 20 21F
Return on RAB (Gas)
% of Revenue Figure 26- Gas Return on RAB (€Millions)
sovereign 10-year bond yields. By doing the multiplication of these two parameters, it gives us the value of the return on RAB (Figure 24). The assumptions for the values of the RAB were based in a Compound Annual Growth Rate (CAGR) using the historical values from 2012 to 2015, in the case of electricity 2.89% and for the ROR it was assumed that the value is going to reach the minimal percentage base (establish by ERSE in 2015), decreasing for both the electricity and gas (Figure 25). This assumption is supported by the fact that we assumed that the cost of debt in Portugal will decrease in the forecast period (due to the improvement of the country economic environment), diminishing the average 10-year bond yields and forcing the ROR to achieved the floor base value, which we assumed that is going to maintain equal to the 2015 percentage value (6%) until 2018F and in 2019F will decrease to minimum value (5.65%).
The hydro land remuneration has a similar mechanism to the Return on RAB, were the value of the land RAB is multiplied by a percentage value (0.1%), establish by ERSE.
Table 18- Forecast RAB (€Millions)
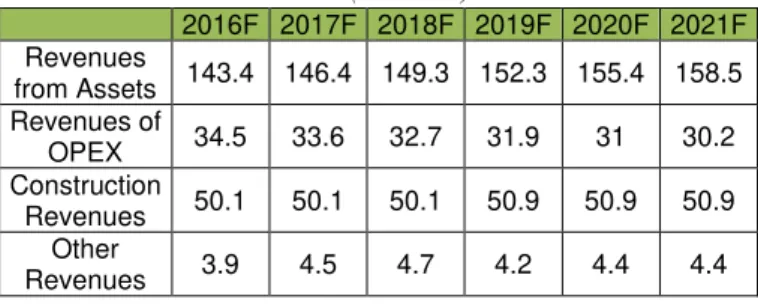
Gas Revenues
The gas revenues are composed by the sum of revenues from assets, revenues of OPEX, construction revenues and other revenues (Table 19).
Table 19- Gas Revenue Sources (€Millions)
The revenues from assets are compose from the sum of the return on RAB, tariff smoothing effect (natural gas), recovery of depreciation (net from subsidies) and
subsidies amortization.
The return on RAB (Figure 26) on gas has the same mechanism of the electricity, where the difference comes from the values of RAB (with a CAGR of 2.05% from historical data analysis) and ROR (7.33%, assumption based on the minimal rate for the ROR, Figure 25).
Revenues of OPEX & Construction Revenues
For the revenues of OPEX we assumed the same mechanism for both electricity and gas, using a CAGR from a historical analysis (-6.53% for electricity and -2.59% for gas), being that the Revenues of OPEX follows the trend respecting the OPEX costs (Figure 27).
Relatively to the construction revenues the mechanism for the forecast is also the same for the electricity and gas, but since the construction revenues and costs are correlated to the amount of CAPEX, it was assumed that for the forecast period the construction revenues would change by the same percentage value of the CAPEX in a given year (Figure 28).
2016F 2017F 2018F 2019F 2020F 2021F
Eletricity 2,211.4 2,275.3 2,341.1 2,408.7 2,478.3 2,550 Gas 1,178.9 1,203.1 1,227.8 1,253 1,278.7 1,304.9
Land 269 257.3 246.2 235.5 225.3 215.5
Total 3,659.3 3,735.8 3,815.1 3,897.2 3,982.3 4,070.4
2016F 2017F 2018F 2019F 2020F 2021F Revenues
from Assets 143.4 146.4 149.3 152.3 155.4 158.5 Revenues of
OPEX 34.5 33.6 32.7 31.9 31 30.2
Construction
Revenues 50.1 50.1 50.1 50.9 50.9 50.9 Other
Revenues 3.9 4.5 4.7 4.2 4.4 4.4
Source: HA Analysis
Source: HA Analysis
6,00% 5,65% 7,33% 5,00% 5,50% 6,00% 6,50% 7,00% 7,50% 20 16F 20 17F 20 18F 20 19F 20 20F 20 21F
Electricity ROR Gas ROR Figure 25- Forecast ROR
Source: Company Data and HA Analysis
Source: HA Analysis
60 70 80 90 100 110 20 16F 20 17F 20 18F 20 19F 20 20F 20 21F Total OPEX
Total Revenues of OPEX Figure 27- Forecast of OPEX and OPEX Revenues (€Millions)
100 120 140 160 180 20 16F 20 17F 20 18F 20 19F 20 20F 20 21F CAPEX Constructions Costs Construction Revenues Figure 28- Forecast CAPEX, Construction Costs and Revenues (€Millions) 1900 2000 2100 2200 2300 2400 2500 2600 20 16F 20 17F 20 18F 20 19F 20 20F 20 21F Gross Debt Net Debt Figure 29- Forecast Debt (€Millions)
OPEX & Construction Costs
For the OPEX we assumed the same mechanism for the electricity, gas and for the other companies. Having in consideration the focus of REN´s plan in the efficiency and optimization of OPEX, which had already been started to be implemented in the company, we assumed, for the forecast period, a CAGR of 4.05% for electricity, -3.36% for gas and -7.58% for the other companies.
For the construction costs, as for the construction revenues (as explained before) it was assumed that it would change by the same percentage value of the CAPEX, since they are correlated.
CAPEX
REN´s CAPEX plan takes into account the company´s financial sustainability and tries to maximize its optimization by investing in the improvement of their infrastructures. The CAPEX is allocated to the fixed assets of the company (the intangible assets
and the property, plant and equipment), being divided in the areas of electricity, gas and others. For the forecast period we assumed that the CAPEX would decrease by
the amount expected by REN strategy (€175 Million from 2016F to 2018F) and assuming that from 2019F to 2021F would be €127.4 Million (same percentage
amount, -27.20%, from 2015 to 2016F), Table 20. Table 20- CAPEX (€Millions)
Debt
The main objective, according to REN, since its credit rating changed in 2015 to an
investment grade, is to reduce its debt. This reduction depends on the availability of REN to do so. With this in mind, by organizing the forecast of the cash flow statement
(Appendix 4) by operating activities (EBIT, D&A, income tax, changes in NWC),
investing activities (CAPEX and other investments), financing activities (only considering the interest paid and dividends paid) and considering the forecast value (beginning and ending balance) for the cash and cash equivalents for each year, that we calculated using the assumption define for it (Appendix 5),we were able to define the amount that REN would issue or retire in terms of debt. After the calculations it was assumed that the company would have the capability to reduce its debt, Figure 29 and Table 21.
This reduction of REN´s debt alters the capital structure of the company, reducing the
weight of debt(Wd) from 71% in 2012, 68% in 2016F and 63% in 2021F (Figure 30). The debt reduction will, consequently, also decrease the interest that REN pays over its debt, please refer to Figure 36 in the Investment Risks section.
Table 21- Gross to Net Debt (€Millions)
CAPEX
(€Millions) 2012 2013 2014 2015 2016F 2017F 2018F 2019F 2020F 2021F Electricity 155.5 157.6 137.4 148.2 124.6 124.6 124.6 76.2 76.2 76.2
Gas 45.0 29.9 25.8 91.8 50 50 50 50.8 50.8 50.8
Other 0.5 0.4 0.1 0.4 0.4 0,.4 0.4 0.4 0.4 0.4
Total 201.1 187.8 163.3 240.4 175 175 175 127.4 127.4 127.4
2016F 2017F 2018F 2019F 2020F 2021F Gross Debt 2,535.1 2,512.6 2,481.8 2,401.8 2,313.1 2,211.7
minus hedging
swaps 12.8 12.8 12.8 12.8 12.8 12.8
minus cash and cash
equivalents 92.7 93.7 94.4 88.1 88.9 90.1 Net Debt 2,429.6 2,406.1 2,374.6 2,300.9 2,211.3 2,108.8
Source: HA Analysis
Source: Company Data and HA Analysis Source: Company Data and HA Analysis