Instituto Superior de Ciências do Trabalho e da Empresa
PROPOSING A MODEL FOR FOREIGN MARKET
SELECTION IN THE
GROUND ENGINEERING SLURRIES INDUSTRY:
THE SPECIAL CASE OF GROUND TECH
Jorge Filipe de Jesus Sousa Correia
Thesis submitted as partial requirement for the conferral of
Master in International Management
Supervisor:
Prof. Luís Bernardino, Prof. Auxiliar, ISCTE Business School, Departamento de Gestão
PROPOSIN G A MODEL F O R FOREI G N MARKET SELECTI ON IN TH E GROU ND EN GI NEER IN G S L URR IES INDUSTR Y : THE SPEC IA L CASE OF GROUND T E CH
J o rge Fi lipe de Jes u s Sous a C o rre ia
English abstract
SMEs that develop their business in niche markets need to look to opportunities in other markets (foreign countries) in order to be able to sustain overtime the business growth. This work proposes a model for foreign market selection in the industry of Ground Engineering soil stabilisation slurries. This study based on the Hollensen’s international market selection model, the author proposes an adapted and expanded model for foreign market selection. Above all, the aim of this work is to propose a practical implementation of the model in order to support decision making for foreign market selection.
Keywords: International Business, International Management, International Marketing, Foreign Market selection,
JEL Classification : M10 - Business Administration, General; M16 – Business Administration, International Business Administration
Portuguese abstract
As PME’s que desenvolvem o seu negócio num nicho de Mercado, precisam de procurar oportunidades em outros mercados (países estrangeiros) no sentido de garantir um crescimento sustentado do negócio ao longo do tempo. Este trabalho, propõe um modelo para selecção de mercados internacionais, na indústria dos fluidos de estabilização de solo para uso em Geotecnia. Com base no modelo de selecção de mercados internacionais de Hollensen, o autor propõe um modelo adaptado e expandido para selecção de mercados internacionais. Acima de tudo, o objectivo deste trabalho é propor uma implementação prática do modelo no sentido de suportar a decisão de selecção de mercados internacionais
Keywords: International Business, International Management, International Marketing, Foreign Market selection,
JEL Classification : M10 - Business Administration, General; M16 – Business Administration, International Business Administration
Content index
1. Project scope and framework ... 6
2. GROUND TECH’s background, facts and strategy ... 8
2.1. Vision, Mission, and Goals ... 8
2.2. The business opportunity ... 9
2.3. GROUND TECH’s strategy competitive advantage and scope ... 10
2.4. GROUND TECH’s internationalization process model, a born global company ... 11
3. Methodology ... 12
3.1. The case study theory context ... 12
3.2. Hollensen’s methodology ... 13
3.2.1. Preliminary screening ... 13
3.2.2. Fine-grained screening ... 16
3.3. Data ... 17
3.3.1. The use of secondary data ... 17
3.3.2. Secondary data sources ... 20
4. Preliminary screening ... 21
4.1. Political and economic environment ... 21
4.1.1. Country rating (political and economical risk) ... 22
4.1.2. Business climate (Business risk) ... 23
4.2. Population ... 25
4.3. Country surface (km2) ... 27
4.4. GDP ... 28
4.5. GDP (Growth percentage of) based on PPP, per capita ... 30
4.6. Currency stability/foreign exchange exposure ... 32
4.7. Sociocultural environment ... 34
4.7.1. Individualism cultural dimension ... 34
4.7.2. Uncertainty avoidance cultural dimension ... 36
4.8. Preliminary screening ranking results ... 38
5. Fine-grained screening ... 39
5.1. Country attractiveness ... 40
5.1.1. Number of potential customers ... 40
5.1.2. Tariffs for GROUND TECH’s products ... 41
5.1.3. Corporate taxes ... 42
5.1.4. Forecasted investment in civil engineering infrastructure (motorways, railway, airports and seaports) ... 43
5.1.5. Market size, GROUND TECH 5 years sales forecast (method: by analogy) ... 45
5.2. Competitive strength ... 47
5.2.1. Correlation between Bentonite production and potential infrastructure investment 47 5.2.2. Environmental concern ... 48
5.3. Fine-grained screening results ... 50
6. Conclusions and recommendations ... 55
7. Limitations and suggestions for further studies ... 57
8. Annexes ... 59
8.1. COFACE Country rating methodology ... 59
8.2. 2008 Environmental Performance Index ... 65
Figures index
Figure 1 – Economist and Morgan Stanley infrastructure investment forecast in emerging
markets 2008 . ... 9
Figure 2 – Porter’s generic competitive strategies ... 10
Figure 3 – Preliminary screening variables flow chart ... 15
Figure 4 – Hollensen fine-grained screening model ... 17
Figure 5 – Types of secondary data ... 18
Figure 6 – Hollensen’s country attractiveness/competitive strength matrix ... 53
Figure 7 – COFACE Country rating framework ... 62
Table index
Table 1 – Secondary data sources ... 20
Table 2 - 60 Countries selected based on minimum A4 rating for country risk and business climate. ... 24
Table 3 - Countries with a population bigger than 10,657 million in the year 2009 and a country and business climate rating better than A4 (including). ... 26
Table 4 – Countries with land surface bigger than 100 000 km2 ... 27
Table 5 – GDP forecast for years 2009-2014 annual percentage change, constant prices, for countries selected based on previous indicators. CTGR- Compound Total Growth Rate, CAGR – Compound Annual Growth Rate ... 29
Table 6 – GDP based on PPP, per capita, current US Dollars, forecast for years 2009 - 2014, and annual percentage change for years 2010 - 2014, for countries selected based on previous indicators. CTGR- Compound Total Growth Rate, CAGR – Compound Annual Growth Rate. ... 31
Table 7 - Real appreciation forecast of foreign currency against euro, for 2009 and 2010, year to year. ... 33
Table 8 - Country ranking according to Hofstede individualistic/collectivistic score ... 36
Table 9 – Country ranking according to Hofstede uncertainty avoidance index ... 37
Table 10 – ranking on the countries data, based on 1 to 20 score, according to the values of each of the 5 ranking variables used. ... 38
Table 11 – Number of potential customers per country ... 40
Table 12 – Tariffs for each country and products group, sorted by products group importance. ... 41
Table 13 – Corporate taxes (and surtaxes) for each country ... 42
Table 14 – Countries classification in advanced or emerging economies according to IMF .. 43
Table 15 – Potential infrastructure investment, based on average GDP (constant prices billions USD) percentage investment according to advanced and emerging economies indicator ... 44
Table 16 – Forecast sales factor based on Spanish market sales divided by the potential infrastructure investment in each year ... 45
Table 17 – Five years potential revenue, based on Forecast sales factor and potential infrastructure investment ... 46
Table 18 – Correlation between bentonite production in each country and potential infrastructure investment (2009) in that country per billion USD ... 47
Table 19 – Environmental Performance Index (2008) scores for each country ... 49
Table 20 - Scores result for country attractiveness variable ... 50
Table 21 – Scores result for competitive strength variable ... 51
Table 22 – Scores result for the country attractiveness/competitive strength matrix, from Hollensen ... 52
1. Project scope and framework
The scope of this project is the support decision process of market selection work of GROUND TECH’s internationalization process.
GROUND TECH’s has developed innovative soil stabilization polymer based slurry for the special foundations industry (a sub sector of the construction industry). This novel solution reduces the time and cost of special foundations projects.
The company unique solution is based on patented products (by GROUND TECH) and technical services on site. The combination of unique products and technical services on site gives to GROUND TECH a unique position and advantage worldwide.
GROUND TECH’s business is mainly in the civil engineering infrastructures, i.e. bridges (motorways and railways), seaports and airports.
This project aims to contribute to a market selection decision process based on objective and supported data. In small and medium enterprises (SME) sometimes the decision process is based on decision maker perceptions and emotions. This work aims to reduce the effect of countries perception based on the decision maker experience or perception, and support the decision process with a systematic market selection approach in order to achieve a better international performance for the firm.
SME’s that take a systematic approach to internationalization have better performance than the companies that do an unsystematic approach. Yip and Biscarri (2000) developed a study of 68 recently internationalized U.S. firms that show a correlation between better performance and a highly systematic internationalization process approach.
In SME the resources are scarcer than in a Multinational company, so the market selection decision process should have a systematic approach in order to reduce the failure risk. In this sense, this work will contribute to support GROUND TECH’s management market selection and resources allocation.
Market selection in the context of this work means the selection of a country to develop a sustainable business for 10 to 15 years, with a local team and local facilities. One time basis approach like an important bridge or airport project are interesting for GROUND TECH’s business but are out of scope of this work. This works intends to set the basis for a robust market selection decision making.
The forecasted economic data used in this work is strongly influenced by the world financial and economic crisis. So, all forecasted data, should be analyzed in terms of relative position between countries and not the absolute values. We believe that the absolute values are strongly influenced by the crisis, but the relative positions between countries shouldn’t have many differences even though with the crisis effect.
This work focuses the market selection process for GROUND TECH’s business innovative soil stabilization slurry. Although the entry mode is very important for the business success, it is not in the scope of this work and should be developed in further studies.
2. GROUND TECH’s background, facts and strategy
Due to the confidentiality of the information GROUND TECH is not the real name of the company.
2.1.
Vision, Mission, and Goals
Vision:
To be the leading soil stabilization solution provider in major infrastructure projects worldwide.
Mission:
GROUND TECH is a global company whose mission is to improve the efficiency of the drilling and excavation processes in the foundation industry, through the application of unique products and techniques. Continuously researching to improve our client’s competitive edge, our goal for a sustained development is also, why all of our products are environmentally friendly.
Goals:
To develop a new product and/or soil stabilization technique each year; To start a new market (country) each 2 years;
To do a project in a new country every year.
The company was founded in 2004 and has a capital stock of 270,000 euros. The partners are Belgium, Portuguese and Spanish. The firm has offices in Madrid, Lisbon and London and projects in several countries.
The consolidated revenue in 2008 was 2,5 million euros and the firm has doubled revenue each year since foundation.
2.2.
The business opportunity
GROUND TECH has developed an innovative soil stabilization solution, based on unique products and techniques, which reduce time and cost of special foundations projects.
GROUND TECH’s business opportunity is mainly in infrastructure project, where special foundations have an important role. In these projects, GROUND TECH’s helps special foundation contractor reducing projects time and cost.
According to the Economist the biggest infrastructure investment is underway in the following 10 years (Economist 2008). Over half of the world's infrastructure investment is now taking place in emerging economies, where sales of excavators have risen more than fivefold since 2000. In total, emerging economies are likely to spend in 2008 an estimated $1.2 trillion on roads, railways, electricity, telecommunications and other projects this year, equivalent to 6% of their combined GDPs—twice the average infrastructure-investment ratio in developed economies. Compounding 2008 figures, Morgan Stanley predicts that emerging economies will spend $22 trillion (in today's prices) on infrastructure over the next ten years.
Figure 1 – Economist and Morgan Stanley infrastructure investment forecast in emerging markets 2008 -17.
2.3.
GROUND TECH’s strategy competitive advantage and
scope
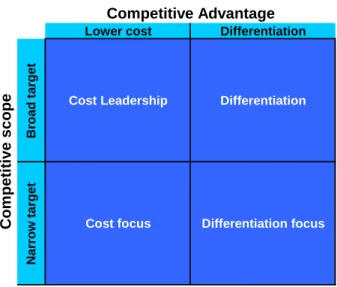
According to Porter, M. (Porter 1990), there are 4 main competitive strategies: - Cost leadership;
- Cost focus - Differentiation - Differentiation focus
Figure 2 – Porter’s generic competitive strategies
Lower cost Differentiation
Br
oad t
a
rget
Cost Leadership Differentiation
Narro w t a rg et
Cost focus Differentiation focus
Competitive Advantage C o mp et it iv e sco p e Source: Porter (1990)
GROUND TECH has an important differentiation in a targeted market segment, soil stabilization in the special foundations market. The company serves better than competitors the special need of a narrow strategic market.
GROUND TECH in the Porter competitive strategy model is clearly a company with a differentiation focus strategy.
The competitive advantage of the company is based on unique products and know-how that increases customer production. Using GROUND TECH’s solution customers are able to finish works before the planned schedule. There are several examples of sites with an important delay, which recovered lost time and were on track again using GROUND TECH’s solutions.
2.4.
GROUND TECH’s internationalization process model,
a born global company
GROUND TECH is a born global company, according to Knight (1997) who defines a born global company as a “company which, from or near its foundation, seeks to derive a substantial proportion of its revenue from the sale of its products in international markets”. Born global companies (Moen 2002) targets niche markets and industry specific opportunities. These companies generally produce leading-edge technology products for international niche markets such as scientific instruments or machine tools. They compete on quality and value created through innovative technology and product design. The mainstream born global company is close to its customers, flexible and able to adapt its products to the rapidly changing needs and wants of international customers.
On the other hand the Uppsala model describes a gradual development pattern based on lack of knowledge and uncertainty associated with the decision process model that will lead to an internationalization process of gradual steps. This process may be found in the firm’s distribution method and would be evident from an examination of the psychic distance of a firm’s export markets.
Born global companies don’t follow the gradual steps of the Uppsala model. They use from the beginning of the internationalization process several steps at the same time or a combination of these according to markets and customer needs. In this sense GROUND TECH is clearly a born global company. Since the beginning, GROUND TECH addressed foreign markets and allocated resources for the internationalization process (for instance, international registration of trademarks and patents). The firms management is also strongly committed since the beginning with the internationalization process. GROUND TECH has developed at the same time several of the gradual steps that usually are described in the “traditional” internationalization models, for instance foreign direct investment in Spain creating a Spanish company to address customers of this market, export for several countries and the use of local agents in other countries.
3. Methodology
3.1.
The case study theory context
In order to address the objectives of this dissertation that is to propose a model for foreign market selection in the ground engineering slurries industry, the author conducted a review of the relevant literature about the topic followed by a comprehensive in depth analysis of Ground Tech. In this context, a case study and therefore case study research methodology is used where mainly “how” research questions emerge once examining contemporary events where the relevant behaviours cannot be manipulated. The case study adds two sources of evidence: direct observation of the events being studied and contacts with the person involved in the events. In addition, Yin (2003) posits that a case study is an empirical enquiry that research a contemporary phenomenon within its real-life context, especially when the boundaries between phenomenon and context are not clearly evident. This is indeed the context of this study.
Overall, this research study is qualitative in its nature, but can also be considered as investigational as it allows creating insight on the subject of a suitable model for foreign market selection in a specific industry, while using qualitative and quantitative data. In fact this study uses quantitative data from reliable and updated sources (see table 1).
On the other hand, regarding the collected qualitative data, qualitative research may not be able to be used to make generalizations (which is often the situation when adopting a case study strategy (Yin, 2003)).
Last but not least, setting out by Ground Tech, as the author tried to emphasize this case study as significant and complete data, displays sufficient evidence composed in an engaging manner, while considering alternative perspectives (Yin, 2003).
3.2.
Hollensen’s methodology
In this study we have used Hollensen’s methodology (Hollensen 2004) for countries/markets selection which is divided in two screenings:
• Preliminary • Fine-grained
3.2.1. Preliminary screening
In the preliminary screening countries are selected primarily according to external screening criteria (the state of the market). There will be a number of countries that can be excluded in advance as potential markets. To accomplish this item in the preliminary screening we have considered eliminatory indicators that will cut off several countries according to criteria established.
In the fine-grained screening countries are analyzed in terms of company competitive strength and country attractiveness.
When we use variables with an eliminatory indicator, there is a cut off value that will eliminate countries that does not comply with the value defined
When we use variables with a ranking indicator, the countries will not be eliminated, but a rank is done. Based on that rank, each country is scored from 1 to 20.
A preliminary screening variables table is used, where each of the 5 variables has the same weight, and the preliminary rank is done based on the total score from 1 to 100 (the sum of the five variables scored from 1 to 20).
The preliminary screening was organized based on two sets of indicators:
Eliminatory indicator – if the country doesn’t comply with the value for that criteria will be eliminated. This means that the indicator is critical for market selection.
Ranking indicator – these criteria doesn’t eliminate, but will suggest a country ranking. This means that the indicator is important to rank, but is not critical to market selection.
Eliminatory indicator, proposed variables:
• Country rating • Business climate • Population • Country surface
Ranking indicator, proposed variables:
• GDP growth forecast, annual percentage change, constant prices • GDP growth based on PPP per capita, current US Dollars • Currency stability,
• Individualism cultural dimension
• Uncertainty avoidance cultural dimension
The use of eliminatory and ranking indicator is not included in Hollensen’s model. These indicators and the variables considered in each indicator are proposed by the author according to his experience. The Hollensen model was adapted and expanded by the author resulting in a different model for foreign market selection.
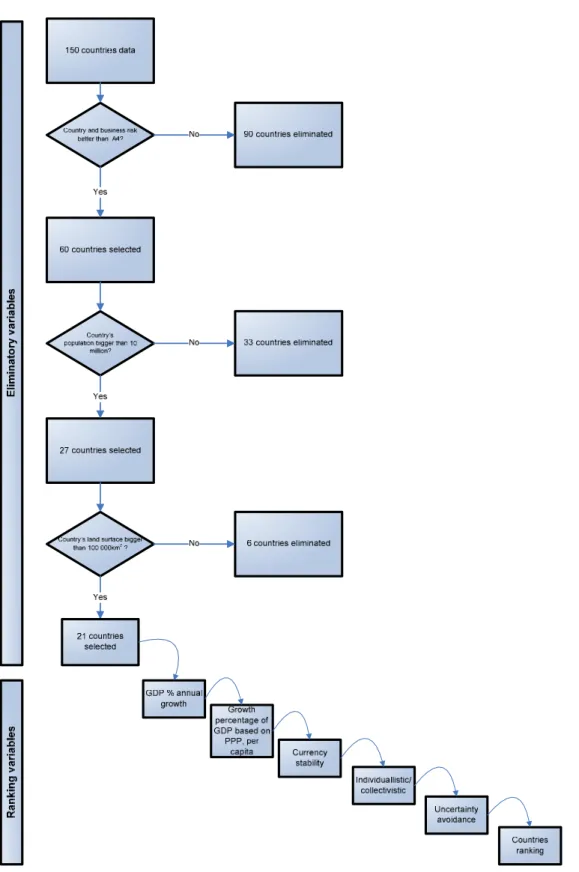
The flow chart below proposes a set of variables to be used on this project, based on the eliminatory or ranking criteria.
Figure 3 – Preliminary screening variables flow chart
3.2.2. Fine-grained screening
We will find two sets of variables in the fine-grained screening, one is the country attractiveness and the other is the competitive strength.
The country attractiveness has 5 variables, where based on countries ranking, each country is scored from 1 to 20. Each of the 5 variables has the same weight and total country attractiveness is scored from 1 to 100.
The competitive strength has only 2 variables that are scored from 1 to 50 (based on country ranking). These 2 variables have the same weight and total competitive strength is scored from 1 to 100 (the sum of the two variables scored from 1 to 50).
Country attractiveness will be evaluated using the following data:
1. Number of potential customers
2. Tariffs for GROUND TECH’s products 3. Corporate taxes
4. Forecasted investment in civil engineering infrastructures 5. Market size, GROUND TECH 5 years forecasted sales
Competitive strength will be evaluated using:
1. Correlation between bentonite production and potential infrastructure investment 2. Environmental concern (environmental performance index)
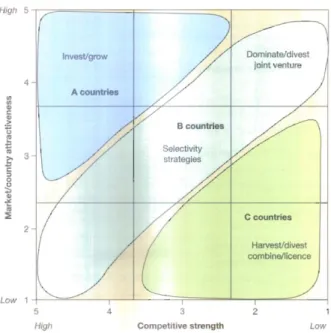
On the next page we may find a chart with the Hollensen model where we have the country attractiveness axe and competitive strength axe.
Figure 4 – Hollensen fine-grained screening model
Source: Hollensen (2004)
According to country attractiveness and competitive strength values countries are positioned in the chart as:
A countries – Invest
B countries – Dominate/divest/ joint venture, selectivity strategy C countries – Divest
3.3.
Data
3.3.1. The use of secondary data
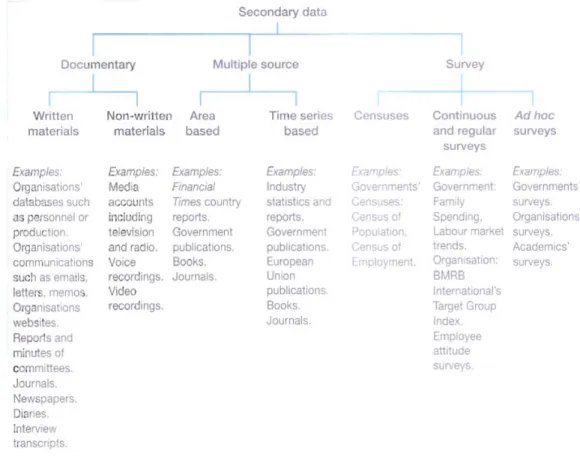
Data used in this work was multiple source secondary data. There are 3 main types of secondary data (Saunders 2007):
• Documentary • Multiple source • Survey
Figure 5 – Types of secondary data
Source: Saunders (2007)
Secondary data may have the following advantages and disadvantages (Saunders 2007):
Advantages of secondary data
May have fewer resource requirements
For many research questions and objectives the main advantage of using secondary data is the enormous saving in resources, in particular time and money. In general it is much less expensive to use secondary data than to collect data itself
Unobtrusive
If data is needed quickly, secondary data may be the only viable alternative. In addition, they are likely to be higher-quality data than could be obtained by collecting directly to the source. Using secondary
data within organizations may also have the advantage that, because they have already been collected, it provides an unobtrusive measure.
Longitudinal studies may be feasible
For many research projects time constraints mean that secondary data provide the only possibility of undertaking longitudinal studies. This is possible either by creating own data or by using an existing multiple source data set (this was the choice used in this work)
Can result in unforeseen discoveries
Reanalyzing secondary data can also lead to unforeseen or unexpected discoveries. Combining data may result in new findings that would not be reached by the analysis of separate data.
Permanence of data
Unlike primary data, secondary data generally provide a source of data that is both permanent and available in a form that may be checked relatively easily by others, resulting in a more open way to public scrutiny.
Disadvantages of secondary data
May be collected for a purpose that does not match the specific project need
Primary data is collected with a specific purpose in mind, secondary may have been collected for a different purpose, and consequently the data may be inappropriate for the specific needs of the project.
Access may be difficult or costly
Where data have been collected for commercial reasons, gaining access may be difficult or costly.
Aggregations and definitions may be unsuitable
The fact that secondary data were collected for a particular purpose may result in other, including ethical problems. As part of the compilation, process data will have been aggregated in some way. This aggregation while meeting the requirements of the original research may not be suitable for other
researches. The definitions of data variables may not be the most appropriate for other research studies.
3.3.2. Secondary data sources
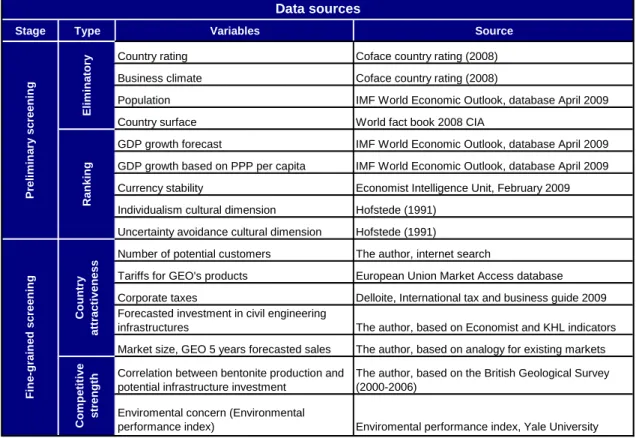
The secondary data sources used in this work are described in table 1.
Table 1 – Secondary data sources
Stage Type Variables Source
Country rating Coface country rating (2008) Business climate Coface country rating (2008)
Population IMF World Economic Outlook, database April 2009 Country surface World fact book 2008 CIA
GDP growth forecast IMF World Economic Outlook, database April 2009 GDP growth based on PPP per capita IMF World Economic Outlook, database April 2009 Currency stability Economist Intelligence Unit, February 2009 Individualism cultural dimension Hofstede (1991)
Uncertainty avoidance cultural dimension Hofstede (1991)
Number of potential customers The author, internet search
Tariffs for GEO's products European Union Market Access database Corporate taxes Delloite, International tax and business guide 2009 Forecasted investment in civil engineering
infrastructures The author, based on Economist and KHL indicators Market size, GEO 5 years forecasted sales The author, based on analogy for existing markets Correlation between bentonite production and
potential infrastructure investment
The author, based on the British Geological Survey (2000-2006)
Enviromental concern (Environmental
performance index) Enviromental performance index, Yale University
C ountr y at tr act iv e n e s s C o m p et it ive st re ng th F ine -gr a in e d s c ree ni ng Data sources P rel imi n a ry sc re en ing El im in at or y Ran k in g
4. Preliminary screening
4.1.
Political and economic environment
There is no generally accepted definition of political risk (Agarwal & Feils, 2007) since there is a lack of agreement on its conceptual and operational domain. In formulating the framework of political risk factors several authors emphasize the need to consider not only political but also economic variables (Alon &Martin, 1998; de la Torre & Neckar, 1998; Monti-Belkaoui & Riahi-Belkaoui, 1998; Overholt, 1982; Simon 1984) to search “for what one might call the potential for trouble”. These studies suggest a strong correlation between a country political risk, economic environment and the international entry performance of a firm in that country.
Political and business risk indicators are based on COFACE data. COFACE is one of the leading companies that evaluate country and business risk. COFACE was chosen as a source because it covers 150 countries, has updated and reliable information and it’s free. Other options like Dun&Bradstreet are also good as COFACE, but the information is not available for free.
GROUND TECH is now established in 2 markets (Portugal and Spain). With some many markets available to choose it makes sense to choose a new market with low or mid risk indicators. Due to the large number of available countries to choose, the political and business risk should be used has a criteria to eliminate countries below A4 rating
4.1.1. Country rating (political and economical risk)
Indicator type: eliminatory
This indicator rates the overall risk of the country, taking in consideration the economic, financial and political prospects for that country, the business climate and the overall companies’ payment behaviour in each country. This indicator has 7 levels, A1, A2, A3, A4, B, C, and D, where A1 is the best rate and D is the worse.
For a better understanding, the COFACE definition of A1 and A4 rating can be found below:
A1 rating - The political and economic situation is very good. A quality business environment has a positive influence on corporate payment behaviour. Corporate default probability is very low on average.
A4 rating - A somewhat shaky political and economic outlook and a relatively volatile business environment can affect corporate payment behaviour. Corporate default probability is still acceptable on average.
In annex 10.1, detailed information can be found regarding the methodology and ratings definition.
The company internationalization process is based on incremental steps. Risk must be well managed in terms of resources allocation to the company’s internationalization process. The internationalization process should be focused on the best opportunities; this means that the resources should be allocated to the market with less risk and better chances to deliver a good outcome.
4.1.2. Business climate (Business risk)
Indicator type: eliminatory
The business climate indicator comprises 2 modules:
- The quality of information available on companies and legal protection given to creditors (creditor protection and debt collection efficiency) based on COFACE experience
- The institutional environment, that reflects the quality of the country institutions whose strengths and weaknesses can affect companies
In annex 10.1, detailed information can be found regarding the methodology and ratings definition.
Considering that B country rating classifies countries as:
“Political and economic uncertainties and an occasionally difficult business environment can affect corporate payment behaviour. Corporate default probability is appreciable”;
and B business climate classifies countries as:
“The business environment is mediocre. The availability and the reliability of corporate financial information vary widely. Debt collection can sometimes be difficult. The institutional framework has a few troublesome weaknesses. Intercompany transactions run appreciable risks in the unstable, largely inefficient environments rated B;
It’s proposed in this work to eliminate all countries with a country rating and business climate rating of B or less.
The total COFACE rating sample has 150 countries. We find 60 (40% of the sample) countries that comply to the rule of a COFACE rating better than A4 (including) in country risk and business climate.
So the countries selected at this stage will be:
Table 2 - 60 Countries selected based on minimum A4 rating for country risk and business climate.
BUSINESS Country BUSINESS Country
CLIMATE @rating CLIMATE @rating
Germany A1 A1 Chile A2 A2 Australia A1 A1 Cyprus A2 A2 Austria A1 A1 Czech Republic A2 A2 Belgium A1 A1 Estonia A2 A2 Canada A1 A1 Greece A2 A2
Denmark A1 A1 Hong Kong A2 A1
Finland A1 A1 Hungary A2 A3 France A1 A1 Israel A2 A4 Ireland A1 A1 Italy A2 A2 Japan A1 A1 Luxembourg A2 A1 Netherlands A1 A1 Malta A2 A2 New Zealand A1 A1 Portugal A2 A2 Norway A1 A1 Slovakia A2 A3 Singapore A1 A1 Slovenia A2 A1
Spain A1 A1 South Korea A2 A2
Sweden A1 A1 Taiwan A2 A1 Switzerland A1 A1 United Kingdom A1 A1 United States A1 A1
BUSINESS Country BUSINESS Country
CLIMATE @rating CLIMATE @rating
South Africa A3 A3 Brazil A4 A4
Bahrain A3 A3 Bulgaria A4 A4
Botswana A3 A2 India A4 A3
Costa Rica A3 A4 Morocco A4 A4
Croatia A3 A4 Mexico A4 A3
Kuwait A3 A2 Namibia A4 A3
Latvia A3 A3 Oman A4 A3
Lithuania A3 A3 Panama A4 A4
Malaysia A3 A2 Romania A4 A4
Mauritius A3 A3 Trinidad and
Tobago A4 A3 Poland A3 A3 Tunisia A4 A4 Qatar A3 A2 Thailand A3 A3 United Arab Emirates A3 A2 A1 A2 A3 A4
Data sources:
Macroeconomic and demographic data was consulted at the IMF (International Monetary Fund) World Economic Outlook database April 2009. Besides IMF, United Nations also have macroeconomic data for all countries. The IMF was chosen as a source because is information is more updated (April 2009) compared with United Nation (2007 or 2006 for some countries).
So, IMF is the more updated source for macroeconomic forecasts covering countries worldwide. Countries land surface data, doesn’t exist in IMF database, we have used the American government agency Central Intelligent Agency (CIA) because is information is accurate, reliable and easily available on the internet.
4.2.
Population
Population plays an important role when selecting new potential markets. For instance the Market Potential Index from Michigan State University uses the population factor as a variable to determine the market size. In the overall market opportunity index (Cavusgil 1997), population is also referred as an important variable to determine the market size and is used as a rough estimation of market potential. Although the entire country may not be targeted by any one company, total population indicates the relative importance of that country’s market.
Population is a very important indicator to select a market. A small population country will not be likely to have a big development for decades in civil engineering and building. Having in mind that a population smaller than Portugal population will be difficult to sustain a company for a long period of time, countries with a population smaller than 10, 657 millions (Portuguese population) should be eliminated.
Table 3 - Countries with a population bigger than 10,657 million in the year 2009 and a country and business climate rating better than A4 (including).
Country Population 2009 (Millions) India 1,207.5 United States 307.4 Brazil 194.4 Japan 127.6 Mexico 107.4 Germany 82.0 Thailand 67.1 France 62.6 United Kingdom 61.2 Italy 59.8 South Africa 49.2 Korea 48.7 Spain 46.2 Poland 38.1 Canada 33.6 Morocco 31.9 Malaysia 27.8 Australia 21.6 Romania 21.4 Chile 17.0 Netherlands 16.8 Greece 11.2 Belgium 10.8 Portugal 10.7
4.3.
Country surface (km2)
Indicator type: eliminatory
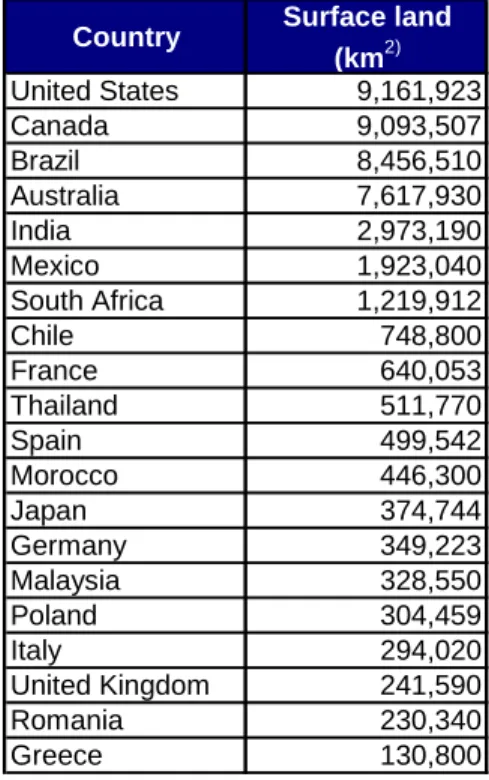
GROUND TECH’s business is mainly civil engineering (motorway or railway bridges, seaports and airports). A country with an area smaller than Portugal will not be likely to have good chances for a sustainable business. According to this indicator the countries previously identified were selected by the criteria of having a land surface bigger than 100 000 km2 (Portugal has 91 951 km2).
Table 4 – Countries with land surface bigger than 100 000 km2
Country Surface land
(km2) United States 9,161,923 Canada 9,093,507 Brazil 8,456,510 Australia 7,617,930 India 2,973,190 Mexico 1,923,040 South Africa 1,219,912 Chile 748,800 France 640,053 Thailand 511,770 Spain 499,542 Morocco 446,300 Japan 374,744 Germany 349,223 Malaysia 328,550 Poland 304,459 Italy 294,020 United Kingdom 241,590 Romania 230,340 Greece 130,800
4.4.
GDP
It is widely accepted that GDP growth is an important variable to assess the economic growth of a country.
The Market Potential Index from Michigan State University, uses the real GDP growth rate as a variable to determine the market growth rate.
GDP is the sum of all final goods and services produced for the market in a given time period, with each good or service valued at its market price (Schiller 1997), in this study we compare the GDP growth rate (constant prices) between countries. It is more likely that a country with a bigger GDP growth rate will have more resources to invest in infrastructure. Later we will analyze not only the growth rate but the relation between infrastructure investment and GDP absolute value per country. Of course we should not consider only this variable, because the resources available for infrastructure investment will depend on several other variables. So the GDP growth, like any other variable, should not be analyzed alone, but together with other variables, according to the methodology proposed in this study.
Indicator type: ranking
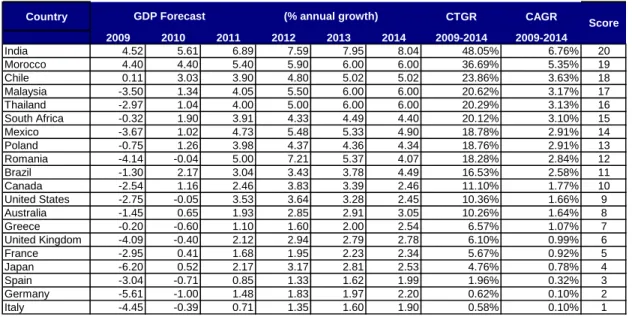
The growth of Gross Domestic Product (GDP) for the following years, will determine the ability of governments to invest in the countries infrastructures in a sustainable way. GROUND TECH’s business strongly depend on infrastructures investment, with a focus on civil engineering projects, so it will be more likely to have a sustainable business in a market with a good GDP growth forecast. All forecasted data is strongly affected by the financial and economic crisis that the world is facing. The International Monetary Fund, World Economic Outlook (2009, April data) should be viewed as a tool to help the market selection. The forecast data is used to help the decision making based on the relative comparison of data, and not the absolute figure of each indicator. The absolute figures of each indicator are strongly affected by the crisis, but the relative analysis can be done and should give relevant data for market selection. Countries are scored according to Compound Total Growth Rate (CTGR) that was calculated based on GDP forecast, percentage annual growth (constant prices) between 2009 and 2014, for annual information purposes the Compound Annual Growth Rate
The table below shows GDP forecast for years 2009 - 2014, annual percentage change, constant prices.
Table 5 – GDP forecast for years 2009-2014 annual percentage change, constant prices, for countries selected based on previous indicators. CTGR- Compound Total Growth Rate, CAGR – Compound Annual Growth Rate
Country CTGR CAGR 2009 2010 2011 2012 2013 2014 2009-2014 2009-2014 India 4.52 5.61 6.89 7.59 7.95 8.04 48.05% 6.76% 20 Morocco 4.40 4.40 5.40 5.90 6.00 6.00 36.69% 5.35% 19 Chile 0.11 3.03 3.90 4.80 5.02 5.02 23.86% 3.63% 18 Malaysia -3.50 1.34 4.05 5.50 6.00 6.00 20.62% 3.17% 17 Thailand -2.97 1.04 4.00 5.00 6.00 6.00 20.29% 3.13% 16 South Africa -0.32 1.90 3.91 4.33 4.49 4.40 20.12% 3.10% 15 Mexico -3.67 1.02 4.73 5.48 5.33 4.90 18.78% 2.91% 14 Poland -0.75 1.26 3.98 4.37 4.36 4.34 18.76% 2.91% 13 Romania -4.14 -0.04 5.00 7.21 5.37 4.07 18.28% 2.84% 12 Brazil -1.30 2.17 3.04 3.43 3.78 4.49 16.53% 2.58% 11 Canada -2.54 1.16 2.46 3.83 3.39 2.46 11.10% 1.77% 10 United States -2.75 -0.05 3.53 3.64 3.28 2.45 10.36% 1.66% 9 Australia -1.45 0.65 1.93 2.85 2.91 3.05 10.26% 1.64% 8 Greece -0.20 -0.60 1.10 1.60 2.00 2.54 6.57% 1.07% 7 United Kingdom -4.09 -0.40 2.12 2.94 2.79 2.78 6.10% 0.99% 6 France -2.95 0.41 1.68 1.95 2.23 2.34 5.67% 0.92% 5 Japan -6.20 0.52 2.17 3.17 2.81 2.53 4.76% 0.78% 4 Spain -3.04 -0.71 0.85 1.33 1.62 1.99 1.96% 0.32% 3 Germany -5.61 -1.00 1.48 1.83 1.97 2.20 0.62% 0.10% 2 Italy -4.45 -0.39 0.71 1.35 1.60 1.90 0.58% 0.10% 1 Score GDP Forecast (% annual growth)
4.5.
GDP (Growth percentage of) based on PPP, per capita
Statistics on GDP per capita are a fundamental measure of a country’s economic development (Schiller 1997). In this study we have not used just the GDP per capita, to measure the country’s economic development, but the growth percentage based on PPP. This way we believe that we may forecast the goods and services that the population will buy in the future, which will lead to an inevitable infrastructure investment to support demand and economic growth.
Indicator type: ranking
GDP based on Purchasing Power Parity (PPP), per capita, gives us information on the purchasing power of the population of each country. We may compare data between countries because the indicator already reflects the PPP of the population of that country. Countries with a higher growth forecast for this indicator are more likely to have a population that will have more purchasing power to buy cars (which leads to motorway investment), buy imported goods (new motorways, railways and seaports investments will be needed) and travel (which creates the need to invest in airports, seaports, railways and motorways).
Table 6 – GDP based on PPP, per capita, current US Dollars, forecast for years 2009 - 2014, and annual percentage change for years 2010 - 2014, for countries selected based on previous indicators. CTGR- Compound Total Growth Rate, CAGR – Compound Annual Growth Rate.
Country 2009 2010 2011 2012 2013 2014 2010 2011 2012 2013 2014 CTGR CAGR India 2,873 3,005 3,187 3,433 3,730 4,056 4.60% 6.06% 7.73% 8.62% 8.76% 41.18% 7.14% 20 Romania 12,214 12,299 13,036 14,231 15,341 16,337 0.70% 5.99% 9.17% 7.79% 6.49% 33.75% 5.99% 19 Morocco 4,519 4,673 4,885 5,176 5,516 5,881 3.40% 4.54% 5.96% 6.57% 6.60% 30.12% 5.41% 18 Poland 17,524 17,825 18,654 19,766 21,039 22,398 1.72% 4.65% 5.96% 6.44% 6.46% 27.82% 5.03% 17 Thailand 7,975 8,013 8,299 8,754 9,366 10,025 0.48% 3.56% 5.49% 7.00% 7.03% 25.71% 4.68% 16 Mexico 14,018 14,075 14,682 15,559 16,542 17,519 0.41% 4.31% 5.98% 6.32% 5.91% 24.98% 4.56% 15 Chile 14,461 14,778 15,261 16,035 16,960 18,000 2.19% 3.26% 5.07% 5.77% 6.13% 24.47% 4.48% 14 Malaysia 13,477 13,487 13,878 14,608 15,523 16,500 0.08% 2.90% 5.26% 6.26% 6.30% 22.44% 4.13% 13 South Africa 10,070 10,195 10,538 11,034 11,627 12,245 1.23% 3.37% 4.71% 5.37% 5.31% 21.59% 3.99% 12 Japan 32,298 32,638 33,581 35,211 36,975 38,748 1.05% 2.89% 4.85% 5.01% 4.79% 19.97% 3.71% 11 Brazil 10,154 10,289 10,533 10,924 11,423 12,029 1.33% 2.38% 3.71% 4.56% 5.31% 18.46% 3.45% 10 Canada 38,154 38,478 39,363 41,175 43,097 44,724 0.85% 2.30% 4.60% 4.67% 3.78% 17.22% 3.23% 9 United States 45,550 45,254 46,663 48,591 50,652 52,393 -0.65% 3.11% 4.13% 4.24% 3.44% 15.02% 2.84% 8 Germany 33,804 33,638 34,383 35,580 37,030 38,641 -0.49% 2.22% 3.48% 4.08% 4.35% 14.31% 2.71% 7 France 33,334 33,445 34,046 35,060 36,372 37,788 0.33% 1.80% 2.98% 3.74% 3.89% 13.36% 2.54% 6 Greece 30,689 30,570 31,057 31,990 33,237 34,727 -0.39% 1.60% 3.00% 3.90% 4.49% 13.16% 2.50% 5 Australia 36,642 36,583 37,040 38,176 39,559 41,060 -0.16% 1.25% 3.07% 3.62% 3.79% 12.06% 2.30% 4 United Kingdom 35,286 34,881 35,402 36,541 37,838 38,808 -1.15% 1.49% 3.22% 3.55% 2.56% 9.98% 1.92% 3 Spain 29,596 29,305 29,545 30,199 31,108 32,183 -0.98% 0.82% 2.21% 3.01% 3.46% 8.74% 1.69% 2 Italy 29,274 29,080 29,255 29,889 30,767 31,785 -0.66% 0.60% 2.17% 2.94% 3.31% 8.58% 1.66% 1 Score GDP based on PPP, Per capita Forecast (US
Dollars)
GDP based on PPP, Per capita Forecast (annual % change)
4.6.
Currency stability/foreign exchange exposure
The foreign exchange exposure is a measure of the potential that a firm’s profitability, cash flow and market value will change because of a change in exchange rates (Moffet 2004). There are 4 types of foreign exchange exposure:
• Transaction; • Operating; • Accounting; • Tax.
Tax exposure will be analyzed later in this study (item 5.1.3).
Transaction exposure, measures changes in the value of outstanding financial obligations incurred prior to a change in exchange rates. Typical exposures are accounts receivable and payable, as well as backlog and quotation exposures.
Operating exposure, measures the change in present value of a firm resulting from a change in its future operating cash flows due to an unexpected change in exchange rates.
Accounting exposure is the potential for accounting derived changes in owners’ equity and consolidated income that occur because of the need to translate foreign currency denominated financial statements of foreign subsidiaries into a single currency to prepare worldwide consolidated financial statements.
The 3 foreign exchange exposures above depends on the exchange rate changes. The level of company exposure will depend on the entry mode, but for this study we should focus on the variable that affects all types of exposures cited, the exchange rate change.
To analyze the impact of exchange rates in market selection we may have several different approaches (ie, past volatility, analysis of the macro-economics factors that lead to exchange rates changes, analysis of several models to forecast exchange rates). We have chosen in this study a simple, comparable and reliable method, the Economist Intelligence Unit, February
ware, that this method has a lot of limitations, but for a SME market selection, it seems to be the most updated and reliable variable to have in account. Every investor recognizes the importance of exchange rate changes, but no one can fully assure a good model to predict future variations.
Indicator type: ranking
Table 7 - Real appreciation forecast of foreign currency against euro, for 2009 and 2010, year to year. Country 2009 2010 Canada -1.60% 4.20% 20 Poland -13.60% 4.00% 19 India 5.30% 2.70% 18 United Kingdom -11.30% 2.50% 17 Romania -7.70% 0.90% 16 France -0.10% 0.10% 15 Greece 1.20% -0.40% 14 Spain 0.70% -0.60% 13 Italy 1.10% -0.80% 12 Malaysia -0.10% -0.80% 11 Morocco 1.40% -1.00% 10 Germany 0.30% -1.10% 9 Brazil -14.00% -2.10% 8 Thailand -1.30% -3.40% 7 Australia -16.80% -3.50% 6 United States 9.00% -3.60% 5 Japan 23.60% -4.90% 4 South Africa 1.00% -5.50% 3 Chile -6.00% -7.60% 2 Mexico -13.10% -8.50% 1
Real appreciation of foreign currency against euro % year
on year forecast Score
Source: Economist Intelligence Unit, February 2009
Year 2009 data presented above is just for comparison purposes. The score was obtained based on 2010 data. It’s not likely that GROUND TECH will have commercial transactions in year 2009 in the new market, so the investment process for starting in the new market will be in 2010.
4.7.
Sociocultural environment
Hofstede (1980, 2001) conducted perhaps the most comprehensive study of how values in the workplace are influenced by culture. He not only proposes the concepts of power distance, uncertainty avoidance, individualism, masculinity and long term as five dimensions in his national culture paradigm, but also implemented extensive surveys to quantify different countries along these dimensions. All dimensions are scored with a 0 (low) to 100 (high) scale. Replications of Hofstede’s original study found that there are no significant changes in these country scores (Hofstede, 1994).
In this study we have chosen uncertainty avoidance and individualism cultural dimension that according to Yaveroglu (2002) show more evidences to have a big correlation with the introduction of new products and technologies (which is GROUND TECH’s business)
4.7.1. Individualism cultural dimension
This dimension refers to the way people live together. Individualism “pertains to societies in which the ties between individuals are loose: everyone is expected to look after himself or herself and his or her immediate family” and collectivism “pertains to societies in which people from birth onwards are integrated into strong, cohesive in groups, which throughout people’s lifetime continue to protect them in exchange for unquestioning loyalty” (Hofstede,1991 p. 51).
In an individualist society the self-concept, autonomy and personal achievement is important. The individual is emotionally independent from organizations or institutions, and there is belief in individual decisions. In such a society, we would expect people to be more open to try new innovations based on their own individual judgments. They will not depend on others to make decisions. Therefore, we would expect these societies to be higher on innovation. Therefore:
In a collectivist society, there is high interdependence and belief in group decisions. It is important that everybody achieves the same success towards a common goal. Due to this high need for sharing and interdependence, we expect the word of mouth effect to be greater in collectivist societies, leading to a greater coefficient of imitation. Everyone will immediately adapt an idea innovated or adapted by a group of people in collectivist societies. Therefore:
Societies that are low (high) on individualism will be high (low) on imitation. (Yaveroglu, 2002)
Although the Yaveroglu study was done for business to consumer products, we believe that the same conclusion may be applied in the business to business GROUND TECH’s market.
Indicator type: ranking
The consequences of this study for GROUND TECH’s business will be:
In a high score individualistic country, GROUND TECH’s product will be fast adopted, compared with low score countries. Countries with a low score, doesn’t mean that it should be avoided. In these countries the market penetration will take more time, but once inside one or two representative customers, other customers will tend to imitate and adopt GROUND TECH’s technology.
In this study we prevail countries with a culture that will fast adopt new technologies (individualism high score), which means that the time to achieve a sustainable business in that market will be shorter compared with the countries that have a collectivistic society (individualism low score).
Table 8 - Country ranking according to Hofstede individualistic/collectivistic score Country Individualistic/ Collectivistic United States 91 20 Australia 90 19 United Kingdom 89 18 Canada 80 17 Italy 76 16 France 71 15 Germany 67 14 South Africa 65 13 Poland 60 12 Spain 51 11 India 48 10 Morocco 46 9 Japan 46 9 Brazil 38 7 Greece 35 6 Romania 30 5 Mexico 30 5 Malaysia 26 3 Chile 23 2 Thailand 20 1 Score Source: Hofstede (1991)
4.7.2. Uncertainty avoidance cultural dimension
Uncertainty avoidance was defined as “the extent to which the members of a culture feel threatened by uncertain or unknown situations” (Hofstede, 1991, p. 113). Uncertainty avoidance relates to the way in which societies respond to uncertainties embedded in everyday life.
A society low on uncertainty avoidance tends to accept uncertainty without much discomfort, takes risks easily, and shows greater tolerance for opinions and behaviours different from its own.
A society with high on uncertainty avoidance is more rigid. There is a stronger need for predictability, which reflects itself in explicit rules, or structured situations. There is less ambition for advancement and a resistance against change. In countries that are high on uncertainty avoidance people avoid risk, are rigid, and there is resistance to change. Therefore, instead of buying a new product, members of a high uncertainty avoidance culture
may wait for their peers, which in this case may be other societies, and try the product only after it reaches a certain level of penetration. That is, in such a case the effects of external influences, which are captured by the coefficient of innovation p, will be lower. In countries that are low on uncertainty avoidance change is well accepted. Ambition for advancement and risk taking is higher. Therefore, it is expected that these countries will be more receptive of new technologies, and high on innovation. (Yaveroglu, 2002)
Although the Yaveroglu study was done for business to consumer products, we believe that the same conclusion may be applied in the business to business GROUND TECH’s market.
Indicator type: ranking
GROUND TECH has a innovative technology to stabilize soils in the special foundations industry.
This means that countries with a culture more open to “break traditional rules” are likely to be more open to try new technologies. A customer from a country with a low uncertainty avoidance score will be more likely to try GROUND TECH’s technology than a customer from a country with a high score.
Table 9 – Country ranking according to Hofstede uncertainty avoidance index
Country Uncertaninty avoidance United Kingdom 35 20 Malaysia 36 19 India 40 18 United States 46 17 Canada 48 16 South Africa 49 15 Australia 51 14 Thailand 64 13 Germany 65 12 Morocco 68 11 Italy 75 10 Brazil 76 9 Mexico 82 8 Chile 86 7 France 86 7 Spain 86 7 Romania 90 4 Japan 92 3 Poland 93 2 Greece 112 1 Score Source: Hofstede (1991)
4.8.
Preliminary screening ranking results
We have scored each ranking indicator, according to the ranking in each variable (in a scale from 1 to 20).
Below we may find a matrix were we sum each score variable and find a total score (maximum score 100). In this preliminary screening, we may find the countries sorted by total score, and start to figure out which ones may be more interesting in the market selection. But these variable are not enough, to do a proper market selection, more insight should be done (for instance, identification of potential customers, tariffs, corporate taxes, etc). The fine screening, we’ll be done in the next chapter, so we may have a more detailed view of all the factors influencing the market selection process.
Table 10 – ranking on the countries data, based on 1 to 20 score, according to the values of each of the 5 ranking variables used.
Country GDP Forecast (% annual growth) GDP based on PPP, Per capita Forecast
(annual % change) Currency Stability Individualistic/ Collectivistic Uncertaninty avoidance Total
Rank score score score score score score
1 India 20 20 18 10 18 86 2 Canada 8 9 20 17 16 70 3 Morocco 19 18 10 9 11 67 4 United Kingdom 6 3 17 18 20 64 5 Malaysia 17 13 11 3 19 63 5 Poland 13 17 19 12 2 63 7 United States 9 8 5 20 17 59 8 South Africa 15 12 3 13 15 58 9 Romania 12 19 16 5 4 56 10 Thailand 16 16 7 1 13 53 11 Australia 8 4 6 19 14 51 12 France 5 6 15 15 7 48 13 Brazil 11 10 8 7 9 45 14 Germany 2 7 9 14 12 44 15 Chile 18 14 2 2 7 43 15 Mexico 14 15 1 5 8 43 17 Italy 1 1 12 16 10 40 18 Spain 3 2 13 11 7 36 19 Greece 7 5 14 6 1 33 20 Japan 4 11 4 9 3 31
5. Fine-grained screening
After the preliminary screening, it’s important to gather more information in order to do a fine-grained screening. Again all data used in this screening is secondary data.
At this stage we need to go in further detail in each country evaluating the country attractiveness and GROUND TECH’s competitive strength to replace the traditional soil stabilization products
At this stage we have a limitation of using secondary data. More insight should be done in the selected countries, namely competitors’ products prices, customers satisfactions with
5.1.
Country attractiveness
5.1.1. Number of potential customers
The number of potential customers will contribute to the attractiveness of that country for GROUND TECH’s business. A bigger number of potential customers will increase the probability of working with some percentage of them. A small number of customers will increase the risk of customers controlling and in some cases determining provider’s prices.
Table 11 – Number of potential customers per country
Country score United States 36 20 Japan 34 19 Germany 28 18 Brazil 27 17 France 25 16 India 23 15 United Kingdom 21 14 Italy 20 13 Mexico 18 12 Spain 17 11 Canada 15 10 Poland 13 9 Australia 12 8 Thailand 10 7 South Africa 9 6 Malaysia 8 5 Romania 7 4 Greece 6 3 Chile 4 2 Morocco 3 1 Number of potential customers
5.1.2. Tariffs for GROUND TECH’s products
GROUND TECH will export products from Europe, so all the international trade should have in account the tariffs to be paid to import products. GROUND TECH products are divided in 3 main groups (Group 1, 2 and 3) according to the international classification of Harmonized Codes.
The source for tariff data was the European Union, market access database. The Market Access Database is an important operational tool of the European Union's Market Access Strategy, supporting a continuous three-way exchange of information between the EU institutions, Member States and European business. The Market Access Strategy is a key pillar of the EU's Trade Policy which aims to reduce the obstacles faced by European exporters of goods and services.
Countries in the table below were sorted by tariffs and importance of products group (products group 1 is more important than 2, group 2 is more important than 3).
Table 12 – Tariffs for each country and products group, sorted by products group importance.
Country Group 1 Group 2 Group 3
score France 0.00% 0.00% 0.00% 20 United Kingdom 0.00% 0.00% 0.00% 20 Germany 0.00% 0.00% 0.00% 20 Italy 0.00% 0.00% 0.00% 20 Malaysia 0.00% 0.00% 0.00% 20 Spain 0.00% 0.00% 0.00% 20 Poland 0.00% 0.00% 0.00% 20 Greece 0.00% 0.00% 0.00% 20 Mexico 0.00% 0.00% 0.00% 20 Morocco 0.00% 0.00% 0.00% 20 Romania 0.00% 0.00% 0.00% 20 Chile 0.00% 0.00% 0.75% 9 Canada 0.00% 0.00% 6.50% 8 South Africa 0.00% 0.00% 7.60% 7 Japan 3.90% 2.80% 0.00% 6 United States 4.20% 5.30% 4.00% 5 Australia 5.00% 5.00% 5.00% 4 Thailand 5.00% 5.00% 5.00% 3 India 7.50% 7.50% 10.00% 2 Brazil 14.00% 2.00% 14.00% 1
tariffs for each products
5.1.3. Corporate taxes
Corporate taxes have an important role for the investor that is selecting new markets. The higher the tax burden, the higher should be the business and profitability forecast for that country. For the purposes of this study we need to find corporate taxes (and surtaxes), reliable and comparable data for all countries in this study. To achieve this purpose we have used Delloite, International tax and business guides (2009)
Table 13 – Corporate taxes (and surtaxes) for each country
Country Corporate taxes score Romania 16.0% 20 Chile 17.0% 19 Poland 19.0% 18 Canada 19.5% 17 Malaysia 25.0% 16 Spain 25.0% 16 Greece 27.0% 14 United Kingdom 28.0% 13 Mexico 28.0% 13 South Africa 28.0% 13 Australia 30.0% 10 Thailand 30.0% 10 Morocco 30.0% 10 Italy 31.4% 7 Germany 33.0% 6 Brazil 34.0% 5 France 34.4% 4 United States 35.0% 3 India 40.0% 2 Japan 42.0% 1
5.1.4. Forecasted investment in civil engineering infrastructure
(motorways, railway, airports and seaports)
To forecast the civil engineering infrastructure investment we have used to main indicators:
1. In emerging economies, according to the Economist, (Economist 2008) countries invest on average 6% of GDP in civil engineering infrastructures
2. In advanced economies, according to the World Construction Report 2009 (KHL 2009) countries invest on average 3.1% of GDP in civil engineering.
For calculation purposes we have used the IMF forecast, GDP constant prices billions USD.
We have used IMF classification for advanced and emerging economies as follows:
Table 14 – Countries classification in advanced or emerging economies according to IMF Australia Canada France Germany Greece Italy Japan Spain United Kingdom United States Brazil Chile India Malaysia Mexico Morocco Poland Romania South Africa Thailand
Country IMF classification
Advanced economies
Emerging economies
Based on the IMF countries GDP forecast and the average percentage of infrastructure investment on GDP depending on the country classification as an advanced or emerging economy, we have forecasted in the table below the potential infrastructure investment in billions USD for each country.
Table 15 – Potential infrastructure investment, based on average GDP (constant prices billions USD) percentage investment according to advanced and emerging economies indicator Country 2009 2010 2011 2012 2013 2014 Total score United States 434.08 435.94 450.48 468.99 491.82 513.43 2,794.75 20 Japan 154.78 147.28 147.08 151.43 157.34 164.32 922.23 19 Germany 94.87 93.66 94.67 96.67 98.94 101.37 580.18 18 Brazil 76.11 76.00 80.24 84.96 89.85 95.70 502.87 17 France 77.47 77.58 79.86 82.75 86.29 89.87 493.82 16 India 71.14 71.16 76.32 83.11 91.25 100.35 493.34 15 United Kingdom 62.22 62.38 64.89 68.50 72.37 76.36 406.72 14 Italy 61.62 61.22 62.04 63.60 65.54 67.76 381.80 13 Mexico 49.63 50.08 53.24 57.33 61.85 66.35 338.49 12 Spain 43.31 42.74 43.48 44.46 45.74 47.36 267.11 11 Canada 38.11 38.38 39.48 41.41 43.50 45.63 246.50 10 Poland 24.18 24.02 25.06 26.37 27.76 29.22 156.60 9 Australia 23.41 22.78 22.86 23.65 24.41 25.79 142.89 8 Thailand 16.11 16.24 17.47 18.76 20.34 21.96 110.89 7 South Africa 14.60 14.17 14.97 15.93 16.92 17.91 94.50 6 Malaysia 12.75 12.92 13.78 14.90 16.19 17.59 88.12 5 Romania 9.99 9.59 10.70 12.32 14.10 16.05 72.74 4 Greece 10.08 9.97 10.31 10.71 11.20 11.77 64.04 3 Chile 8.15 7.86 8.62 9.86 10.63 11.18 56.29 2 Morocco 5.08 5.29 5.73 6.24 6.80 7.39 36.54 1
Potential infrastructure investment (billions USD)
5.1.5. Market size, GROUND TECH 5 years sales forecast (method: by
analogy)
Based on the sales achieved (3 years achieved sales, plus 2 years forecast) in Spain, we have developed a relation between Spanish market sales and potential infrastructure investment for Spain in each year.
We may find in table 12, the forecast sales factor for the Spanish market.
Table 16 – Forecast sales factor based on Spanish market sales divided by the potential infrastructure investment in each year
Year 1 2 3 4 5
Forecast sales
factor 1.79E-05 3.73E-05 6.15E-05 7.72E-05 9.12E-05
Source: The author
The 5 years sales forecast for each market will be done using an analogy method, based on the Spanish market experience. Of course, this has an important limitation, because sales in other markets may not occur exactly the same way as in Spain, but for a relative comparison purpose we may find this method acceptable (we use the same sales forecast factor for all countries).
Table 17 – Five years potential revenue, based on Forecast sales factor and potential infrastructure investment
Country
Year 1 2 3 4 5 Total Score
United States 5,859 12,622 21,655 28,519 35,186 103,842 20 Japan 1,980 4,121 6,992 9,124 11,261 33,478 19 Germany 1,259 2,653 4,464 5,737 6,947 21,059 18 Brazil 1,022 2,248 3,923 5,210 6,558 18,961 17 France 1,043 2,238 3,821 5,004 6,159 18,264 16 India 956 2,138 3,838 5,291 6,877 19,101 15 United Kingdom 838 1,818 3,163 4,197 5,233 15,249 14 Italy 823 1,738 2,937 3,801 4,644 13,943 13 Mexico 673 1,492 2,647 3,586 4,547 12,946 12 Spain 575 1,218 2,053 2,653 3,246 9,744 11 Canada 516 1,106 1,912 2,522 3,127 9,183 10 Poland 323 702 1,217 1,610 2,003 5,854 9 Australia 306 641 1,092 1,416 1,767 5,222 8 Thailand 218 489 866 1,179 1,505 4,259 7 South Africa 190 420 735 981 1,227 3,554 6 Malaysia 174 386 688 939 1,205 3,392 5 Romania 129 300 569 817 1,100 2,915 4 Greece 134 289 494 650 807 2,373 3 Chile 106 242 455 616 766 2,185 2 Morocco 71 161 288 394 507 1,421 1
Potential Revenue (Thousand EUR)
Source: The author
The table above is presented in EUR, all original data is in USD. To convert USD to EUR we have considered the Exchange rate EUR/USD 1.3315 according to exchange rate changes, all data in EUR should be updated.
5.2.
Competitive strength
5.2.1. Correlation between Bentonite production and potential
infrastructure investment
It will be more likely to have lower bentonite prices in countries with a local production that may supply all the bentonite demand for the ground engineering industry. If the bentonite price in that country is very low, it will be more difficult for GROUND TECH to replace this traditional technology.
Table 18 – Correlation between bentonite production in each country and potential infrastructure investment (2009) in that country per billion USD
Country 2006 (tonnes)
Correlation between bentonite tonnes / billion USD of potential
infrastructure investment 2009 score France 0 0 50.0 United Kingdom 0 0 50.0 Canada 0 0 50.0 Malaysia 0 0 50.0 Thailand 1,200 74 40.0 Chile 632 78 37.5 Romania 20,299 2,032 35.0 South Africa 32,878 2,252 32.5 Japan 450,000 2,907 30.0 Spain 160,000 3,694 27.5 Germany 363,998 3,837 25.0 Poland 93,880 3,883 22.5 Brazil 419,214 5,508 20.0 Italy 341,099 5,535 17.5 Australia 135,000 5,767 15.0 India 590,000 8,293 12.5 Mexico 435,273 8,770 10.0 United States 4,620,000 10,643 7.5 Morocco 71,544 14,087 5.0 Greece 1,100,000 109,117 2.5
Source: Correlation the author; bentonite production: British Geological Survey (2002-2006)
Bentonite production is not the only indicator regarding the final price; local extracting industry conditions may have a strong influence in the price. For instance, United States and China are big bentonite producers, but the product price in each country has a 3 fold
difference (USA is more expensive). The transportation has also a big impact on price; because bentonite is a heavy product and is used in bigger quantities per kg compared to GROUND TECH’s technology (1 ton of Polymud is equivalent to 50 ton of Bentonite).
5.2.2. Environmental concern
To measure the environmental concern of each country it was selected the 2008 Environmental Performance Index from Yale University et al.
The 2008 Environmental Performance Index (EPI) brings a similar datadriven, fact-based empirical approach to environmental protection and global sustainability.
Policymakers in the environmental field have begun to recognize the importance of incorporating analytically rigorous foundations into their decision making. However, while policymakers are calling for increased intellectual rigor in environmental planning, large data gaps and a lack of time-series data still hamper efforts to track many environmental issues, spot emerging problems, assess policy options, and gauge effectiveness. The EPI seeks to fill these gaps and, more broadly, to draw attention to the value of accurate data and sound analysis as the basis for environmental policymaking.
The EPI focuses on two overarching environmental objectives:
• reducing environmental stresses to human health;
• promoting ecosystem vitality and sound natural resource management.
These broad goals also reflect the policy priorities of environmental authorities around the world and the international community’s intent in adopting Goal 7 of the Millennium Development Goals (MDGs), to “ensure environmental sustainability.” The two overarching objectives are gauged using 25 performance indicators tracked in six well-established policy categories, which are then combined to create a final score.
The environmental concern of each country strongly influences GROUND TECH’s business. The main GROUND TECH’s competitor bentonite (traditional soil stabilization slurry) is a contaminant. Betonite is widely used all over the world, but in countries with high environmental concerns, several use restriction applies, for instance the disposal must be done
in appropriate landfills for contaminant products and it’s severe restricted or forbidden in marine works, rivers or environmental classified areas. In these situations, special foundation companies will use casing or GROUND TECH’s solution.
In countries with a higher EPI score it will be more likely to have GROUND TECH’s solutions acquiring a biggest (and faster) market share.
Table 19 – Environmental Performance Index (2008) scores for each country
Country EPI score France 87.8 50.0 Canada 86.6 47.5 United Kingdom 86.3 45.0 Germany 86.3 42.5 Japan 84.5 40.0 Italy 84.2 37.5 Malaysia 84.0 35.0 Chile 83.4 32.5 Spain 83.1 30.0 Brazil 82.7 27.5 United States 81.0 25.0 Poland 80.5 22.5 Greece 80.2 20.0 Mexico 79.8 17.5 Australia 79.8 15.0 Thailand 79.2 12.5 Morocco 72.1 10.0 Romania 71.9 7.5 South Africa 69.0 5.0 India 60.3 2.5