M
ASTER IN
F
INANCE
M
ASTER
´
S
F
INAL
W
ORK
P
ROJECT
E
QUITY
R
ESEARCH
:
S
EMAPA
–
S
OCIEDADE DE
I
NVESTIMENTO E
G
ESTÃO
SGPS,
S.A.
L
AURA
M
ARGARIDA
N
ASCIMENTO
C
ARVALHO
M
ASTER IN
F
INANCE
M
ASTER
´
S
F
INAL
W
ORK
P
ROJECT
E
QUITY
R
ESEARCH
:
S
EMAPA
–
S
OCIEDADE DE
I
NVESTIMENTO E
G
ESTÃO
SGPS,
S.A.
L
AURA
M
ARGARIDA
N
ASCIMENTO
C
ARVALHO
S
UPERVISION
:
P
ROF
.
D
OUTOR
J
OSÉ
A
NTÓNIO DE
A
ZEVEDO
P
EREIRA
iii
Abstract
This Master’s Final Work aims to present a company valuation of Semapa – Sociedade de Investimento e Gestão, SGPS, S.A. as the sum of the parts of the companies it owns – The Navigator Company, Secil and ETSA. This Equity Research follows the format recommended by the CFA Institute.
We choose Semapa because it came from an interest in this industry and previous knowledge. This report was made using the public information available at September 2019, and therefore any information and events after this date were not considered.
To obtain the target price, two methods were applied: one absolute and one relative. The absolute was the Discounted Cash Flow (DCF) method and the relative was the Market Multiples Approach. In the valuation of DCF was reached the Price Target of EUR 13.47 for the end of the year 2019, that represents an upside potential of 10.27% regarding the price registered by the company on September 9, 2019, of EUR 12.22, our final recommendation for Semapa is to buy. In relation to a Market Multiples Approach, that returned a Price Target of EUR 8.13, in this case, lower than the price on September 9, 2019, recorded by the Semapa shares, this fact was attributed to the specificities of the Semapa, regarding its’s peers. Our risk assessment still estimates a low risk for the company.
Keywords: Semapa, SGPS, S.A.; The Navigator Company, S.A.; Secil; ETSA; Equity Research;
iv
Resumo
Este Trabalho Final de Mestrado pretende apresentar uma avaliação da empresa Semapa – Sociedade de Investimento e Gestão, SGPS, S.A. como a soma das partes das empresas que possui – The Navigator Company, Secil e ETSA. Esta avaliação segue o formato recomendado pelo CFA Institute.
A escolha da Semapa deriva de um interesse neste sector e conhecimento prévio. Este relatório foi realizado através da informação pública disponível até setembro de 2019, e por isso, qualquer informação e evento após esta data não é considerada no trabalho.
Para a obtenção do preço-alvo, foram aplicados dois métodos: um absoluto e um relativo. O absoluto foi o Método do Discounted Cash Flow (DCF) e o relativo foi o Método de Múltiplos de Mercado. Na abordagem do DCF foi atingido o preço-alvo de 13.47€ para o fim do ano de 2019, que representa um potencial de valorização de 10.27% em relação ao preço registado pela empresa a 9 setembro de 2019, de 12.22€, sendo a nossa recomendação final para a Semapa de compra. Em relação a abordagem pelo Método de Múltiplos, retornou um preço-alvo de 8.13€, neste caso, inferior ao preço de 9 setembro de 2019 registado pelas ações da Semapa, este fato foi devido às especialidades das subsidiárias (The Navigator Company e Secil) em relação aos seus pares. A nossa avaliação do risco estima ainda um risco baixo para a empresa.
Palavras-Chave: Semapa, SGPS, S.A.; The Navigator Company, S.A.; Secil; ETSA; Avaliação;
v
Acknowledgements
The realization of this MFW was a difficult working process, that requires a lot of dedication and time, where I was challenged to apply my knowledge in Equity Valuation. This project represents the end of a very important stage of my life and would not have been possible without the support of my family, boyfriend, friends, and professors. So, I feel the duty and need of thanking all of those who made possible the accomplishment of one more step on my journey.
I should thank in the first place to my family, my boyfriend and my friends for all the help and motivation and for always being at my side in the worst and best moments since the beginning of this master. Second, to my supervisor José de Azevedo Pereira for all guidance and knowledge. Finally, I would also like to thank ISEG, I am very grateful for this last five years of intensive learning and growth. Thank you for all.
vi
Index
ABSTRACT ... III RESUMO ... IV ACKNOWLEDGEMENTS ... V INDEX ... VI LIST OF FIGURES ... VII LIST OF TABLES ... VIII LIST OF ABBREVIATIONS ... X1. RESEARCH SNAPSHOT ... 1
2. BUSINESS DESCRIPTION ... 2
3. MANAGEMENT AND CORPORATE GOVERNANCE ... 6
4. INDUSTRY OVERVIEW AND COMPETITIVE POSITION ... 7
5. INVESTMENT SUMMARY ... 13
6. VALUATION ... 14
7. FINANCIAL ANALYSIS ... 17
8. INVESTMENT RISKS ... 18
9. APPENDICES ... 20
APPENDIX A: STATEMENT OF FINANCIAL POSITION... 20
APPENDIX B: INCOME STATEMENT ... 24
APPENDIX C: CASH FLOW STATEMENT ... 28
APPENDIX E: FORECASTING ASSUMPTIONS ... 29
APPENDIX F: SALES BREAKDOWN STRUCTURE ... 32
APPENDIX G: GOVERNANCE MODEL ... 34
APPENDIX H: SEMAPA KEY MANAGEMENT PERSONNEL ... 34
APPENDIX I: PORTER’S FIVE FORCES ANALYSIS ... 36
APPENDIX J: SWOT ANALYSIS ... 38
APPENDIX K: VALUATION METHODOLOGIES ... 38
APPENDIX L: DISCOUNTED CASH FLOW ASSUMPTION – THE NAVIGATOR COMPANY .... 40
APPENDIX M: DISCOUNT CASH FLOW ANALYSIS – THE NAVIGATOR COMPANY ... 41
APPENDIX N: DISCOUNTED CASH FLOW ASSUMPTION – SECIL ... 42
APPENDIX O: DISCOUNT CASH FLOW ANALYSIS – SECIL ... 43
APPENDIX P: SUM-OF-PARTS DISCOUNT CASH FLOW – SEMAPA... 44
APPENDIX Q: COMPARABLE COMPANIES ... 45
APPENDIX R: MULTIPLES VALUATION ... 46
vii
List of Figures
FIGURE 1.SEMAPA’S SEGMENT REVENUES STRUCTURE (2018) ... 2
FIGURE 2.SEMAPA'S REGION REVENUES STRUCTURE (2018) ... 2
FIGURE 3.BEKPPULP PRODUCTION (THOUSAND TAD) ... 3
FIGURE 4.UWFPAPER PRODUCTION (THOUSAND TON) ... 3
FIGURE 5.TISSUE PRODUCTION (THOUSAND TON) ... 3
FIGURE 6.ENERGY PRODUCTION (GWH) ... 4
FIGURE 7.QUANTITY SOLD IN PORTUGAL VS REAL GDP ... 4
FIGURE 8.QUANTITY SOLD IN LEBANON VS REAL GDP ... 4
FIGURE 9.QUANTITY SOLD IN TUNISIA VS REAL GDP ... 5
FIGURE 10.QUANTITY SOLD IN BRAZIL VS REAL GDP ... 5
FIGURE 11.QUANTITY SOLD IN ANGOLA VS REAL GDP ... 5
FIGURE 12.NET DEBT/EBITDA ... 6
FIGURE 13.SHAREHOLDER’S STRUCTURE ... 6
FIGURE 14.REAL GDPGROWTH (%) ... 7
FIGURE 15.EUROPE REAL GDPGROWTH (%) ... 7
FIGURE 16.GENERAL GOVERNMENT GROSS DEBT... 7
FIGURE 17.INFLATION RATE (%)... 8
FIGURE 18.MOZAMBIQUE INFLATION RATE (%) ... 8
FIGURE 19.PORTUGAL INFLATION RATE (%) ... 8
FIGURE 20.EVOLUTION OF EUROPEAN UWFAPPARENT CONSUMPTION (M TONS) ... 9
FIGURE 21.%SHARE OF EACH PAPER SUBGRADE ON WORLD PRINTING AND WRITING PAPER DEMAND . 9 FIGURE 22.GLOBAL PAPER AND PAPERBOARD MARKET ... 10
FIGURE 23.GLOBAL WOOD PULP MARKET ... 10
FIGURE 24.PULP AND PAPER DIFFERENT PRICE VOLATILITY ... 10
FIGURE 25.WOOD PRICES ... 11
FIGURE 26.CRUDE OIL BRENT ... 11
FIGURE 27.GDP AND TOTAL CONSTRUCTION OUTPUT (EC-19)(YEAR TO YEAR CHANGE IN%) ... 12
FIGURE 28.GDP AND TOTAL CONSTRUCTION OUTPUT (PORTUGAL)(YEAR TO YEAR CHANGE IN %) .. 12
FIGURE 29. EUR/USD EXCHANGE RATE ... 13
FIGURE 30.TARGET PRICES VS CURRENT PRICE -SEMAPA ... 14
FIGURE 31.THE NAVIGATOR DEBT EVOLUTION ... 15
FIGURE 32.SECIL DEBT EVOLUTION ... 15
FIGURE 33.SALES BY SEGMENT –THE NAVIGATOR ... 17
FIGURE 34.GROSS PROFIT MARGIN –THE NAVIGATOR ... 17
FIGURE 35.ROE–THE NAVIGATOR ... 17
FIGURE 36.SALES BY REGION –SECIL ... 17
FIGURE 37.ROE–SECIL ... 18
FIGURE 38.NET PROFIT MARGIN –SECIL ... 18
FIGURE 39.EVOLUTION OF THE EUROPEAN MARKET PAPER PRICE -A4B-COPY (EUR PER TON) ... 32
FIGURE 40.EVOLUTION OF THE BHKP PRICE IN EUROPE (USD PER TON AND EUR PER TON) ... 33
FIGURE 41.ORGANIZATION OF SEMAPA’S DIFFERENT BODIES AND COMMITTEES ... 34
FIGURE 42.PORTER'S 5FORCES OF THE NAVIGATOR COMPANY ... 36
viii
List of Tables
TABLE 1.SEMAPA’S MARKET DATA ... 1
TABLE 2.RISK ASSESSMENT ON SEMAPA ... 1
TABLE 3.FINANCIAL HIGHLIGHTS ... 1
TABLE 4.EFFECTS OF CHANGING WAAC IN PRICE ... 1
TABLE 5.SEMAPA'S BRIEF PROFILE ... 2
TABLE 6.MULTIPLES ... 13
TABLE 7.VALUATION SUMMARY -SEMAPA ... 13
TABLE 8.COST OF CAPITAL -THE NAVIGATOR ... 14
TABLE 9.COST OF CAPITAL -SECIL ... 14
TABLE 10.THE NAVIGATOR'S WACC ... 16
TABLE 11.SECIL’S WACC ... 16
TABLE 12.MULTIPLE PRICE TARGET ... 16
TABLE 13.CHANGE IN NWC–THE NAVIGATOR COMPANY ... 16
TABLE 14.CHANGE IN NWC–SECIL ... 16
TABLE 15.THE NAVIGATOR'S FINANCIAL RATIOS ... 17
TABLE 16.SECIL'S FINANCIAL RATIOS ... 18
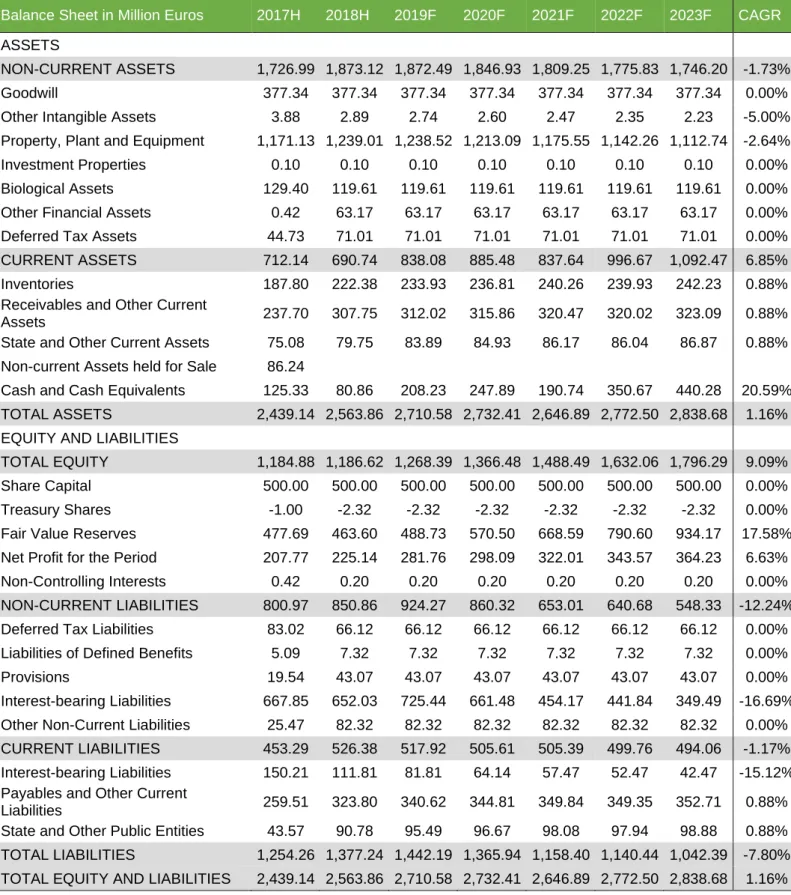
TABLE 17.BALANCE SHEET -THE NAVIGATOR COMPANY ... 20
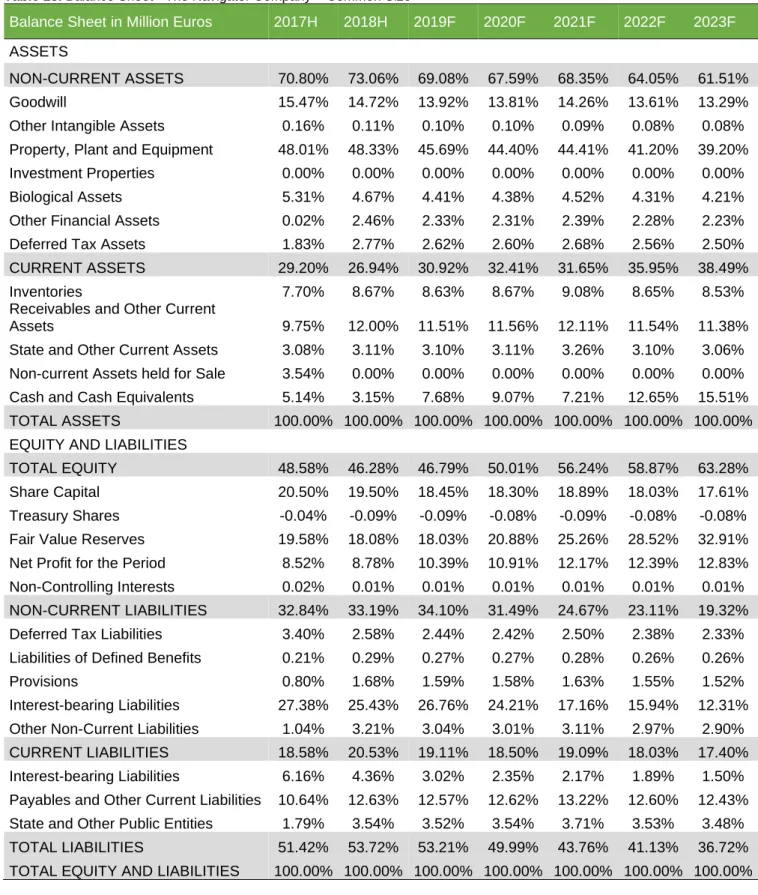
TABLE 18.BALANCE SHEET -THE NAVIGATOR COMPANY –COMMON SIZE ... 21
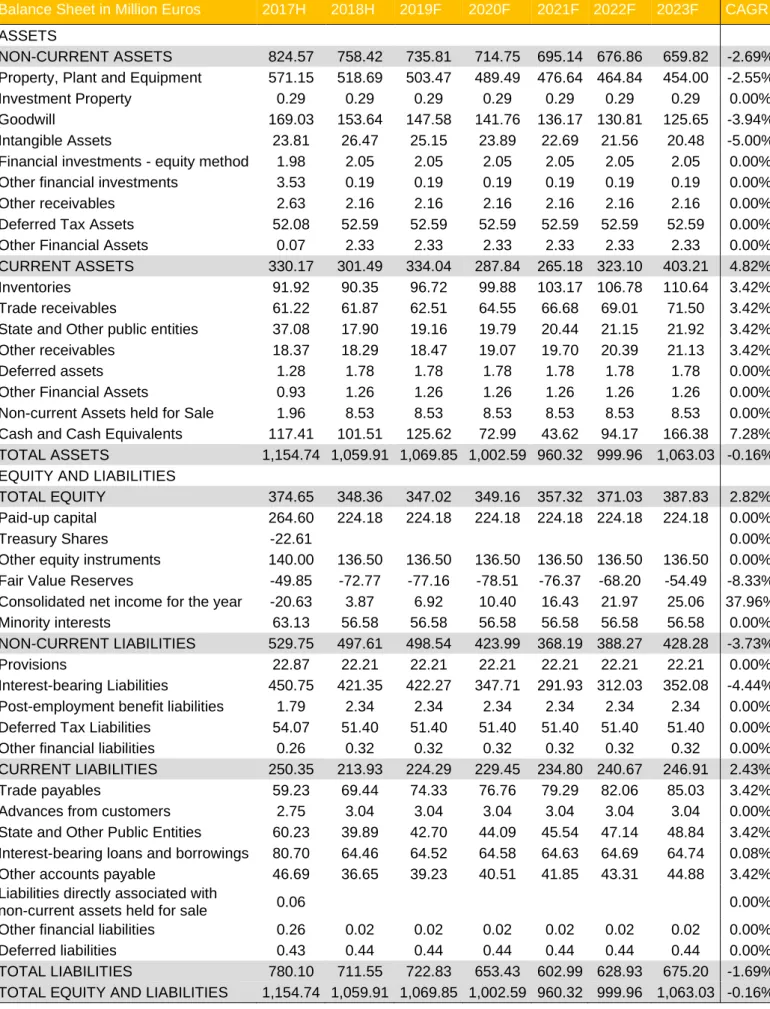
TABLE 19.BALANCE SHEET –SECIL ... 22
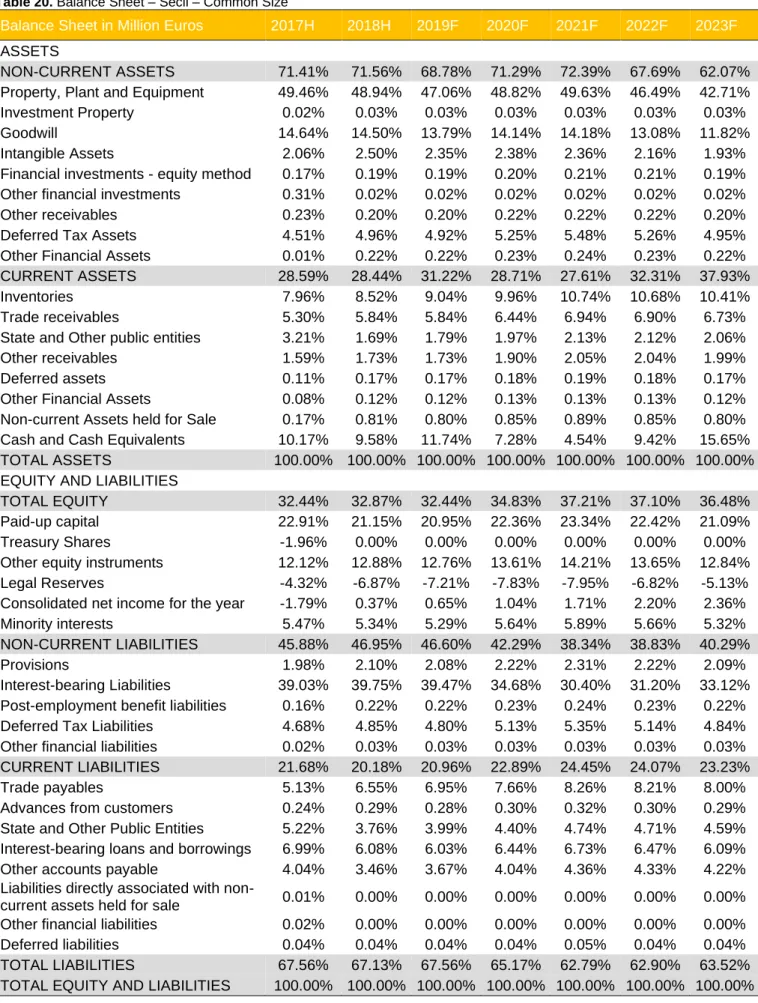
TABLE 20.BALANCE SHEET –SECIL –COMMON SIZE ... 23
TABLE 21.INCOME STATEMENT -THE NAVIGATOR COMPANY ... 24
TABLE 22.INCOME STATEMENT -THE NAVIGATOR COMPANY -COMMON SIZE ... 25
TABLE 23.INCOME STATEMENT –SECIL... 26
TABLE 24.INCOME STATEMENT –SECIL –COMMON SIZE ... 27
TABLE 25.CASH FLOW STATEMENT -THE NAVIGATOR COMPANY ... 28
TABLE 26.CASH FLOW STATEMENT -SECIL ... 28
TABLE 27.INCOME STATEMENT ASSUMPTIONS -THE NAVIGATOR COMPANY ... 29
TABLE 28.INCOME STATEMENT ASSUMPTIONS –SECIL ... 29
TABLE 29.BALANCE SHEET ASSUMPTIONS -THE NAVIGATOR COMPANY ... 30
TABLE 30.BALANCE SHEET ASSUMPTION -SECIL ... 31
TABLE 31.FORECAST OF OPERATIONAL DATA OF THE PAPER SEGMENT ... 32
TABLE 32.FORECAST OF OPERATIONAL DATA OF THE PULP SEGMENT ... 32
TABLE 33.FORECAST OF OPERATIONAL DATA OF THE ENERGY SEGMENT ... 33
TABLE 34.FORECAST OF OPERATIONAL DATA OF THE TISSUE SEGMENT ... 33
TABLE 35.FORECAST OF OPERATIONAL DATA OF THE CEMENT SEGMENT IN PORTUGAL ... 33
TABLE 36.COMPOSITION OF THE BOARD OF DIRECTORS ... 34
TABLE 37.COMPOSITION OF THE AUDIT BOARD ... 35
TABLE 38.COMPOSITION OF THE REMUNERATION COMMITTEE ... 35
TABLE 39.SWOT ANALYSIS –THE NAVIGATOR COMPANY ... 38
TABLE 40.SWOT ANALYSIS –SECIL GROUP ... 38
TABLE 41.WACC ASSUMPTIONS –THE NAVIGATOR COMPANY ... 40
TABLE 42.DETAILED NAVIGATOR COMPANY CAPEX ... 40
TABLE 43.DEBT OF THE NAVIGATOR COMPANY ... 40
TABLE 44.DCFANALYSIS -THE NAVIGATOR ... 41
ix
TABLE 46.THE NAVIGATOR COMPANY FORECAST EV AND DCF PRICE TARGET ... 41
TABLE 47.WACC ASSUMPTIONS –SECIL ... 42
TABLE 48.DETAIL SECIL CAPEX ... 42
TABLE 49.DEBT OF SECIL ... 42
TABLE 50.DCFANALYSIS –SECIL ... 43
TABLE 51.FCFF–SECIL ... 43
TABLE 52.SECIL FORECAST EV ... 44
TABLE 53.SEMAPA'S EQUITY SUM-OF-PARTS –DCFMETHOD ... 44
TABLE 54.PEERS:INITIAL SAMPLE ... 45
TABLE 55.PEERS:TRADED ... 45
TABLE 56.FINAL PEERS’ SELECTION –THE NAVIGATOR ... 46
TABLE 57.FINAL PEERS' SELECTION –SECIL ... 46
TABLE 58.PEERS MULTIPLES 2019F–THE NAVIGATOR ... 46
TABLE 59.THE NAVIGATOR PRICE TARGET -MULTIPLES ... 46
TABLE 60.PEERS MULTIPLES 2019F-SECIL ... 47
x
List of Abbreviations
APV – Adjusted Present Value
BEKP – Bleached Eucalyptus Kraft Pulp BV – Book Value
CAPEX – Capital Expenditure CAPM – Capital Asset Pricing Model CAGR – Compounded Annual Growth Rate CF – Cash Flow
CRP – Country Risk Premium D&A – Depreciation & Amortization D/E – Debt-to-Equity
DCF – Discounted Cash-Flow E – Earnings
EBIT – Earning Before Interest and Taxes
EBITDA – Earnings Before Interest, Taxes, Depreciation and Amortization EUR – Euro
EV – Enterprise Value F – Forecasted
FCFF – Free Cash Flow to the Firm GDP – Gross Domestic Product IMF – International Monetary Fund Kd – Cost of Debt
Ke or Re – Cost of Equity Ku – Cost of Equity M – Million
MRP – Market Risk Premium NWC – Net Working Capital P – Price
P/E – Price to Earnings PT – Price Target Rf – Risk-free TV – Terminal Value
UWF – Uncoated Woodfree
1
Table 1. Semapa’s market dataMarket Profile Closing Price (€): 12.22 52-week price range (€): 11.10 - 17.40 Nº Shares (million): 81.27 Market Cap (€ million): 926.48 Price Target (€): 13.47 Source: Reuters
Table 2. Risk assessment on Semapa
LOW
MEDIUM
HIGH
Source: Author
Table 3. Financial highlights
In millions of EUR 2018
Revenue 2198
Paper and Pulp 1692
Cement and derivatives 482
Environment 24 Net profit 133 Net debt 471 Source: Author
SEMAPA, SGPS, S.A.
BUY
Lower risk October 2019Portugal
1. Research Snapshot
(2019YE Price Target of EUR 13.47; 10.27% Upside Potential; Low Risk; Final Recommendation: BUY; Reuters: SEM.LS; Bloomberg: SEM PL)
Our final recommendation for Semapa – Sociedade de Investimento e Gestão, SGPS, S.A. stands at BUY, with a YE2019 target price of EUR 13.47 and an upside potential of 10.27% concerning the last closing price of EUR 12.22 on September 9th, 2019. The target price is computed using the DCF approach as the
main model. To substantiate this recommendation, we use another methodology – Market Multiple Approach. Considering the market approach, the recommendation would be to sell. In our view, the second model’s downside potential arises from differences in size and footprint between the subsidiaries of Semapa (The Navigator Company and Secil Group) and its closest competitors. Hence, in our opinion, this model shows the least reliable price estimation.
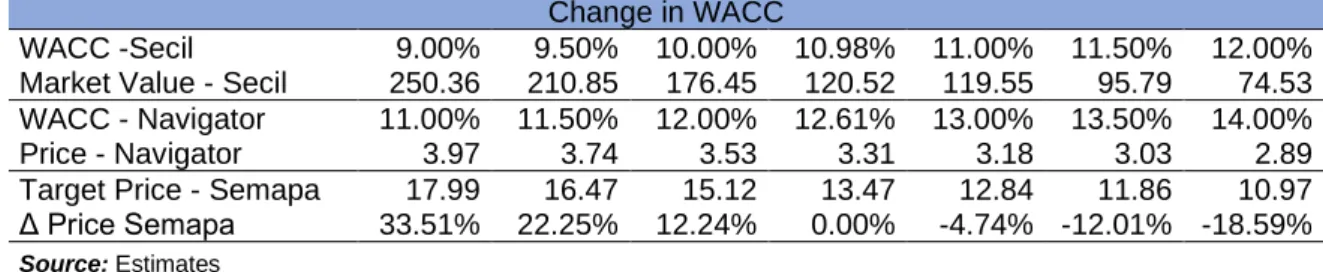
Sensitivity Analysis was used to access the investment risk. To compute this analysis one variable was used, the WACC. Based on this analysis, we concluded that changes in that variable will lead to a large impact on the target price. For instance, a change in Secil’s WACC to 9% and Navigator’s WACC to 11%, with everything else remaining constant, would lead the target price to change to EUR 17.99 – our recommendation would naturally stand – buy.
Table 4. Effects of changing WAAC in price
Change in WACC
WACC -Secil 9.00% 9.50% 10.00% 10.98% 11.00% 11.50% 12.00%
Market Value - Secil 250.36 210.85 176.45 120.52 119.55 95.79 74.53 WACC - Navigator 11.00% 11.50% 12.00% 12.61% 13.00% 13.50% 14.00%
Price - Navigator 3.97 3.74 3.53 3.31 3.18 3.03 2.89
Target Price - Semapa 17.99 16.47 15.12 13.47 12.84 11.86 10.97 Δ Price Semapa 33.51% 22.25% 12.24% 0.00% -4.74% -12.01% -18.59%
2
Table 5. Semapa's brief profileType Anonymous
Society Trade as Euronext Lisboa
Founded 1991
Headquarters Lisboa, Portugal
Subsidiaries
The Navigator Company, Secil and Group ETSA
Key people Chairman: Heinz-Peter Elstrodt; CEO: João Castello Banco Number of Employees (2018) 6,054 Auditor KPMG
Source: Corporate Data - Semapa
Figure 1. Semapa’s Segment Revenues Structure (2018)
Source: Corporate Data - Semapa
Figure 2. Semapa's Region Revenues Structure (2018)
Source: Corporate Data - Semapa
2. Business Description
Semapa – Sociedade de Investimento e Gestão, SGPS, S.A. (Reuters: SEM.LS;
Bloomberg: SEM PL) is a Portuguese holding company focused on a core business segment: Pulp & Paper. Furthermore, Semapa is also present in Cement & Other Building Materials and Environment. The Paper & Pulp segment is operated by The Navigator Company, S.A. (Navigator or Navigator Group). The Cement & Other Building Materials segment is operated by Secil – Companhia Geral de Cal e Cimento, S.A. (Secil or Secil Group). The Environment segment is operated by ETSA Investimentos, SGPS, S.A. (ETSA or ETSA Group). On 31/12/2018, Semapa retains 69.44% of the voting rights of The Navigator Company, 99.99% of the voting rights of Secil and 99.99% of voting rights of ETSA. Most recently, it retains 100% of the voting rights of Semapa Next (a Venture Capital project launched in 2018). This Portuguese company operates on several continents: Europe, North America, South America, Asia, and Africa. The company was founded in 1991 to bid for a stake in the privatization of Secil, the partly state-owned cement company. Afterwards, financed through several issues of new equity and debt, it acquired a financial participation Cimpor in 1998, expanding its position in the cement sector. Cimpor is a multinational company, founded in 1976, that operates in the cement sector.
In the following years, the company consolidated its leading position in Portugal. The internationalization became the next step, with acquisitions in Tunisia, Lebanon, and Angola. In 2004, the group turned to the Pulp & Paper sector, by acquiring a significant stake in the public offering that materialized second privatization of The Navigator Company, changing its strategic focus from Cement to Pulp & Paper. Semapa assured the Group’s control by guaranteeing a stake of approximately 70%. Additionally, ETSA Group, that resulted from the merger of Sebol and ITS in 1997, was incorporated in Semapa Group in 2008.
At the end of 2018, its subsidiary Semapa Next started a partnership with the North American company Techstars, one of the biggest accelerators of start-ups in the world. This partnership consists of an investment in 10 start-ups picked up in sectors like industry, logistics and mobility, and tourism and leisure.
The Navigator Group is a company listed on the PSI-20 Stock Exchange since
1995 and its core business is the pulp and paper production. Its subsidiaries operate in i) the production and sales of paper – Uncoated Woodfree (UWF); ii) cellulose pulp – Bleached Eucalyptus Kraft Pulp (BEKP) and its related products: iii) purchase of wood, forest and agricultural production, cutting timber and sale of pulp and paper in Portugal, Germany, Spain, France, Italy, United Kingdom, Netherlands, Austria, Belgium, Switzerland, Morocco, Poland, Turkey, the United States of America and Mozambique, among others. The Navigator is also involved in the energy sector, generating surplus power that is introduced into the national grid, which results in a significant contribution to energy production. About 5% of all electricity generated in Portugal is generated by the Company. The company owns or manages more than 110.000 hectares of woodlands, able to produce 12 million plants a year, through a vertically integrated forestry business. Navigator owns several paper brands in order to satisfy different needs from different types of clients. Its brands can be subdivided into two groups: Office and Offset. The Office
3
Figure 3. BEKP Pulp production(thousand Tad)
Source: Corporate Data - Semapa
Figure 4. UWF Paper production (thousand ton)
Source: Corporate Data - Semapa
Figure 5. Tissue Production (thousand ton)
Source: Corporate Data - Semapa
group is aimed for professional and domestic use. The “Navigator” is considered an office brand and it is known worldwide as the leader of premium office market paper. Nevertheless, the Offset Group is targeted for people that use graphic paper. For this specific purpose, the company operates with two brands: “Soporset” and “Inaset”.
➢ BEKP Pulp
In 1957, the company became a global pioneer by producing bleached eucalyptus pulps using the kraft process. This production process originally started to produce in Cacia in 1953. Navigator produces and sells Bleached Eucalyptus Kraft Pulp (BEKP), of which the majority of the output is integrated into the production of paper and tissue business, and only a small fraction is released to the market. It is the European leader in production of BEKP and the 5th leading producer
worldwide. The pulp is produced at the company’s three mills that hold a total capacity of 1.6 million tons. 570 thousand tons per year in Setúbal, 650 thousand tons per year in Figueira da Foz and about 350 thousand tons in Cacia. Wood and chemicals are the main raw materials used.
➢ UWF Paper
In 1969, the production of paper started in Setúbal. Navigator is the leading European and the 6th leading producer of UWF paper worldwide. This type of
paper is produced using chemicals and pulp produced by Navigator. This paper is sold to more than 120 countries. Currently, paper is produced at three different mills. Setúbal Industrial Complex includes two paper mills – with an overall annual capacity to produce 775 thousand tons and Figueira da Foz with an annual capacity to produce 800 thousand tons. The Navigator Group owns 9 different brands of paper sheet: Inacopia, Pioneer, Navigator and Navigator Eco-Logical, Target, Explorer, Multioffice, Discovery, Inaset, and Soporset.
➢ Tissue
In 2015, the company entered the tissue market, considered strategic for its future expansion, through the acquisition of AMS BR Start Paper S.A.. Tissue paper is produced at two different mills. Vila Velha de Ródão holds an annual production capacity of 60.000 tons of tissue reels and 65.000 tons of finished product. In Cacia, the annual production capacity reaches 70.000 tons of reels and 55.000 tons of finished product per year. The plant in Vila Velha de Rodão is the most efficient in the Iberian Peninsula and the second most efficient in Europe.
➢ Energy
Energy is generated in three industrial sites – Setúbal, Figueira da Foz and Cacia – from three different processes – natural gas cogeneration, biomass cogeneration process and from biomass power plants. All mills comprise biomass cogeneration facilities that produce jointly energy pulp and paper. Afterwards, the corresponding energy is used for its own operations. At Figueira da Foz and Setúbal, there is a natural gas cogeneration plant, and in Setúbal and Cacia there are biomass power stations able to produce electricity that is later sold to the National grid. Hence, the Navigator Group increases the use of a renewable source of energy and decreases the use of CO2 intensive sources. It has a capacity of production for
2.5TWh of electricity each and 52% of the energy produced from biomass. In 2018 it produced 2.2TWh.
4
Figure 6. Energy Production(Gwh)
Source: Corporate Data - Semapa
Figure 7. Quantity Sold in Portugal vs Real GDP
Source: Corporate Data - Semapa and
IMF
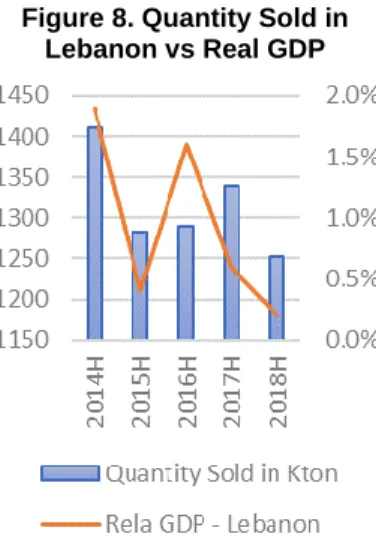
Figure 8. Quantity Sold in Lebanon vs Real GDP
Source: Corporate Data - Semapa and
IMF
➢ Forest
The company manages woodlands of about 120 thousand hectares promoting the development and protection of the national forest, of which 73% is Eucalyptus globulus plantations and the rest is diversified plantations. Navigator recently increased its forest to Spain, in Galicia. The company is associated with social, environmental and educational projects.
The Secil Group is the second largest company in Semapa’s Group and leads its
holdings in the cement, concrete and aggregates sector. It operates in Portugal, Brazil, Lebanon, Tunisia, Angola, Netherlands, Spain and Cape Verde. The cement industry is highly dependent on the building sector in each of the geographic markets where it operates, as well as on the level of investment in infrastructures. Secil holds today a strong position, both in the domestic and foreign markets, focused on the production and sale of cement, precast concrete, ready-mix concrete and the operations of quarries at the Maceira, Pataias, Outão, Gabés (it owns facilities in the South of Tunisia since 2000), Beirut (it owns facilities in Lebanon, since 2002), Lobito (it owns facilities in Angola since 2004) and Adrianópolis (it owns facilities in Brazil since 2011). The diversification of investments across different countries leads Secil to expose itself to high levels of currency risk. This was the main reason for negative result achieved in 2018, due to devaluation of the corresponding national currencies against the Euro.
➢ Portugal
In Portugal, Secil operates through the Outão, Maceira-Liz and Cibra-Pataias plants, holding an annual capacity of cement production around 4 million tonnes. These plants produce cement and clinker and produce more than 35% of the cement consumed in Portugal. In 2018, in the domestic market, the volumes sold increased by 0,8% in relation to 2017, due to good weather conditions and the rise in private projects (tourism and residential). In the foreign market (includes the terminal sale in the Netherlands, Cape Verde, and Spain), volumes sold decreased by 17.7%. The main drivers for this evolution were the surplus supply in Europe and the fact that sale prices remain at very low levels, despite the increase in production costs (the increase in fuel and CO2 cost). The exceptions at this level
were the Netherlands and Spain (the group started production here last in April 2017), where there was an increase of around 20% in sales. That is, there was a growth from 225.000 tons to 269.000 tons in the sales of the terminals.
➢ Lebanon
In Lebanon, Secil is the third largest Lebanese cement and clinker producer, through the Ciments de Sibline (CDS), which has an annual production capacity of 1.2 million tonnes of cement. In 2018, the overall performance of the cement segment was negative, due to the rising cost in raw materials and fuel. This market still presents significant political and economic unbalances. The domestic market registered a total sale of 1.1 million tonnes, a 6% drop in relation to 2017, that was mainly due to a fall in the cement segment. Given the highly competitive environment of the ready-mix concrete, the volumes sold were 97 thousand tonnes, 1.8% less than in the previous year.
5
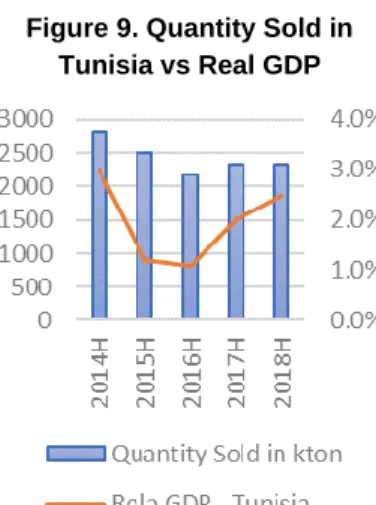
Figure 9. Quantity Sold inTunisia vs Real GDP
Source: Corporate Data - Semapa and
IMF
Figure 10. Quantity Sold in Brazil vs Real GDP
Source: Corporate Data - Semapa and
IMF
Figure 11. Quantity Sold in Angola vs Real GDP
Source: Corporate Data - Semapa and
IMF
➢ Tunisia
In Tunisia, Secil produces clinker, cement, and artificial lime, through the Société des Ciments de Gabès (SCG), with an annual production capacity of 1.4 million tonnes of cement. In 2018, the domestic market reached 846 thousand tonnes, increasing 5%, as compared to 2017. In the foreign market, sales reached approximately 259 thousand tonnes, 11.6% lower than in 2017. The decline in the cement sales in the external market was compensated by an increase on the internal market, that ultimately led to an increase of 0.6% in the total sales. The main downturns of the ready-mix concrete sales in Tunisia have been due to the reduction of new projects in several markets as a consequence of the economic crisis that the country and the sector have gone through, and also due to difficulties in obtaining funding for construction output. In spite of the good performance of the cement sector, the ready-mixed concrete segment did not perform well, showing a deterioration of 10,7% in sales volume.
➢ Brazil
Secil in Brazil produces cement and clinker, through the Supremo Cimentos in two plants. Pomerode – with an annual production capacity of 400 thousand tons of cement – and Adrianópolis – with an annual production capacity of 1.8 million tonnes of cement. In 2018, cement sales reached 1.33 million tons, 4.6% above the previous year, despite the decrease in the Brazilian market. This evolution was achieved due to the organizational restructuring that allowed a decrease industrial fixed costs, maintaining a commercial strategy of growth with the opening of two new distribution centres. In 2018, there was a decline in clinker production (4.6%) due to the rise in transport costs of materials in the last quarter of the year (truck drivers’ strike). Similarly, the ready-mix sales decreased 9.3% due to the lack of infrastructure works, although the real estate construction sector seems to show signs of improvement.
➢ Angola
In Angola, Secil only produces cement, through Secil Angola, Investimentos e Participações, S.A., with an annual production capacity is 350.000 tonnes of cement. In 2018, the cement production decreased to 122 thousand tonnes, due to difficulty in acquiring fuels and clinker. Hence, with strong inflation, the value cement prices suffered an increase of about 31%, as compared to 2017.
ETSA Group is the smallest company in the Semapa’s group, and it only
represented 1% of the total revenues, in 2018. ETSA leads the Enterprise Group of environment service, a waste business involved in the collection, storage, and treatment of animal by-products.
Company Strategies
➢ Commitment to developing employees – Semapa group’s human
resources management is focused on the professional and personal development and growth of its employees.
➢ Innovation and diversification – Semapa Next is a new project derived from
the co-investment in start-ups, that is focused on investing outside of Semapa’s core sectors. Areas like Industrial and Environment Technology, Intelligent Transport and Travel, and Leisure Technology. Therefore, Semapa Next aims to allocate capital to promising start-ups in the growth phases.
6
Figure 12. Net Debt/EBITDASource: Corporate Data - Semapa and
Author
Figure 13. Shareholder’s Structure
Source: Corporate Data - Semapa
➢ Level of indebtedness – Semapa’s purpose is to decrease its financial
leverage that led to a Net Debt/EBITDA of 2.83x in 2018. The objective of this strategy is to increase the financial strength and low-risk profile of the company. In 2018, there was an improvement of 0.5x compared to 31 December 2017, with net debt decreasing in all areas, but with a particular emphasis on the holding company. In 2018, the main drivers for that reduction in debt were dividends received from Navigator, the payment of dividends and of financial liabilities (Figure 12).
Shareholder Structure
On 31 December 2018, the majority shareholder of Semapa was Sodim, with 71.416% of share capital and voting rights. The nest major stakes were held by Bestinver (with 8.818% of share capital), and Norges Bank, the central bank of Norway, (with 2.091% of share capital) that are nowadays the biggest investors without direct links to the control family. The other 17.675% of share capital is free-floating – Figure 13 (Annual report, 2018).
Semapa Group held 640.666 own shares, corresponding to 0.78% of its share capital. These shares are traded on Euronext Lisboa. The stock price, during 2018, reached a maximum of 24.2 euros on 13 June, and a minimum of 12.66 euro on 18 December. The 2018 economic year was characterized by a high level of volatility, with growing uncertainty and tension.
3. Management and Corporate Governance
According to the Articles of Association, the company follows a governance model composed of the General Meeting, the Board of Directors, the Auditor Board, and a Statutory Auditor (Appendix G).
General Meeting - is elected by all shareholders with voting rights, and each share
corresponds to one vote. The officers in charge of the general meeting are, at this moment, the Chairman of the General Meeting, Francisco Xavier Zea Mantero, and the secretary Luís Nuno Pessoa Ferreira Gaspar. These members were elected on 24 May 2018 until 31 December 2021.
Board of Directors (BoD) – is chosen by the Annual General Meeting to a
four-year term. Until August 2018 the Chairman of the Board of Directors was Pedro Mendonça de Queiroz Pereira who ceased to exercise after passing away, being replaced by Hein-Peter Elstrodt on October 2018 – decided made at the meeting of the Board of Directors that took place in this month, but only starting the exercise function on 1 January 2019. Currently, the Board integrates 13 members, 4 executive directors that are members of the Executive Committee and 9 non-executive directors. In the case of Semapa, only 2 non-non-executive directors fit the criteria to be considered an independent director because they were not previously associated with the group of interests in the Company. As regards, the other non- executive directors, none respects the corresponding criteria, since they are members of companies owning qualified positions and receive remunerations for their duties (Appendix H).
Board of Auditors – is selected by the Annual General Meeting and composed of
four members: one president, two regular members, and one substitute member. This board is responsible for drawing up an annual report on its audit activities
7
Figure 14. Real GDP Growth (%)Source: IMF
Figure 15. Europe Real GDP Growth (%)
Source: IMF
Figure 16. General government gross debt
Source: IMF
about accounts and motions submitted by the directors, ensuring the compliance with law and control of the rules applicable to the company and audit services (Appendix H).
Statutory Auditor – it selected by the Board of Auditors to be approved and
elected by the General Meeting. Since 2018 the statutory auditor is KPMG & Associados – SROC, S.A. represented by Paulo Alexandre Martins Quintas Paixão (ROC). The External Auditor is the statutory auditor. This body is responsible for supervising Semapa’s accounts.
Social Responsibility
In 2018, the Semapa Group spent around 2.2 million in community welfare, families being the main beneficiaries of the corresponding donations. This Group sponsored several initiatives aimed at improving the welfare of the community and the preservation of the environment.
Semapa’s sustainable strategy passes by the well-being of its employees, a strong connection with the community, and environmental protection, through several initiatives and projects as Fundação Nossa Senhora do Bom Sucesso, Associação Salvador, Liga para a Proteção da Natureza, and MDV Projeto Família. Additionally, its subsidiaries Navigator Group, Secil Group, and ETSA Group, there are sustainability into all levels of management.
4. Industry Overview and Competitive Position
Global Economic Outlook
The global economy slowed particularly in the second half of 2018 and the first quarter of 2019, affecting major economies, after high growth in 2017. The forecast for 2019 implies a lower growth of GDP, at approximately 3.3 percent, as compared to 2018 – Figure 14. This occurs mainly due to the trade dispute between the USA and other trade partners, particularity China, and the implications of the Brexit. However, from 2020 until 2023, it is expected a recovery of the global economy, with an average GDP growth of 3.6 percent per year. The economy of
the more advanced countries is projected to stay to sluggish gradually as the
impact of US fiscal incentive weakens and still uncertainty about the duration of the growth cycle. The projected improvement is predicated in a gradual stabilization of conditions in stresses emerging market economies, including Argentina and Turkey.
In Europe, the growth of GDP forecast shows a downward trend. It is expected to grow at a lower rate every year until it stabilizes at 1.7 percent. Due to a combination of factors such as a weakening consumer and business feeling, and delays related to the introduction of new fuel emission standards for diesel-power cars in Germany. In Italy, the continued uncertain political situation, high levels of sovereign spreads and deceleration investment. In France, street protests resulted in a negative impact on the market. In addition, the withdrawal of the United Kingdom from the European Union creates uncertainty and weaker investor confidence.
The growth in the medium term is modest because average growth in total factor productivity has a decreasing trend, the population aging will have an impact on
8
Figure 17. Inflation Rate (%)Source: IMF
Figure 18. Mozambique Inflation Rate (%)
Source: IMF
Figure 19. Portugal Inflation Rate (%)
Source: IMF
economic growth due to the reduction of the labour force, investment slowdown in the next years due to a moderate impact of geopolitical uncertainty on business sentiment and tightening of financial condition, and structural imbalances in the labour market with a higher level of unemployment. The public debt has declined moderately due to economic growth and accommodative financial condition but continues high (Figure 16).
The projections of the IMF about the global growth in Abril 2019 are lower than in October 2018. The forecast for 2019 drops 0.4 percentage points in relation to the forecast for 2018 and for 2020 they reveal a decrease of 0.1 percentage points. Hence, the global growth is projected at 3.3 percent in 2019 and is expected to accelerate to 3.6 percentage points in 2020 (from 3.6 percent in 2018). In this context, the global economy keeps growing, in spite of the poor performance in Europe and Asia, that should continue in 2019.
In 2018, global inflation was 3.6%, and it is expected continue until 2020. Afterwards, it is expected to decrease to 3.5% in 2021 and 2022. In emerging market and developing economies, excluding Venezuela, is expected to increase to 4.9% in 2019, after its steady decline of the past decade. In advanced economies it is expected to decrease to 1.6% in 2019.
The political and economic growth in Mozambique is unstable, due to increasing debt levels, lower commodity exports prices, lower demand from international trading allies and reduction in investment levels. An additional contribution comes from, the increase in prices of basic imports – fuel and food. Hence, if there is no restructuring of debt and no recoverin investor trust, the economy will have slow growth. In 2019, real GDP growth is projected to be 4% and inflation 4.2%.
In Portugal, after growing strongly in 2017, the growth of the Portuguese economy has been declining in 2018, with a real GDP of 2.1% (from 2.8% in 2017). Even though is still well above its level during 2014. This development was sustained by increasing exports and the pick up of domestic demand. It is possible to expect a decreasing trend in 2019, with a forecasted 1.7% GDP growth and a positive performance of the labour market that is expected to see a reduction in the unemployment rate. Inflation is expected to reach 1% in 2019, and in the next years it is expected to show an increasing trend.
In Lebanon, according to the IMF, the economic and political situation is still unstable, with possible progress in the Syrian conflict and the natural change in terms of the Syrian refugees will tend to produce a macroeconomic effect, that it is not possible to anticipate with precision. New fiscal measures are expected in Lebanon, after a recent recovery in oil prices. Real GDP is expected an increase to 1.3% in 2019 with a tendency to increase in the next years. Inflation is expected to decrease from 6.2% in 2018 to 2% in 2019.
In Tunisia, for 2019, monetary policy is expected to remain tight aiming to stabilize foreign exchange and inflation. The IMF has projected an increase of 2.7% in real GDP growth, for 2019, and the continuation of the trend in the next years. Inflation is expected to increase 20 bps in relation 2018, and the next years is expected decrease until 2023F.
9
Figure 20. Evolution of EuropeanUWF Apparent Consumption (M tons)
Source: Euro-Graph; EMGE; RISI;
Navigator Presentation
Figure 21. % share of each paper subgrade on world printing and
writing paper demand
50% 25% 13% 13% Uncoated Woodfree Coated Woodfree Coated Mechanical Unoated Mechanical
Source: PPPC; Navigator Presentation
The outlook for Brazil projects a strong pickup in growth, in 2019, with expected growth of 2.1% in 2019, above 1.1% in 2018. Although the prices have recovered, they remain highly volatile and vulnerable. An example of this is the decline in oil prices in the last quarter of 2018. Growth prospects for commodity exporters remain uncertain since the price collapse in 2014/15 due to higher levels of debt and increased political uncertainty. Inflation is projected to be 3.6% in 2019 and the next years should remain constant.
The outlook for Angola’s economy is moderate growth. The GDP growth is
projected to increase from -1.7% in 2018 to 0.4% in 2019, according to the projections of the IMF. In 2018, inflationary pressures have eased, due to decreasing interest rate levels aimed at supporting the economy and also due to the maintenance of a tight with weak exchange rates and higher inflation rates. This progress will be supported by public investment and oil production expansion.
Industry Economic Outlook
• Paper & Pulp
The paper industry is divided into two categories: graphic paper and packaging paper. Graphic papers include two grades: newspaper, and printing and writing papers (P&W). The graphic paper production is decreasing due to the digitalization and change in patterns of media consumption, whilst packaging paper production is increasing with higher demand. These contrasting directions for paper and cardboard production are expected to continue in 2019. According to the Pulp and Paper Products Council (PPPC), paper demand for UWF paper remains constant in P&W papers in 2018. The P&W papers are divided in Uncoated Woodfree (UWF), Coated Woodfree (CWF), Uncoated Mechanical and Coated Mechanical (Figure 21). In 2018, the company obtained a market share of more than 50% in Europe in the P&W paper segment.
Since 2007, the demand for Printing and Writing papers has declined due to macroeconomic factors and the decreasing use of copy and print material. To revert the potential demand decrease, slowly several P&W paper producers transformed their production lines into packaging, which allowed some balance to the P&W paper market prices. Since 2015, the antidumping case launched by the US to paper imports from several countries (including China, Australia, Indonesia, Brazil and Portugal) forced many of producers to redirect sales, mainly into Europe, resulting in a saturation of paper in the European market that pushed paper price downwards in 2016, despite the lower capacity of absorption in the market. After the paper price fall in 2016, the paper price has moved upwards until now. Since 2009 to 2017, the CAGR of European UWF Apparent Consumption decreased by 1.2% and the Capacity Production decreased 2.5% (Figure 20). In UNECE countries, the paper and cardboard consumption decreased by about 1% in 2017 and by 0.5% in 2018, it is expected to continue to decrease in 2019 since paper is slowly being substituted by digital technology. In 2018, paper and cardboard production declined by 0.4%, according to the Committee on Forests and the Forest Industry (COFFI) for the UNECE.
To keep its competitive position in this sector, Navigator must innovate in its production methods. In 2017, paper was the most recycled product – with more
10
Figure 22. Global paper andpaperboard market
Source: RISI, McKinsey & Company
Figure 23. Global Wood Pulp Market
Source: Mordor Intelligence
Figure 24. Pulp and Paper different price volatility
Source: FOEX; Navigator Presentation
than 70% of recycling in Europe – according to the Confederation of European Paper Industries (CEPI). Therefore, this trend should advantage of the sector in the long term because paper can be utilized as an alternative to plastic, cardboard packaging being considered more environmentally friendly.
In addition, economic growth prospects are weaker for 2019 in Europe (1.7% in 2019 after 2.1% in 2018), hence the demand for packaging materials is expected to slow slightly. In the United States, demand for graphic paper has been declining and the trend continued, with a fall in demand of 0.8% in the second quarter of 2018. In contrast, demand for packaging materials has been on an upward trend over the same period. In China, paper and cardboard consumption is expected to be sustained by hearty growth in 2019 (6.2% after 6.6% in 2018).
Therefore, the paper industry is growing, even though at a slower pace than before. Despite the decline in the graphic-paper segment, other products are occupying the gap. Hence, the paper industry is not disappearing, only it is changing, modifying and improving.
The pulp industry uses two different types of processes: mechanical pulp and chemical pulp. Mechanical pulp is mainly used for applications such as newsprint and tissues. Chemical pulp is used to provide the required strength when producing papers and done by utilizing the “kraft process”. The pulp can be bleached or unbleached and can be made from hardwood or softwood timber. The Bleached Softwood Pulp (such as pine and spruce) is stronger paper with harsh finishing, with possible end use application in linerboard, packaging paper, and magazine paper. The Bleached Hardwood Pulp (such as Oaks and Eucalyptus) reveals increased printability, with possible end use applications in writing and printing and sanitary paper. Lastly, Unbleached pulp shows possible end use applications in sack paper and packaging paper.
Eucalypt is the main raw material of pulp. Wood is formed by fibres. The division and transformation of this fibre will produce pulp, that is utilized as a raw material in the papermaking process. The pulp demand depends on the capacity of the paper production as it represents the main raw material of paper. So that the principal element in pulp is the wood cellulose acquired from trees and the key element in the paper is the pulp. According to Mordor Intelligence, the wood pulp market is projected to a CAGR of 2.1% to period 2019-2024. This increase depends on increasing demand for wood pulp from the paper industry and tissue paper products, and growth in the trade of wood pulp products.
Main production losses in 2017/2018 resulted in pulp shortage and quick market pulp price increases. The main contributing factors to the tightening of supply included catastrophic failures at major pulp facilities, trucking strikes, unexpected equipment spare time and weather impacts. Demand for fibre continues growing, world consumption is forecasted to grow by 1.3% in the long term. China maintains its role as the main growth driver in the pulp market, since it accounts for 60% of the expected market demand until 2030. The market demand growth in pulp and paper is expected to show different patterns among segments and regions, according to the study made for McKinsey & Company.
11
Figure 25. Wood pricesSource: Nasdaq
Figure 26. Crude Oil Brent
Source: Nasdaq
The cyclicality of the pulp and paper sector is influenced by several factors, all linked with each other. The production capacity and demand are two of those factors and the price is the other relevant factor – that is ultimately driven by the capacity and demand. In the special case of The Navigator Company, the most relevant price indexes are the PIX BHKP for pulp and the PIX A4-Copy B for paper. Both the pulp and paper industries exhibit a cyclical pattern (Appendix F). The paper industry shows the most regular pattern, when compared with the pulp industry. Between 2008 and 2018, the pulp price has reached a maximum of EUR 920 and a minimum of EUR 370, corresponding to a variation of 149%. On the other hand, paper price has shown a maximum of EUR 917 and a minimum of EUR 750 – a variation of 22%. This indicates that there is higher volatility implicit in the pulp industry.
• Tissue
The tissue paper market is driven by socio-economic factors having a strong correlation with GDP. The packaging is growing all over the world, with tissue papers, and pulp for hygiene products. The tissue paper is typically utilized in the kitchen, toilets, and household and is expected to drive the growth of the market over the next decade. Products included in consumer tissue are being sold to supermarkets and stores or in the away-from-home segment – sold to hotel chains. The pulp is the most important cost driver in tissue, representing more than 70% of the reel and more than 50% of toilet paper. Consumer tissue will be pushed by demographic changes and buyer trends.
The tissue has become one of the most up-and-coming markets inside the Paper and Pulp Sector, as “old” paper sectors will tend to have a more questionable importance in a more technological world. The Chinese tissue market has been a very strong upswing, with new peaks in consumption and production being recorded each year. Between 2010 and 2018, Canada maintains itself as the main US import source for tissue, but China has taken the second position. However, import duty will likely restrain imports, or at least growth in imports from China from 2019 onward.
• Energy
Renewable energy can be produced from an extensive diversity of sources including wind, solar, hydro, tidal, geothermal, and biomass. Renewable energy has registered increasing technological developments over the years and biomass power has achieved shift as it uses plants, timber waste and other waste for ignition into steam. The market that is growing due to the use of biomass power reduces the need for fossil fuels to produce heat and electricity in residential, industrial and agricultural use. The global biomass power market is expanding at a fast pace and biomass power typically complements the use of natural components in the production of energy.
Crude oil prices are affected more by international markets than by assumptions regarding domestic resources and technological progress. The uncertaint macroeconomics of future economic growth affect important drivers of energy demand growth. According to the EIA, the global oil demand should hold at 101.5 mbpd, in 2019 – an increase of 1.4% related to 2018, and the oil supply should stand at 102 mbpd, a hike of 2.4% compared to 2018. In Europe, the demand is
12
Figure 27. GDP and Totalconstruction output (EC-19) (year to year change in%)
Source: EUROCONSTRUCT, June
2019
Figure 28. GDP and Total construction output (Portugal)
(year to year change in %)
Source: EUROCONSTRUCT, June
2019
expected to stall in 2019, at almost 14.4 mbpd (+0.5%). Since 2013, renewable energy regulation about energy produced by co-generation plants has changed and consequently in a decrease of the subsidized prices paid for mills with the impact affecting progressively the plant according to the age of production activity.
• Cement and Derivatives
This sector is extremely unstable in terms of macroeconomic factors. As a result of the cyclicality of the sector, most market partners tend to expand your activity outside their residing country, because different construction cycles in distinct regions help ease the sector’s inherent volatility and permit – especially European – construction companies to benefit from stronger growth forecast outside Europe. Labour shortages are reaching crisis proportions and are expected to continue through 2019. The construction sector throughout the world exhibits divergent realities and different prospects for 2019. Construction companies have three main segments: buildings, infrastructure/civil engineering and concessions, and industrial construction.
In Portugal, the outlook is favourable, since the construction sector points to a slight acceleration, after a growth of 3.5% in 2018, the forecasts for 2019 estimate a real increase of 4% in the sector. The expectation for 2019, in the building construction segment, will be of a growth of 5%, through the construction of residential buildings that increase 7.5% and the construction of non-residential buildings with a growth of 2.4%. The outlook, in Brazil, is an improvement of conditions, with high expectations on the Government’s infrastructure and privatization program, which may give a strong impulse to the construction sector. Improvement in the Middle East and Africa region will develop considerably in 2019-2023 averaging 5.9% a year, that compares with 3.4% in 2014-2018. In sub-Saharan Africa, the pace of growth will be averaging 6.3% a year, in 2019-2023. The pace of global construction growth is projected to take up marginally in 2019, reaching 3.4% from 3.2% in 2018. The development is only owing to acceleration in growth in construction activity in emerging markets. But the expansion will be moderately sluggish in 2019-2023, with growth in North America slowing to 1.2%, and in Western Europe, there will be a deceleration to 2.3% a year (after recorded in 2014-2018 of 2.4%).
According to Euroconstruct1, the total construction industry grew by 3.1% in 2018,
but the perspective forecast for the period up to 2021 displays even slower progress, due to weakening economic growth. The short-term forecast reveals an expected slow and moderate growth. In effect, European construction is projected to increase by less than 2% in 2019, and by less than 1.5 percentage points in the next two-year period. The main factors constraining its growth are structural factors such as demographic pressure and market saturation, among others. It is expected that the infrastructure market will sustain the European construction market with an average annual growth of more than 3%. The improvement will be supported by a strong growth, of about 6% in Eastern European countries, except in Slovakia. For ______________________
1Euroconstruct 19 members: Austria, Belgium, Czech Republic, Denmark, Finland, France, Germany,
Hungary, Ireland, Italy, Netherlands, Norway, Poland, Portugal, Slovak Republic, Spain, Sweden, Switzerland, and United Kingdom.
13
Figure 29. EUR/USD exchangerate
Source: European Central Bank
Table 6. Multiples
The Navigator Company
Stora Enso Oyj SAPPI Limited
ENCE Energia y Celulosa, S.A. Domtar Corp
Secil
Cemex
Lafarge Holcim Ltd Heidelberg Cement
SA Des Ciments Vicat-Vicat Buzzi Unicem
Source: Estimates
Table 7. Valuation summary - Semapa
DCF method EUR 13.47
Enterprise Value EUR 1,840.17 Multiples average price
EUR 8.13
EV/sales price EUR 6.39 EV/EBITDA price EUR 11.25
Source: Estimates
Ireland, it is expected a strong increase, with a decelerating trend in the forecast period. Countries like the Netherlands, Portugal, and Spain are expected to register moderate progress, with growth rates of approximately 4%. The market expects a stagnation in the construction, in Germany and France, whilst in the UK and Italy it is projected an increase in production by less than 2% on average.
Market Conditions
Navigator and Secil operate in a large variety of markets using different currencies and are exposed to currency fluctuations. Consequently, this factor may have a considerable impact on revenues.
In the pulp and paper segment, a fraction of its sales is dominated in currencies other than Euro, the US Dollar being the most relevant. There are also, sales in Pound Sterling (GBP), Polish Zloty (PLN) and Swiss Franc (CHF) show some importance in the net earnings of the company, but naturally are less relevant. Purchase of some raw materials is made in USD, especially imports of wood pulp and softwood.
In the Cement and derivatives segment, the currency risk is mainly due to the current investments held in Brazil and to purchases of fuel and freight ships, both paid in USD. This segment operates assets located in Tunisia, Angola, and Lebanon that also have an impact on revenues.
Main Competitors in the Market and Peer Companies
To evaluate the competitive position in the paper and cement market and within its competitors, we performed a SWOT analysis and Porter’s five forces analysis. These two approaches are explained with more detail in Appendices I and J. A group of publicly traded companies was selected as peers to both, Navigator and Secil, in accordance to their main operational characteristics. The selection has also taken into consideration factors like revenues and industry. In the pulp & paper sector, the companies considered were Arctic Paper, Sappi, Ence Energy y Celulosa, S.A., Verso Corp, and Domtar Corp. In the Cement and Derivatives sector, the companies considered were Cemex, LafargeHolcim Ltd, Heidelberg Cement, Des Ciments Vicat, and Buzzi Unicem.
5. Investment Summary
For Semapa our recommendation stands for buy with a target price of 13.47€ using the Discounted Cash Flow Approach. The valuation through DCF resulted in an upside potential of 10.27%. We can conclude that Semapa is currently undervalued. (Table 7 and Figure 30).
Valuation Methods
Semapa is a holding company that owns a significant stakes fraction of three companies in different industries. Therefore, due to the characteristics of Semapa, will be evaluated through a SoP approach. Then, the equity value of Semapa is calculated by multiplying the market value of Pulp & Paper and Cement segments by the percentage of each ownership, adding the book value of the Environment segment. After, it’s necessary to subtract the Semapa’s holding net debt (Appendix P).
14
Figure 30. Target prices vscurrent price - Semapa
Source: Estimates
Table 8. Cost of Capital - The Navigator Cost of Capital Risk-Free Rate (Rf) -0.69% Market Risk Premium (MRP) 9.02% Beta levered (β) 1.75 Cost of Equity (Ke) 15.07% Cost of Debt (kd) 3.59% Corporate Tax Rate 22.50%
After-Tax (kd) 2.78%
Source: Estimates
Table 9. Cost of Capital - Secil
Portugal Angola Rf -0.69% -0.69% MRP 9.02% 14.99% Beta levered 1.90 1.80 Ke 16.44% 26.35% Cost of Debt 5.39% 5.39% Tax Rate 22.50% 30.00% After-Tax Kd 4.18% 3.78% Brazil Lebanon Rf -0.69% -0.69% MRP 10.13% 14.99% Beta levered 1.75 1.97 Ke 17.06% 28.83% Cost of Debt 5.39% 5.39% Tax Rate 34.00% 17.00% After-Tax Kd 3.56% 4.48% Tunisia Rf -0.69% MRP 13.60% Beta levered 1.87 Ke 24.71% Cost of Debt 5.39% Tax Rate 25.00% After-Tax Kd 4.04% Source: Estimates Investments Risks
Investors must be aware that this is an investment subject to several risks that cannot be controlled, mainly due to the fact related to the exposure of the company to a large variety of countries with different levels of to the volatility of its consumer markets. Consequently, unexpected events create are very difficult to predict and prevent. These countries may suffer from economic problems, supplier shortages, and operational problems. To evaluate the investment risk the sensitivity analysis was performed.
6. Valuation
According to the Semapa’s features, the corresponding equity value will be calculated using a Discounted Cash Flow to the Firm (DCF) approach. Since the company is a holding owning 69.44% of Navigator Group, 99.99% of Secil Group and 99.99% of ETSA Group, it was necessary to evaluate each company separately, because these companies operate in different businesses, as previously mentioned. Hence, the valuation of Navigator and Secil are through DCF valuation, considering the free cash flow to the firm (FCFF) methodology, with approach WACC. ETSA will be considered at its book value as it represents less than 1% of Semapa’s total revenues.
Discounted Cash Flow (DCF) Valuation Approach
Discounted Cash Flow is nowadays the more applied and acknowledged method of fundamental analysis, since it explains with detail the relationship between risk/environment and the necessary investment for the generation of future income, in a framework that is not hampered by the shortcomings inherent to book values. This method uses free cash flows and discounts them using the WACC in order to reach the present value used to assess the potential investment. In the DCF method, the valuation is normally based on two cash flow components. One is the cash flows forecasted for the period of detailed projections and the other is the residual value or continuity value.
Assumptions for the explicit forecast period
The main assumptions inherent to the method depend on the macroeconomic contexts in which the company operates.
Revenues
The sales projection was based on the analysis of external studies aimed at understanding the growth of each company: The Navigator Company and Secil Group. The main factors that drive revenues are based on population growth and their expected level of income.
In relation to The Navigator revenue assumptions, there is no investment anticipated to increase the capacity of production. Consequently, production capacity will be assumed to remain constant in all segments of operation. The ability to use the installed capacity has been similar during the previous years. Hence, on this respect, it was adopted a slowly increasing rate until a 100% rate was achieved. The pulp sales are forecasted to remain stable (estimated to register a CAGR of 2.6% between 2019 and 2023) as we expected significant volatility in pricing. Despite the increase in capacity produced, the extra pulp will be internally used in the production of tissue. Paper sales are also forecasted to
15
Figure 31. The Navigator Debtevolution
Source: Author
Figure 32. Secil Debt evolution
Source: Author
remain stable on the back of stable prices, although we are estimating a slight increase in revenues in 2019 (estimated to register a CAGR of -0.1% between 2019 and 2023). The tissue is forecasted to increase, benefiting from the increased capacity, in 2018, and higher prices (estimated to register a CAGR of 7.7% between 2019 and 2023). Energy is expected to decrease, after a reduction in Brent prices in 2019, and to slowly decrease over the long term, due to the saturation of supply (estimated to register a CAGR of -0.3% between 2019 and 2023) (Appendix F).
In relation to Secil revenue assumptions, the quantities sold will grow at the respective country’s GDP growth rate. The prices practiced by each country will grow at the respective inflation rate. However, as each country exports to other markets and there is no information regarding it, prices will also grow at the inflation rate of the country that exports being Portugal an exception of this rule. In Portugal, it was assumed that the quantities sold for the internal market depend on the GDP forecasted by Euroconstruct for Portugal. The external market is mainly in Europe. Therefore, external quantities sold will grow at the real GDP growth rate forecast by Euroconstruct for the 19 European countries. (Appendix F)
Operational Costs
The operational costs are forecasted as a percentage of net sales, but at a decreasing rate, because The Navigator launched a cost-cutting program M2 in 2015 focused primarily on variable costs, especially on wood, chemicals, water, and fuels. In 2016-2018, Navigator was able to save € 64 million. Due to cost-cutting, we assumed the decrease of the percentage of operational costs over revenues projected based on a percentage of total revenues in 2018. In what concerns Secil, forecasted values were obtained by multiplying the weight of operational costs over revenues, was assumed the same that 2018, due to the percentage that has been increasing in the 5 last years.
CAPEX & Depreciations
The capital expenditures of The Navigator Company were rather volatile in the previous years, given the specific investments in new mills. The CAPEX consists in three components: the expansion development that allows for expansion of the production capacity of the company, maintenance & recurring that are necessary to guarantee the continuity of the company’s operating activity, and regulatory that relates to the remuneration of investments in the natural gas sector (electricity sector). Property, Plant & Equipment are depreciated at a rate of 11,3%/year (average of the previous years was assumed to be the constant depreciation rate over the explicit period). Intangible assets are related to CO2 emission licenses,
and industrial property and other rights were assumed to be depreciated at a constant rate (the depreciation rate of 5%).
The capital expenditures of Secil were also volatile in the previous years, in several countries. CAPEX was assumed in line with the historical period, being an average of the historical period. The depreciation rate assumed in the forecast was 8,13%/year for Property, Plant & Equipment (constant over the time). As intangible assets are related to industrial property, emission rights, and other intangible assets, the rate of depreciation used for this purpose was the same 5%.