1
MASTER OF SCIENCE IN
FINANCE
MASTER FINAL WORK
PROJECT
EQUITY RESEARCH
:
MICRON TECHNOLOGY
MARIUS GRØNLI
2
MASTER OF SCIENCE IN
FINANCE
MASTER FINAL WORK
PROJECT
EQUITY RESEARCH
:
MICRON TECHNOLOGY
MARIUS GRØNLI
SUPERVISOR
:
3
Abstract
This project is the final work as a part of the MSc. Finance degree at Lisbon School of Economics and Management (ISEG). Students can choose to write a master thesis or write an equity research of a chosen company. The project is structured after ISEG’s guidelines and the CFA institutes research report recommendations. I choose to analyze Micron Technology Inc. because of my interest in the technology sector, especially the semiconductor industry. The industry displays a lot of special traits like cyclicality and extreme capital requirements, which was both educational and demanding to analyze.
4
Acknowledgements
To friends, family and girlfriend who have helped me through long hours of studying and especially trough this project which has taken a lot of my time and effort.
To all the professors at ISEG who have guided me through the MSc. Degree at ISEG. Especially Professor João Carvalho das Neves for being my supervisor and giving me a lot of constructive feedback and help on this project.
5
Index
Cover page ...2 Abstract ...3 Acknowledgements ...4 Index ...5 Index: Figures ...6 Index: Tables ...7 Index: Appendices ...8Report
Research Snapshot ...0 Business Description...1 Corporate Governance ...4 Industry Overview ...5 Investment Summary ...8 Valuation ...9 Financial Analysis ... 11 Investment risks ... 12Micron as portfolio asset ... 16
--- Appendices ... 19
Time Series Revenue Forecast: Support document ... 40
Time Series COGS Forecast: Support document ... 55
Abbreviation ... 58
6
Index: Figures
Figure 1: Recommendation scale ... Research snapshot Figure 2: Estimated price targets ... Research snapshot
Figure 3: Important markets ... 1
Figure 4: Revenue by product ... 1
Figure 5: Revenues by segment ... 1
Figure 6: Revenue by employee ... 2
Figure 7: CAPEX semiconductor industry ... 2
Figure 8: ROCE analysis ... 2
Figure 9: DRAM and NAND prices ... 3
Figure 10: 3D Xpoint revenue forecast... 3
Figure 11: DRAM maturity yield ... 3
Figure 12: NAND maturity yield ... 3
Figure 13: Microns shareholders... 4
Figure 14: Resource efficiency ... 4
Figure 15: Corporate governance summary ... 4
Figure 16: Memory industry revenue ... 5
Figure 17: Segment shares and growth ... 5
Figure 18: Forecasted growth and revenue for phone and computer market ... 5
Figure 19: Emerging markets analysis ... 6
Figure 20: ASP projection of Silicon Wafers ... 6
Figure 21: Memory price dynamics ... 6
Figure 22: Memory market shares ... 7
Figure 23: Chinese market revenue ... 7
Figure 24: Investment in new fabs by countries ... 7
Figure 25: Porters five forces ... 7
Figure 26: Cumulative return for SOX, S&P and MU ... 8
Figure 27: MU metrics vs Peers 2018 ... 8
Figure 28: DCF summary ... 8
Figure 29: Revenue forecast ... 9
Figure 30: ARIMA revenue forecast ... 9
Figure 31: COGS forecast ... 9
Figure 32: ARIMA COGS forecast ... 9
Figure 33: 3D Xpoint revenue forecast... 10
Figure 34: Micron COGS evolution compared to industry... 10
Figure 35: Forecasted CAPEX ... 10
Figure 36: DEBT/EQUITY vs WACC ... 10
Figure 37: Ratio multiples ... 11
Figure 38: Revenue volatility ... 11
Figure 39: Debt ratio and interest coverage ... 11
Figure 40: Economic profit analysis ... 12
Figure 41: Recommendation scale ... 14
Figure 42: Variable sensitivity ... 15
Figure 43: Security regression output ... 16
Figure 44: SOX Index decomposition: Risk and return ... 17
7
Index: Tables
Table 1: Micron market data ... Research snapshot Table 2: Price target sensitivity to ROCE ... Research snapshot Table 3: Price target sensitivity to ROCE (risks to price target section) ... 14 Table 4: Sensitivity of revenue growth (fade period) and COGS (fade period) ... 15 Table 5: Monte Carlo simulation ... 15
8
Index: Appendices
Appendix 1: Statement of Financial Position ... 19
Appendix 2: Income statement ... 20
Appendix 3: Cash flow statement ... 21
Appendix 4: Key financial ratios ... 22
Appendix 5: Income statement assumptions ... 23
Appendix 6: Statement of Financial Position assumptions ... 24
Appendix 7: Semiconductor product stream and product characteristics ... 25
Appendix 8: ROCE analysis ... 26
Appendix 9: Metrics comparison between Micron and the memory market peers ... 27
Appendix 10: Debt schedule ... 28
Appendix 11: Comparable companies... 29
Appendix 12: Multiple valuation ... 32
Appendix 13: DCF assumptions ... 34
Appendix 14: DCF model ... 35
Appendix 15: Recommendation table ... 35
Appendix 16: Sensitivity analysis ... 36
Appendix 17: Porters five forces ... 37
Appendix 18: Portfolio construction ... 38
0
Source: Yahoo finance
Source: BPI investment
Source: Author
Source: Author
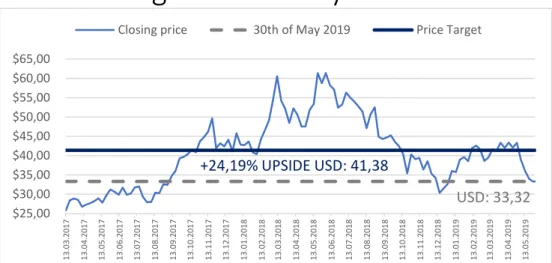
MU: Entering a new bust cycle
Buy is the recommendation for Micron with an estimated price target of $41,38
from a DCF model. Multiple valuation support that Micron is undervalued, with an estimated price target of $34,10. Mean variance theory indicates that Micron should be included in a constructed asset that covers the US semiconductor industry. The current closing price 30.05.2019 indicates an upside potential of
24,19%. Microns efficient use of its employed capital (Appendix: 8) in an extreme
capital intense industry result in a robust business model, estimated to generate positive cash flows during the bust cycle.
Debt repayment prepare Micron for a new bust cycle. As the average selling
prices peaked in the last quarter of 2018 (DRAM ASP: +37% YoY) the industry went into a new bust cycle with the ASP in free fall due to the increasing
oversupply. With revenues estimated to decline 25% YoY and an estimated CAPEX of $9 billion in 2019F Micron must be able to acquire capital at reasonable rate. In 2016 Microns debt/equity ratio reached 113% after acquiring Inotera memories. After using the boom cycle to deleverage, Micron reached a debt/equity ratio of 30% in 2018. The deleveraging made Micron able to negotiate a new desirable credit agreement with an interest rate equal to LIBOR +1,5% to 2%.
Introducing the first new memory class to the markets since NAND was introduced in 1989. The introduction of 3D Xpoint will result in a new revenue
driver for Micron with a revenue potential of $3,36 billion in 2023. DRAM and NAND accounted for 96% of Microns revenues in 2018, which both have very volatile prices. By introducing 3D Xpoint Micron will strengthen its revenue diversification and be able to target niche markets, which require high speed memory chips. $25,00 $30,00 $35,00 $40,00 $45,00 $50,00 $55,00 $60,00 $65,00 1 3 .0 3 .2 0 1 7 1 3 .0 4 .2 0 1 7 1 3 .0 5 .2 0 1 7 1 3 .0 6 .2 0 1 7 1 3 .0 7 .2 0 1 7 1 3 .0 8 .2 0 1 7 1 3 .0 9 .2 0 1 7 13 .1 0. 20 1 7 1 3 .1 1 .2 0 1 7 1 3 .1 2 .2 0 1 7 1 3 .0 1 .2 0 1 8 1 3 .0 2 .2 0 1 8 1 3 .0 3 .2 0 1 8 1 3 .0 4 .2 0 1 8 1 3 .0 5 .2 0 1 8 1 3 .0 6 .2 0 1 8 1 3 .0 7 .2 0 1 8 1 3 .0 8 .2 0 1 8 1 3 .0 9 .2 0 1 8 1 3 .1 0 .2 0 1 8 1 3 .1 1 .2 0 1 8 1 3 .1 2 .2 0 1 8 1 3 .0 1 .2 0 1 9 1 3 .0 2 .2 0 1 9 1 3 .0 3 .2 0 1 9 1 3 .0 4 .2 0 1 9 1 3 .0 5 .2 0 1 9
Closing price 30th of May 2019 Price Target
USD: 33,32
+24,19% UPSIDE USD: 41,38
Table 2: Price traget sensitivity to ROCE Figure 1: Recommendation scale
Figure 2: Estimated price targets Table 1: Micron market data
University of Lisbon - ISEG
Micron Technology, inc.
NASDAQ Stock Exchange
Industry: Semiconductor
Recommendation date: 30.05.2019 Current price: $33,32 Recommendation: Buy (+24,19%)
KEY DATA
Ticker: MU Risk assesment: Medium DCF Target prce: $41,38
Marius Grønli ([email protected])
-20% -10% 0% 10% 20% 30% 0,00 10,00 20,00 30,00 40,00 50,00 Closing price DCF MV P/E EV/Sales EV/EBITDA
1
Business description
Micron Technology, Inc., Including its subsidiaries, is one of the industry leaders
in innovating memory and storage technologies. Most of Microns Technologies revenue is generated through its global brands – Micron®, Crucial®, and Ballistix®. The broad portfolio of products is transforming how the world uses information. Their products are key elements of technologies like artificial intelligence, machine learning and autonomous vehicles.
Thehistory of Micron Technology starts in 1978 when the company was founded
as a semiconductor design company. In 1980 the company acquired its first plant and few year later they had produced the world’s smallest 256k DRAM chip. In 1994 the company was listed on Fortune 500 and since that the company has grown steadily through innovation, acquisitions and partnerships to be one of the market leaders in the semiconductor industry. Micron technologies products can be categorized in the three different core categories and are sold in four different segments.
Products
Compute and Networking Business Unit (CNBU)
CNBU sells memory products and advanced solutions for cloud servers,
enterprises, clients, graphics and networking markets. CNBU accounted for 50% of the total revenues in 2018 and had a growth rate of 77% from the previous fiscal year. Total sales were 15,25$ billion.
Mobile Business unit (MBU)
MBU sells memory products sold into smartphones and other mobile-device markets and includes discrete DRAM, discrete NAND and managed NAND. For the smartphone market speed/power output is extremely important since battery life is limited. In 2018, Micron announced a new 64-layer, second-generation 3D
NAND storage product, which supports the high-speed UFS 2.11 standard and
eMMC 5.1 standard. The UFS 2.1 speed supports technologies like AI, virtual
1 Universal Flash Storage(UFS) aims to bring higher data transfer speed and increased reliability to flash memory storage, while reducing market confusionand removing the need for different adapters for different types of cards.
Figure 3: Important markets
Source: Company(10k), Author
Memory DRAM DRAM modules Graphic Memory Managed NAND Multiship packages NAND Flash NOR Flash Storage Memory cards Solid State Drivers(SSD) Advanced solutions 3D Xpoint technology Advanced Computing Solutions Authenta QLC NAND
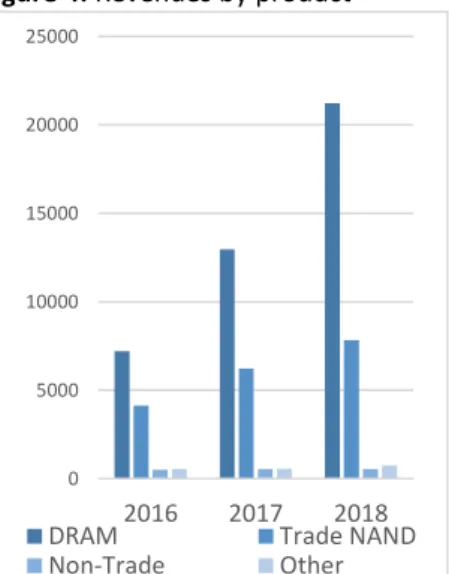
Figure 4: Revenues by product
Source: Company(10k), Author
Figure 5: Revenues by segment 0 5000 10000 15000 20000 25000 2016 2017 2018
DRAM Trade NAND
Non-Trade Other -40% -20% 0% 20% 40% 60% 80% 100% $2,00 $4,00 $6,00 $8,00 $10,00 $12,00 $14,00 $16,00 $18,00 2016 2017 2018 CNBU MBU SBU EBU Growth - CNBU Growth - MBU Growth - SBU Growth - EBU
2
Source: Bloomberg, Author
Source: Bloomberg, Author
reality and face recognition which is becoming more frequent on
high endsmartphones.MBU accounted for 22% of the total revenues in 2018 and had a
growth rate of 49% from the previous fiscal year. Total sales were 6,58$ billion.
Storage Business Unit (SBU)
SBU sells SSDs and component-level solutions into enterprise, cloud, client and consumer storage markets. SBU also include “non-trade” products. Micron have a
long-term supply agreement with intel through IMFT2, where they supply intel
with 3D Xpoint memory and NAND products at prices approximated to cost. MBU accounted for 11% of the total revenues in 2018 and had a growth rate of 17% from the previous fiscal year. Total sales were 5,02$ billion.
Embedded Business Unit (EBU)
EBU sells memory and storage products to the automotive, industrial and
consumer market. The products sold are discrete DRAM, discrete NAND, managed NAND and Flash. The market is characterized by long life-cycle DRAM and NAND products manufactured using mature technologies. The products enable edge devices to store, connect and share information in the growing internet of things(“IoT”). MBU accounted for 11% of the total revenues in 2018 and had a growth rate of 29% from the previous fiscal year. Total sales were 3,48$ billion.
Key drivers of profitability
Extreme capital requirements in the industry
The semiconductor has one of the highest capital requirements off all industries. The total CAPEX of all semiconductor memory firms reached $25 221 million in 2018. For Micron CAPEX amounted to 20% and 28% of the sales for 2017 and 2018. The reason the industry is so capital- and technology intense is because of the complexity in producing memory chips. The chips are produced at a
nanometer level and require extreme clean rooms for production, where only one dust particle could ruin the chip. The most current estimate regarding the cost of a production facility is from 2017, when Samsung built its new DRAM FAB (production facility). The cost where estimated to accumulate to $14 billion.
Return on invested capital (ROCE)
Since the capital requirements for the industry is very high the industry players must maximize their ROCE to stay competitive. By decomposing ROCE and inspecting each element we can determine what drives profitability (See
Appendix: 8 for the full analysis).
DRAM is the key revenues generator for MU accounting for 70% of the revenues in 2018, which is an increase from 58% in 2016. NAND accounted for 26% of the revenue, a decreased from 33% in 2016. The prices for DRAM have increased substantially since 2016, while the NAND price has continued to stagnate resulting in the current revenue shares. However, DRAM prices are extremely volatile (Figure 9) which makes the big revenue share of DRAM increase Microns risk. Micron delegates a part of their R&D investments to improve process technology, which enables continues improvement to cost structures and performance
2IMFT is a joint venture between Micron Technologies and Intel. The purpose of the venture is to share R&D
costs to develop NAND and 3D XPoint technologies. Micron owns 51% of IMFT and is governed by a Board of Directors, for which the number of managers is appointed by each member varies based on the members’ respective ownership interests. Source: Micron 10-k report, 2018.
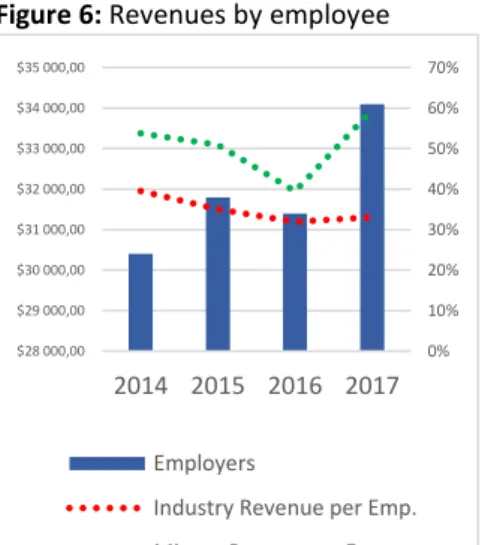
Source: Bloomberg, Author Figure 6: Revenues by employee
Figure 8: ROCE analysis
Figure 7: CAPEX Semiconductor
$0,00 $5 000,00 $10 000,00 $15 000,00 $20 000,00 $25 000,00 $30 000,00 $35 000,00 $40 000,00 $45 000,00 CAPEX CAGR 2017-2018 -2% 20% 44% 2% 12% 13% 2016 2017 2018 MU Industry 0% 10% 20% 30% 40% 50% 60% 70% $28 000,00 $29 000,00 $30 000,00 $31 000,00 $32 000,00 $33 000,00 $34 000,00 $35 000,00 2014 2015 2016 2017 Employers
Industry Revenue per Emp. Micron Revnue per Emp.
3 Figure 12: NAND maturity yield
Figure 9: DRAM and NAND prices
YOY
enhancements for their future product. The R&D effort on cost structures have yielded results. The COGS-to-Sales 3Y average is 56% for Micron while the
industry average is 67%, resulting in a cost advantage for Micron (see Appendix: 9 for full metrics analysis).
The capital employed has increased every year since 2016 combined with an increasing ROCE which means that Micron is managing to efficiently utilize their assets. For 2019 the Q2 (10-Q) report has indicated an increase of CAPEX to $9Billion, an increase of $0,121Billion. The increase is due to an effort to increase the amount of clean rooms used for production.
Company strategies
IMFT takeover and 3D Xpoint introduction
On the 14th of January 2019 Micron disclosed that they are exercising their call
option to buyout Intel from IMFT. The price is estimated to be around $1.5 billion in cash. This will dissolve Intel’s non-controlling interest in IMFT, as well as IMFT’s member debt. The takeover will result in IMFT being a wholly owned subsidiary of Micron. Micron plans to introduce 3D Xpoint to the market by the end of 2019, with a revenue ramp starting in 2020. However, based on prior agreements, Micron must sell 3D Xpoint memory wafers to intel one year after the deal is closed.
The IMFT takeover is a part of the Microns strategy to diversify their products as DRAM accounted of 70% of the revenues in 2018. The investment provides
Micron with an established manufacturing facility to produce 3D Xpoint3.
R&D with high focus on improving yields
Micron spent on average 9% of sales on R&D research the last three years. They recently expanded the amount of clean rooms used specifically for R&D. Their strategy is to improv how fast they can ramp up production from a certified product to full production, which maximizes the yields of the products. The past R&D results have improved the NAND “time to mature yields” with over 65% from the 16nm to the new 96layer chip. For DRAM the “time to mature yield” is
reduced by over 50% from the 25nm chip to the 1Ynm chip.
Collaborations with startup and universities to follow the AI market
In 2018 Micron announced that they would launch a new $100 million venture fund program to target AI start-ups. Micron also announced a $1 million research and teaching grant program through Micron Foundation, targeting AI
development. Since AI is at its early phase of industrialization a collaboration with start-ups and universities will give Micron valuable information about market developments and emerging technologies. New technologies like AI may require new chip architectures to optimize utilization. By collaborating with the market Micron can be pioneers in new emerging technologies.
3 Forecast collected from Chris Mellor’s article in Blocks and Files
(https://bit.ly/2NBWUCK). Forecast is done by Jim Handy, the memory guy at Objective Analysis and Mark Webb of MKW Ventures Consulting.
Source: Company(10-k), Author
Source: Micron 2019 analyst & investor webcast.
Source: Article by Chris Mellor (See footnote 3)
Source: Micron 2019 analyst & investor webcast.
Figure 11: DRAM maturity yield 6% -11% -35% 19% 37% -23% -17% -20% -9% -11% 2014 2015 2016 2017 2018 DRAM NAND
Figure 10: 3D Xpoint revenues forecast
$0, 00 $0, 13 $0, 63 $1, 63 $3, 60 $0, 90 $1, 35 $2, 00 $2, 65 $3, 13 2 0 1 9 2 0 2 0 2 0 2 1 2 0 2 2 2 0 2 3 Handy Webb
4
Source: Bloomberg, Author
Source: Bloomberg, Author
Corporate governance
Mr. Sanjay Mehrotra is the current CEO. Mehrotra was one of the co-founders of SanDisk Corporation founded in 1988. He eventually served as CEO from 2011 until SanDisk’s sale in 2016. He became CEO of Micron shortly after, in May 2017.
Board of directors’ structure and independence
The board of directors are elected each year by the annual shareholder meeting. The board of directors consist of 8 members, where Robert E. Switz act as the chairman of the board. Per 2018, 85% of the board are independent. The industry average per 2018 is 62,5% independence, while the general recommendation is that 2/3 of the members should be independent.
The board of directors has a standing of four committees
• Audit committee – The committee has the purpose of overseeing and monitoring the integrity of the financial statement, the company’s compliance with legal and regulatory requirements, the independence of the auditors and performance of the company’s internal audit function. • Finance committee – The purpose is to represent and assist the board in
conducting its responsibilities with respect to the Company’s financial policies, financial strategies and capital structure.
• Governance and sustainability committee – The main responsibilities of the G&S committee are: Director compensation, Identification of candidates (board members), Sustainability, Development of corporate governance guidelines and oversight and evaluation.
• Compensation Committee – The purpose is to assist the board in deciding the compensation to the Company’s officers.
The board of directors is independent and diversified, there is not a single group or entity with major control over the decision making.
Resource efficiency and social responsibility
Micron strategy for ensuring a healthy and secure workplace consist of establishing a health and safety committees at every manufacturing site. The program involves all parts of the production working collectively to ensure a safe environment. Micron also have a big focus on environmental issues and strive to minimize the climate footprint. However, they have a bigger energy intensity per sales (000s MWh per $/Million) of 365 compared to the industry average of 343. Micron has a foundation to ensure social responsibility toward communities called Micron Foundation. The foundation has three areas of focus:
• Inspiring learning – Deploys STEM outreach programs and partnerships. • Communities – Distributes $13,5 million to STEM programs and basic
human needs in the communities where they operate.
• Cultivate giving – A program where employees can do volunteer work for a good cause. Resulted in 150,000 employee hours spent on volunteer work. Micron also match employee donations up to $2 million. Figure 13: Microns shareholders
Source: Yahoo finance – 04.09.2019
19,94 % 7,77% 6,65% 5,23% 4,29% 3,27% 52,85 % Micron Technology Vanguard Group, Inc. Blackrock Inc.
Primecap Management Company State Street Corporation Capital World Investors
Figure 15: Corporate governance Figure 14: Resource efficiency
0 100 200 300 400 500 600 700 800 (000s M W h pe r $/E m ill io n) Industry average
5
Source: Bloomberg, Author Source: Data: Bloomberg, graph: Author
Source: Bloomberg, Author
Source: Data: IDC, graph: Author
Industry overview
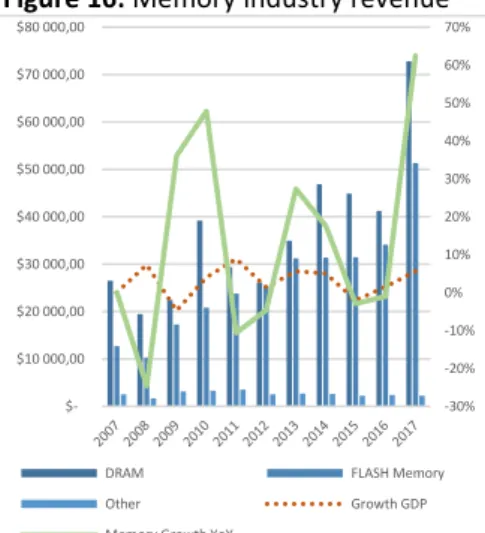
A highly cyclical industry
The memory industry is highly cyclical, which is explained by the products sold being commodities. The products are differentiated by different industry
standards for speed and power usage. The revenue growth of the memory market goes in cycles around the GDP growth of the overall economy. The memory growth tends to move in cycles with 2years growth followed by 2years decline. The cycles have an upwards going trend (See attached revenue forecast).
Industry size and markets
The memory market of the semiconductor industry had revenues of $126 billion with a 3Y CAGR of 16%. The memory market consists of the following segments; Computing, Wireless Communication, Consumer, Industrial, Wired
Communication and Automotive. In 2017 DRAM accounted for 58% of the
revenues with a 3Y GAGR of 16%. Computing was the biggest segment accounting for $31 billion with a 3Y CAGR of 13%. Wireless communication was close to computing accounting for $30 billion but exhibits a much higher growth rate then computing the last three years with a CAGR of 27%. The Automotive segment is the least earning segment only generating $833 million. However, the segment had an exceptional strong growth the last three years with a CAGR of 38% The NAND market is still smaller than DRAM, accounting for 40% of the revenues in the memory market, but its growing faster than DRAM with a 3Y CAGR of 18%. Computing is the most important segment within NAND. It generated $23 billion and had a 3Y CAGR of 26%. Wireless communication is a close second generating
$21 billion, but the 3Y CAGR is 14% indicated a weaker growth then the computer
segment. As well as for NAND as for DRAM the automotive market is showing an exceptional strong growth with a 3Y CAGR of 18%, but the market is small, only generating $675 million.
Declining growth in familiar markets
Wireless communication and computing has been one of the biggest growth engines for the memory players in the market. Wireless communication has mainly been driven by exponential growth in the smartphone market with a 7Y CAGR of 16,27%. However, the growth has been declining fast the previous years and the market is now starting to mature with an expected CAGR to 2020 of 2,6%. The traditional revenue drivers as PC, laptops and tablets is also expected to continue a slow growth path. The total of smartphones, desktop PC’s, laptops and tablets had a 7Y previous CAGR of 10,06% but are expected to have a CAGR to 2020 of 1,7%.
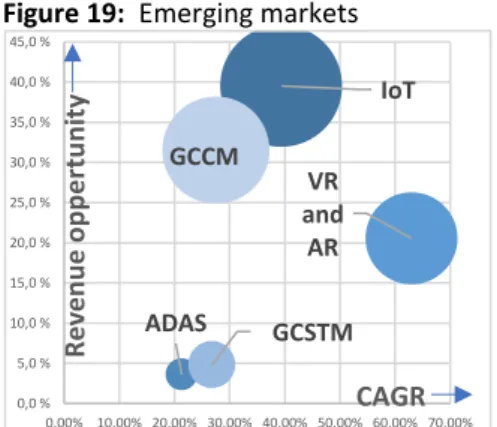
Future growth opportunities
A lot of new technological possibilities are emerging. Internet of things (IoT), Advanced Driver Asstive Systems (ASAD), Virtual- and Augmented Reality (VR and AR), Global cloud Computer and Storage (GCCM and GCSTM) are all relatively new emerging markets. All the markets are heavily dependent of memory products. Automotive is the fastest growing segment because of the transition to Advanced Driver Asstive Systems which require a substantial number of sensors and
Figure 18: Forecasted G and RV for
phone and computer market
Figure 17: Segment share and growth Figure 16: Memory industry revenue
-30% -20% -10% 0% 10% 20% 30% 40% 50% 60% 70% $10 000,00 $20 000,00 $30 000,00 $40 000,00 $50 000,00 $60 000,00 $70 000,00 $80 000,00
DRAM FLASH Memory
Other Growth GDP
Memory Growth YoY
-10% -5% 0% 5% 10% 15% 20% 25% 30% 35% 40% 0% 10% 20% 30% 40% 50% 60% 70% 80% 90% 100%
DRAM MARKET NAND Market DRAM 3Y CAGR NAND 3Y CAGR
-4,00% -3,00% -2,00% -1,00% 0,00% 1,00% 2,00% 3,00% 0,00 20,00 40,00 60,00 80,00 100,00 120,00 140,00 160,00 180,00 200,00
Phones Desktop Laptops
6
Source: Data: GGCM -Accuray research LLP,
GCSTM – Verified market research, VR/AR – Zion market research, ADAS- Allied market research, IoT – IoT Analytics. Graph: Author
Figure 20: ASP projection of Silicon
Wafer
Source: Data: SEMI, graph: Author Figure 21: Memory price dynamics
Source: Bloomberg, Author
computing power. However, the revenue potential 4 is 3,6%, which is low even
with a strong forecasted growth.
Computing had the second highest 3Y past CAGR of 20,4% and is supported by a market share of 44% so the growth has a big impact on the overall revenues. VR, AR, GCCM and GCSTM are all expected to impact the future growth of the computing segment. VR and AR have the strongest anticipated growth until 2025 with a CAGR of 63% followed by a strong earning potential of 20,5%. GCCM has the second strongest earning potential of 31,5% supported by a mid-range growth. Wireless communication had a 3Y CAGR of 17,1% with an overall market share in 2017 of 41,8%. The segment is heavily dependent of smartphone sales. However, IoT is already starting to affect the market. IoT is the most anticipated new segment in the semiconductor industry and all firms are taking steps to get involved. IoT has an earning potential of 39,5% combined with a strong CAGR of
39,4% it can support the growth of the segment, even though smartphones are
growing at a slower rate.
Supply side perspective
Market conditions for goods used in production
The most critical component is memory production are Silicon Wafers and
photomasks. The ASP of silicon wafers per square inch has gone from $1,4 in 2007 to $0,74 in 2017. The reason the price has declined is overproduction, because wafer companies has been aggressively adding capacity the last years. Now that the semiconductor industry had a peak in their cycle in 2018 there is a constraint on the supply, driving prices to increase. The ASP is forecasted to increase 3-5% each quarter during 2019. However, as the semiconductor industry is expected to have a decline in growth during 2019, the prices of silicon wafer is expected to stabilize if wafer producers don’t expand capacity during 2019. All memory producers are in joint venture or are vertically integrated in photomask production, making the prices less critical for the supply of memory chips.
Memory price dynamics
The memory products are viewed as commodities by the market, and the pricing follows a boom-bust cycle. Demand has less pricing power as there is thousands of buyers and only 7 firms controlling the majority of the market shares. By
analyzing the capacity expansion5 and the ASP of the industry 6 we can see how
the price is increasing and decreasing as a direct consequence of adding capacity. From 2013-2015 the price is increasing, and manufactures are adding capacity resulting in an oversupply. As the price decrease in 2016 the manufactures reduce capacity resulting in an undersupply and a price increase. The cycles tend to repeat itself every second year.
Constraint on the production
Due to the undersupply of DRAM and NAND and adding of capacity in 2017-2018
4 The revenue potential can be read as a market share of all new potential markets in
2025:
𝑅𝑒𝑣𝑒𝑛𝑢𝑒 𝑃𝑜𝑡𝑒𝑛𝑡𝑖𝑎𝑙 = 𝐹𝑜𝑟𝑒𝑐𝑎𝑠𝑡𝑒𝑑 𝑠𝑒𝑔𝑚𝑒𝑛𝑡 𝑣𝑎𝑙𝑢𝑒 2025 𝑇𝑜𝑡𝑎𝑙 𝑓𝑜𝑟𝑒𝑐𝑎𝑠𝑡𝑒𝑑 𝑚𝑎𝑟𝑘𝑒𝑡 𝑣𝑎𝑙𝑢𝑒 2025
5 Measured by the CAPEX growth YoY
6 SIATOTL index – which is a ASP index of all semiconductor products
Figure 19: Emerging markets
IoT ADAS VR and AR GCSTM GCCM 0,0 % 5,0 % 10,0 % 15,0 % 20,0 % 25,0 % 30,0 % 35,0 % 40,0 % 45,0 % 0,00% 10,00% 20,00% 30,00% 40,00% 50,00% 60,00% 70,00% R e ve n u e o p p e rtu n ity CAGR 0 0,2 0,4 0,6 0,8 1 1,2 2 0 1 1 2 0 1 2 2 0 1 3 2 01 4 2 0 1 5 2 0 1 6 2 0 1 7 2 0 1 8 2 0 1 9 Q 1 2 0 1 9 Q 2 2 0 1 9 Q 3 2 0 1 9 Q 4 (A SP pe r s qu ar e inc h, $) -15% -10% -5% 0% 5% 10% 15% 20% $10 000,00 $20 000,00 $30 000,00 $40 000,00 $50 000,00 $60 000,00 2013 2014 2015 2016 2017 2018 2019
CAPEX Industry YoY asp growth OVERSUPPLY
7 Figure 22: Memory market shares
Source: Statista, Author
Figure 23: Chinese market revenue
Source: SEMI, Author
Figure 24: Investment in new fabs
by firms in different countries
Source: SEMI, Author
Figure 25: Porters Five Forces
Source: Author
the market has reached a new oversupply, which has caused the free fall of the average selling price. Most producers now decided to cut production. The average selling price of Micron’s products fell by 20 percent QoQ. As a result, Micron has announced they will cut production by 5% for DRAM and NAND for 2019. Samsung and SK Hynix have also announced a production cut (they have not announced the reduction amount) to try to infuse a price increase.
Competitive positioning Market positioning of firms
The memory market is a highly competitive oligopolistic market, which is defined by a few large firms with big market shares. However, the products are not differentiated resulting in a price war and competitive strategies based on game-theory. Samsung is the leading player in both DRAM and NAND, controlling over 30% of the market shares in both markets. SK Hynix and Micron is also big players in both markets, while the rest of the players are specialized in either one of the markets.
Chinese market impacts
The Chinese market accounted for 57% of microns revenues in 2018 and had a 2Y CAGR of 81%. The second biggest market was the US market, which accounted for 12% of the revenues in 2018 with a 2Y CAGR of 37%. This proves how extremely important the Chinese market is for the memory industry. The market players face a significant risk of increased competition in the Chinese market. As a result of significant investments in the semiconductor industry by the Chinese
government and various state owned or state affiliated firms that intends to
advance in the Chinese market. The made in China 20257 plan sees the
semiconductor industry as a key component. China has a target of producing 40% of all semiconductors it uses by 2020, and further increase to 70% in 2025. The plan is backed by governmental initiatives including tens of billions of dollars in investments of the country’s chip industry, as well as tax cuts for producers.
A strategic diversification away from commodities
Microns major products are NAND and DRAM which both are categorized as commodities, where they have little to non-price influence. Micron have the possibility to switch capacity on production of the two by analyzing price projections to maximize revenue. To diversify away from the risk of having no other products to rely on in the case of price stagnation in both markets, Micron have had a joint venture with Intel to develop a new memory class product called 3D Xpoint. 3D Xpoint is a non-volatile memory and is characterized by massive in memory data base, fast system recovery, low latency and high endurance. The product has a write speed 1000 times faster than 3D NAND (10x faster according to reviews). The companies made clear in the Intel & Micron 3D Xpoint webcast that the product will not interfere with the 3D NAND roadmap, but target niche markets. The end user possibilities will be gaming, high fidelity pattern recognition and genomics which all require incredible high memory speed.
The cost of producing 3D Xpoint per GB is estimated to be between NAND and DRAM. The CEO of Micron explained in the webcast that the technology will have
7 A governmental initiative which aims to boost the production of higher-value products in
china until 2025. 0,00% 11,00% 22,00% 33,00% 44,00% 55,00% DRAM NAND 0 5 10 15 2016 2017 2018 2019 0 1 2 3 Threat of new entrants Threat of Substitutes Bargaining power of suppliers Power of buyers Rivalry among industry players
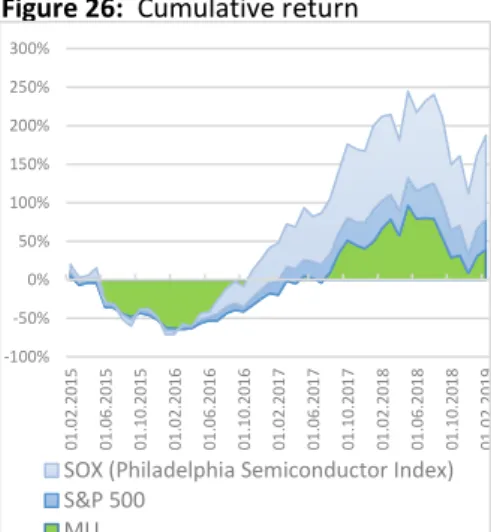
8 Figure 26: Cumulative return
Figure 27: MU metrics VS Peers 2018
Figure 28: DCF summary
an aggressively scale ability which can give it cost advantages in the future. Market Research Future’ have projected the technology to reach revenues of $5 billion in 2022 and is forecasted to have a CAGR of 13,7%.
Investment summary
The issued recommendation for Micron Technology will be buy as a result of the DCF valuation resulting in a price target of $41,38 and a upside potential of
24,19% with medium risk (see appendix: 15 for investment risk reasoning). The
evident start of a new bust-cycle and declining growth in familiar markets is reducing the upside potential for Micron technology. The introduction of 3D Xpoint and the uprising of the new tech markets combined with a better cost structure then its competitors support the evaluation of an upside potential.
The start of a new bust-cycle
The market has evidently started a new bust cycle with 2019 Q1 showing a decline of -6% in revenues Q/Q, Q2 with -26% decline Q/Q and Q3 with a -18% decline Q/Q. The bust cycle is forecasted to flatten out 2020 and go over to a positive growth in 2021. This is a result of the market starting to reduce capacity to shrink the oversupply of DRAM and NAND in the market.
Reducing capacity and cost yields
The cost structure of Micron is forecasted to increase as the capacity is reduced, which causes the “cost per GB of NAND and DRAM” to increase. The main cost driver COGS is forecasted an increase to 65% in 2019F and 68% in 2020F. The introduction of 3D Xpoint is also a factor which result is in a higher cost structure as it takes time to reach maturity yields for the product. The cost per GB of
producing 3D Xpoint is estimated to be between DRAM and NAND8 and will not
change the cost structure dramatically. However, as the capacity is increased and 3D Xpoint reaches better cost yields COGS is estimated a decrease to 49% in 2021 and 55% in 2022.
A strong cash flow position should calm investors
Even though costs are forecasted to increase, and revenues are in a steep decline Micron will still generate sufficient cash flows. Micron currently has a substantially lower cost structure then its competitors. Which results in a positive net income for 2019F, 2020F,2021F and 2022F. The recent years Micron went through a deleveraging process where they reduced their Debt/Equity ratio from 113% in 2017 to 30% in the end of 2018, which substantially decrease the risk arising from unsustainable debt levels. The accumulated FCFF to 2022F is estimated to $11,6 billion which is enough to complete the scheduled share repurchasing program of $10 Billion.
Valuation methods
The target price is calculated with a Discounted Cash Flow (DCF) valuation using the Free Cash Flow to the Firm (FCFF) method. The model computes the
Enterprise Value EV) of the firm, which is subtracted from net debt to derive the Equity Value (EQV). The price target of $41,38 is the result from dividing the EQV by the shares outstanding. A complimentary valuation using multiple valuation by
8 Investor conference between Micron and Intel introducing 3D Xpoint.
Source: Author estimates Source: Bloomberg, Author Source: Yahoo finance, Author
-100% -50% 0% 50% 100% 150% 200% 250% 300% 01 .0 2. 20 1 5 0 1 .0 6 .2 0 1 5 0 1 .1 0 .2 0 1 5 0 1 .0 2 .2 0 1 6 0 1 .0 6 .2 0 1 6 0 1 .1 0 .2 0 1 6 0 1 .0 2 .2 0 1 7 0 1 .0 6 .2 0 1 7 0 1 .1 0 .2 0 1 7 0 1 .0 2 .2 0 1 8 0 1 .0 6 .2 0 1 8 0 1 .1 0 .2 0 1 8 0 1 .0 2 .2 0 1 9
SOX (Philadelphia Semiconductor Index) S&P 500 MU 63% 19% 9% 19% 30% 19% 41% 10% 7% 49% 1% 47% COGS SG&A R&D OP margin Tax rate Net margin Industry Micron
9 Figure 29: Revenue forecast
Source: Author
Figure 30: ARIMA revenue model
prediction
Source: Author, created in R Figure 31: COGS forecast
Source: Author
Figure 32: ARIMA COGS model
prediction
Source: Author, created in R
assessing the P/E, EV/SALES, EV/EBITDA has also been used to investigate the result of the DCF method, resulting in an average target price of $34,10.
Investment risk
Investors should be aware of the high volatility in prices for DRAM and NAND which can substantially affect Microns earning potential. Micron also face regulative risk in their most important market, China. An elaborated risk analysis is detailed in the investment risk section as well as a risk evaluation of the DCF method using sensitivity analysis and a Monte Carlo simulation.
Valuation
The investment recommendation is based on a DCF model with FCFF as the discounted value. The EV-value of Micron is estimated to be $48,094 billion. Net debt 2019F is estimated to be $2,185billion resulting in an equity value of $45,93
billion. Estimated shares outstanding in 2019F is 1110 million shares, resulting in
an estimated target price of $41,38.
The DCF model is differentiated into three different periods:
• 2019F-2022F: Explicit period (accounts for 24% of the price target) • 2023F-2028F: Fade period (accounts for -2% of the price target)
• 2028F-Perpetuity: Terminal period (account for 78% of the price target) The reasoning for using a three-stage model is to ensure credibility in the forecasts. The purpose of the explicit period is to forecast the future values with line-item accuracy. However, as forecasts become less accurate for each time step included, an explicit forecast will not be used after 2022F. The fade period is used to ensure the long-term behavior of the business is reflected in the model. At last a terminal period will be added, which represent all future values after 2028F.
Revenues 2019F-2028F
To predict the revenues for the explicit period the model will be using a time series forecast based on the historical data of the revenues. An ARIMA
(1,1,9)(2,1,1) model is selected (See comprehensive revenue forecast document attached). The model has no lags outside the 95% confidence interval indicating it captures all information in the time series. The residuals are normally distributed and follows a white noise process. The model is consistent with the market research and predicts a CAGR (2019-2023) of 12%. The 3D Xpoint revenues is forecasted using the average of two forecasts estimated by Hardy and Webb (see
Appendix 18: Revenue forecast).
For the fade period a normalized quarterly growth rate of 4,40% is applied. The normalized growth rate is the average growth rate between two cycles (2013-2019). The terminal growth rate is selected by using economic theory. Economist states to choose a rate between 4,5-5%, which reflects the economic opportunity created from the combined effect of population growth, inflation and general
productivity increase9.
Cost of goods sold 2019F-2028F
The COGS is assumed to follow the time to maturity yield of new products and
9 Rees, M. Financial modelling in practice. Wiley, 2008.
$-$2 000,00 $4 000,00 $6 000,00 $8 000,00 $10 000,00 $12 000,00 $14 000,00 $16 000,00 $18 000,00 $20 000,00 2 0 1 3 Q 2 2 0 1 4 Q 1 2 0 1 4 Q 4 2 0 1 5 Q 3 2 0 1 6 Q 2 2 0 1 7 Q 1 2 0 1 7 Q 4 2 0 1 8 Q 3 2 0 1 9 Q 2 2 0 2 0 Q 1 2 0 2 0 Q 4 2 0 2 1 Q 3 2 0 2 2 Q 2 2 0 2 3 Q 1 2 0 2 3 Q 4 2 0 2 4 Q 3 2 0 2 5 Q 2 2 0 2 6 Q 1 2 0 2 6 Q 4 2 0 2 7 Q 3 2 0 2 8 Q 2
Actual value ARIMA forecast Growth forecast 0% 10% 20% 30% 40% 50% 60% 70% 80% 90% 100%
10 Figure 34: COGS evolution
Source: Bloomberg, Author
Source: Authors estimates
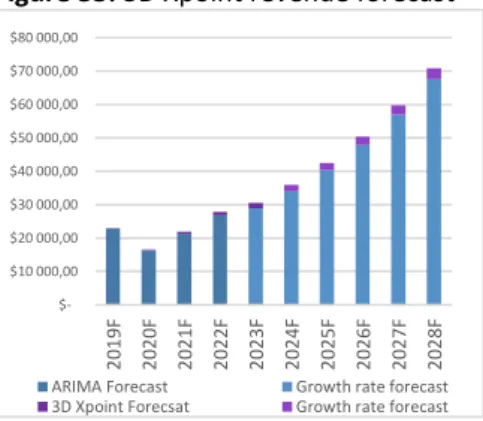
Figure 33: 3D Xpoint revenue forecast
Source: 3D Xpoint: Hardy and Webb
Source: Authors estimates
production capacity. Historically memory firms introduce a new memory chip with increased memory capacity every second year, following the principals of “Moors Law”. The COGS for the explicit period are forecasting using a time series forecast. The model used is an ARIMA (2,1,0) model, which had the lowest AIC score of the candidate models. The model predicts an increase in cost for 2019F and 2020F which is consistent with the reduced production capacity and the introduction of the new 3D Xpoint chip. However, the COGS are assumed to decrease as the production ramp up and the products reach yield maturity.
After conducting an industry analysis (Appendix: 9), we can see that Micron has a cost advantage over the market. However, for the long-term assumption it is not reasonable to assume that Micron will manage to keep the cost advantage in perpetuity. By analyzing the historical COGS from the industry (figure 34) we can conclude that Micron goes over and under the industry in cycles. The model assumes that the COGS for Micron will tend to the normalized industry average of
70%, which is estimated by taking the average of two full cycles (2013-2018). Other relevant line-items
SG&A, R&D and other operating (income) or expense shows much less volatility based on historical data. Therefor it is assumed a direct correlation between revenues and the respective line-item. To forecast the future values the model applies the past 3Y average ratio and multiplies it with the forecasted revenue.
CAPEX (Explicit period) and D&A
For CAPEX 2019F Micron has estimated an expenditure of $9billion. The estimate includes the expenditures caused by 3D Xpoint, which the previously shared with Intel. To forecast the CAPEX for the explicit period a 2Y average of 2018 and 2019F is used to reflect the most recent capital structure of the firm. The rate is
multiplied with the forecasted revenues. For D&A a 3Y average is used resulting in a depreciation rate of 22% multiplied by the value of fixed assets.
Weighted Average Cost of Capital
To discount the FCFF the WACC is used. The WACC shows small fluctuations YoY depending on several factors. For the cost of equity, the CAPM model has been used. The risk-free rate data is taken from Bloomberg the 02.08.2019 and is equivalent to a long-term governmental bond. The market risk premium is taken from Bloomberg the 02.08.2019 and is equivalent to the expected return of the US market, calculated by using a relevant market index. The beta is calculated by taking the unlevered beta of Microns peers and applying Microns debt structure and tax rate for each respective year. The cost of debt (Appendix 10: Debt Schedule) is calculated each year by forecasting the debt repayment of the current notes and loans. The debt/equity ratio is assumed constant and approximately equal to 42%. The rate is determined by taking the average D/E ratio over the two last cycles (2013-2018).
Fade period
The furthermost important role of the fade period is to ensure that the return on capital employed converges to a reasonable level before a subsequent perpetuity formula is applied to the terminal value. This approach can help with a common problem in valuation models, which is to underestimate the capital expenditure requirements making the FCFF to high.
Figure: 36: Debt/Equity and WACC Figure: 35: Forecasted CAPEX
40% 50% 60% 70% 80% 90% 100% 110% 120% 2 0 0 7 2 00 8 2 0 0 9 2 0 1 0 2 0 1 1 2 0 1 2 2 0 1 3 2 0 1 4 2 0 1 5 2 0 1 6 2 0 1 7 2 0 1 8 Industry MU Average industry 0% 10% 20% 30% 40% 50%
Base Explicit Fade
$10 000,00 $20 000,00 $30 000,00 $40 000,00 $50 000,00 $60 000,00 $70 000,00 $80 000,00 2 0 1 9 F 2 0 2 0 F 2 0 2 1 F 2 0 2 2 F 2 0 2 3 F 2 0 2 4 F 2 0 2 5 F 2 0 2 6 F 2 0 2 7 F 2 02 8F
ARIMA Forecast Growth rate forecast
3D Xpoint Forecsat Growth rate forecast
11,34% 11,52% 11,70% 11,88% 12,06% 12,24% $20 000,00 $40 000,00 $60 000,00 $80 000,00 $100 000,00 $120 000,00 $140 000,00
11
Source: Authors estimates
Source: Authors estimates
s
Source: Authors estimates
To adjust the return-on-capital ratio we can either adjust the costs, so the profit level is set to an appropriate return on capital. However, the DCF model will use a capital base adjustment, which will keep more integrity in the IS, on the expense of a less realistic BS (See Appendix 8: ROCE analysis and adjustments)
The appropriate return-on capital at the end of the fade period will typically be some margins over the WACC, which mean that it still will be some positive economic profit. To adjust the capex-to-sales I have used solver, so the return-on-capital is adjusted to a desirable level. This model we will assume an economic profit of 1 % in perpetuity and converge to a ROCE of 12% in the end of the fade period, which is the industry average over the two past cycles.
Screening process of peers
To better asses the credibility of the DCF valuation a multiple approach will be used to compare the result. The selection process of peers consists of 5 screening stages, where the initial group was selected using the market shares of the industry. Next the group will be evaluated by investigating the similarity of products, growth, capital structure and size. In the end the group consisted of 5 firms consistently displaying similarity in products, growth and capital
expenditures (Appendix 11: Comparable companies).
Multiple valuation
The estimated price target using the multiple approach is $34,10, which supports the theory that Micron is undervalued. The price target is estimated using the EV/Sales (2,00x) and the EV/EBITDA (6,41x). The ratios measure the value of the firm using operational parameters. To account for the cyclical variability in sales and EBITDA the past 3Y average of the ratios have been used.
Financial analysis
Revenues drives the variation in EBIT
The EBIT margin has grown rapidly from 2016 until 2018, before it is predicted to plummet in 2019F. The EBIT growth has mainly been driven by an increase in the ASP of DRAM and NAND sales volumes, following a boom cycle. The EBIT variation is closely correlated to the revenues and less effected by the costs. The cost structure of Micron exhibits less volatility compared to the volatility of the revenues. The EBIT is predicted to fall as the market is entering a bust-cycle and not increase again before the predicted revenue increase in 2021F. For the fade period the EBIT margin is predicted to be stable around 18-19% as a normalized growth rate is used to forecast the revenues.
Deleveraging before the bust cycle
In 2015 Micron finalized the acquisition of Inotera Memories by acquiring the rest of the outstanding shares, a transaction valued approximately $4billion. This substantially increased Micron debt levels. However, since 2015 Micron has used considerable amount of its cash to repay debt. The debt to equity reached 113% 2016 and ended at 30% in 2018. Micron is dependent on low debt levels as they now enter a new bust-cycle. To capitalize on new opportunities and to maintain the high capex investments Micron must be able to obtain capital from the capital markets at a reasonable rate. After the operational cash flows Micron is estimated to need additional $3,7billion in capital to maintain a positive cash flow. Microns debt levels are estimated to lower as the cycle are starting to turn in 2021F. Figure: 37: Ratio multiples
Figure: 39: Interest coverage Figure: 38: Revenue volatility
$5 000,00 $10 000,00 $15 000,00 $20 000,00 $25 000,00 $30 000,00 $35 000,00
EBITDA Revenue COGS
σ = 29% σ = 9% EBIT 0% 10% 20% 30% 40% 50% 60% -5,00 0,00 5,00 10,00 15,00 20,00 25,00 30,00 35,00 40,00 45,00 50,00
Debt ratio (%) Interest Coverage Ratio (x)
10,16 2 6,41 0 5 10 15 P/E EV/Sales EV/EBITDA x x x
12
Source: Authors estimates
ROCE and Economic profit
Micron have generated a high return on its employed capital the recent years, combined with a moderate cost of capital the economic profit has averaged 13% for the base years 2016 to 2018. For 2019F the decrease in revenue combined with a growth in the capital expenditures lowers the ROCE, but as the ROCE is still higher than the WACC the economic profit will be positive. As for 2020F the capital employed is growing faster than the revenues. The result is a stagnation in ROCE combined with a flat WACC creates an economic loss. However, the
economic profit is forecasted to increase again as the revenues increase in 2021F. For the fade period the economic profit averages 1%.
Strategic reward for shareholders
Micron is currently not paying dividends. However, In May 2018 the board of directors authorized and announced that Micron will initiate a stock repurchasing program, starting in 2019. The repurchasing program will aim to repurchase $10billion of outstanding common stock. A buyback fits Micron’s business model better than dividends as it provides much more flexibility on the cash usage. From the forecast it is reasonable for Micron to reinvest the FCFF in the firm instead of a buyback in 2019F and continue the buyback plan in 2020F as the cash flows are increasing again. The forecasted cumulative FCFF for 2019F to 2022F is $11,6
billion, which is enough to complete the stock repurchasing program.
Investment risks
Operational risk | Unable to improve cost per GB(OP1)
Historically micron have regularly been able to improve their cost per GB by reducing costs and adding more capacity to the chips. Without improving cost per GB Micron will risk losing a significant portion of their operating margin. Micron have already stated a production cut which will affect the cost per GB.
Figure: 40: Economic profit analysis
-20% -10% 0% 10% 20% 30% 40% 50% 2 0 1 6 2 0 1 7 2 0 1 8 2 0 1 9 F 2 0 2 0 F 2 0 2 1 F 2 0 2 2 F 2 0 2 3 F 2 0 2 4 F 2 0 2 5 F 2 0 2 6 F 2 0 2 7 F 2 0 2 8 F Ter mi n al ROCE EP Base Average EP Explicit EP Fade
13
Operational risk | A broader product portfolio (OP2)
Micron will introduce their 3D Xpoint product in 2019. This product class has only existed in the market 1 year through Intel’s Optane chip. Intel has already
achieved first move advantage and started to capture market shares in the niche. The operational margin will be affected by how the market receives the product and how well the product compares to Intel’s Optane. The yield ramp will be slower since Micron don’t have experience in scaling the product and the cost per GB will likely increase.
Market risk |Competitors resources (MR 1)
Some of Microns competitors are substantially larger corporations. Many of the competitors have larger resources to invest in technology, capitalize on fast immerging opportunities and withstand future bust cycles. Micron is specialized in the memory market, while most of the competitors are present in several markets within the semiconductor industry. This makes them able to switch capacity between different markets faster dependent on future earning potentials.
Market risk |Decline in familiar markets (MR 2)
Many of microns highest earning segments have declined in growth and future projections support the assumptions of a continuation in declined growth. If new emerging markets cannot generate enough demand to support a higher growth it can adversely affect Microns future revenue earnings.
Market risk |Price volatility (MR 3)
Micron and many of its competitors have the possibility to ramp up production which will have a considerable impact on supply. An increase in the world supply of memory and storage, if not followed by an equal increase in demand would cause a further decrease in the average selling price. A decrease in the ASP will adversely affect microns operating margins, results and financial condition.
Market risk |Chinese governmental market interference (MR 4)
Micron face the risk of increased competition because of the substantial
investments by the Chinese government in the IC market. The result can further increase the market shares of Chinese firms in the Chinese market.
Financial risk | Sufficient cash flows for CAPEX (FR1)
The cash flows are primarily dependent on the volume of memory products sold, cost per GB and ASP. Any change in these factors can adversely affect the cash flow holdings. To improving production efficiency, process technology and support future growth opportunities Micron are dependent on heavily CAPEX investments with an estimated CAPEX of 2019 equal to $9 billion.
Financial risk |Negative return on capital investments (FR2)
Micron invest a substantial part of their cash flows in CAPEX. Investments in CAPEX may not generate expected returns or enough cash flows. Any delay in the plans of ramping up production or postponements in construction of new facilities will affect Micron’s financial position.
Political Risk | Huawei (RR1)
On May 15th, 2019 the US government banned US entities from doing business
with Huawei, a major electronics producer based in China. The ban resulted from the Chinese governmental involvement in the firm and claims of espionage. The ban has resulted in a $200 million loss in revenue for Micron, due to sale
14 restraints. Microns CEO stated in June: “We determined that we could lawfully
resume shipping a subset of current products because they are not subject to export administration regulations and entity list restrictions”. New York Times
stated that Micron had found a way to bay pass the ban, because the ban applies to American-made products, where most of Microns products are made outside the US. However, Huawei is Microns top customer and the ban might substantially impact Huawei financial position which might again affect the volume of products
purchased from Micron.10
Regulatory risk | Chinese market restrictions (RR 1)
Micron states in its 10-k report that it risks the Chinese government to implement regulations that can affect how much Micron can participate in the Chinese market. This might be implemented by the Chinese, so they accomplish their stated national policy objectives.
Risks to price target
Terminal economic profit: The assumed terminal ROCE will significantly affect the
price target. The evaluation changes to a hold recommendation if the economic profit in perpetuity is zero. However, if the economic profit falls under-1,5% the recommendation changes to sell. An economic profit between -1,5% and -0% will result in a reduce recommendation, while an economic profit between 0% and 1% will result in hold recommendation. An economic profit greater than 1% will result in a buy recommendation.
Table 3: Sensitivity evaluation of the terminal ROCE.
Source: Authors estimates
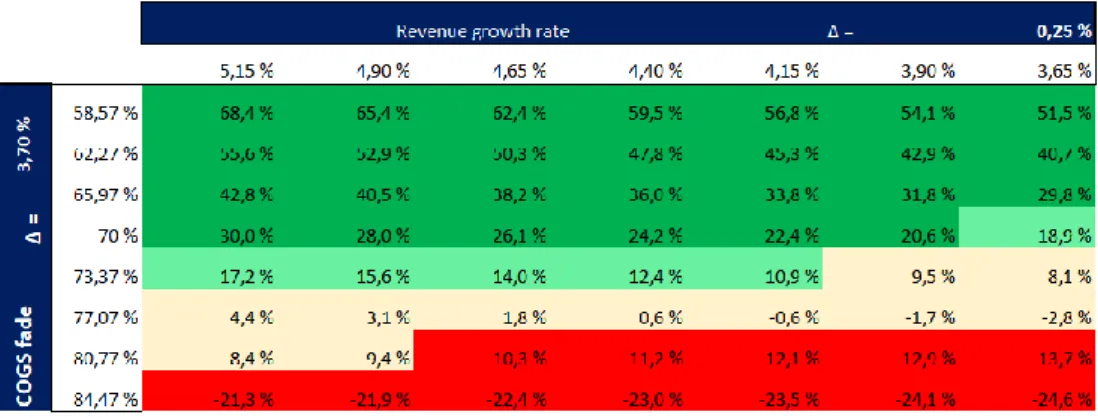
Revenue growth rate and COGS: A 0,25% change in the revenue growth will
result in an approximately 1,7% change in the potential. To change the
recommendation to hold the revenue growth would have to decrease to 3,65%. For the recommendation to change to reduce the COGS would have to increase 7,07%. The COGS are very volatile and 7,07% is not unlikely to happen. From 2007 to 2018 Micron had a range of COGS from 41% to 109%.
10 Reuters, article: «Micron resumes some chip shipments to Huawei, boosting stock”. Written by Sayanti Chakraborty and Stephen Nellis, June 25.
Figure: 41: Recommendation scale
15
Table: 4: Sensitivity of revenue growth (fade) and COGS (fade)
Source: Authors estimates
Monte Carlo simulation:
As complimentary analysis of the price target a Monte Carlo simulation was performed. The price target was the output while the inputs where: COGS – fade, Growth Rate (DRAM/NAND/Other), Growth Rate (Perpetuity), SG&A, R&D and ROCE terminal. As it is not one variable controlling the explicit sales it was not possible to model so it was excluded. All variables were assigned a normal distribution.
Table 5: Results Monte Carlo simulation
Source: Software – Oracle Crystal Ball
The Monte Carlo simulation was modelled using 100.000 iterations. The mean from the simulations is 24,81% with a standard deviation of 17,38%. The potential ranges from -48,94% to 104,67%. The simulation results in a 1,88% probability for sell, 17,86% probability for reduce, 20,08% probability for hold and a 60,18%
probability for a buy recommendation. The simulation strengthens the belief of a
buy recommendation. The most sensitive variable was the ROCE terminal value which determines the economic profit in perpetuity. The sales growth (fade) and COGS (fade) all had sensitivity above 10%.
Source: Author
Figure: 42: Variable sensitivity
0,30% -0,90% -6,40% -13,30% 17,70% 61,50% GR - Perpetuity SG&A R&D COGS - Fade SG - Fade ROCE Terminal
16
Micron as a portfolio asset
Regression analysis
To obtain basic information about the stock performance of MU a time series regression has been used from May 2013 to May 2019. The stock has been regressed against the S&P 500, which is assumed to represent the US market. As comparison two of the biggest firms in the technology sector has been included (Apple, Inc. and Alphabet, Inc.).
Beta
From the regression analysis MU has a beta of 1,7 which means that the stock moves 1,7x the market, which is very volatile. In comparison Alphabet and Apple closely follow the market with a beta of 0,99x and 1,17x.
Alpha
All stocks outperformed the market index with an alpha > 0. However, the p-value of the regression is over 0,05 which indicates that the factor is not statistically relevant. Investors should investigate the alpha at different sites which quote risk factors related to stocks.
Market influence on the stock
The Micron stock has an R-squared of 0,15, indicating that only a small portion of the stock movement can be explained by market movement. This indicates a lot of risk as the stock movements is harder to predict based on the general market. This implies that the Micron would be hard to Beta-hedge as it would require constant re-balancing, resulting in low beta hedging efficiency. In comparison both Alphabet and Apple exhibits higher R-squared values of 0,24. Investors are recommended not to use the Micron stock for beta hedging.
Semiconductor portfolio construction Selection of firms
The PHLX Semiconductor Sector Index (ticker: SOX) is a market capitalization-weighted index composed of 28 US firms. The firms are primarily involved with the design, distribution, manufacture and sale of semiconductors. The index is very useful for investors which seeks an investment object that fully covers the US semiconductor market. To construct a portfolio which covers the whole US semiconductor industry the SOX index will be decomposed.
Figure: 43: Regression output
Source: Data: Yahoo finance
Regression: Author
17
Risk and reward
Figure 44: SOX index decomposition; Risk and return.
Source: Data: Bloomberg, Graph: Author
Micron has a favorable expected monthly return of 2,5% (5th highest) compared to
the peer’s average of 2,1%. However, the returns exhibit a lot of volatility with a
std. dev of 12% (2nd highest), 310 basis points over the peer’s average. The Sharpe
Ratio has been applied to compare the risk over reward for the industry peers. The high volatility does not justify the return and Micron falls right under the industry average of 0,22.
Sharp ratio maximized- and volatility minimized portfolios
To verify weather Microns stock should be bought or sold two hypothetical portfolios will be constructed using Mean Variance Theory (MVT). The first portfolio will seek to create an asset of semiconductor firms in the US that
maximize the return over risk, which will be quantified using the Sharpe Ratio. The second portfolio will aim to construct an asset that will cover all the US
semiconductor firms, which minimizes the potential risk. The ratio used to quantify risk will be the std. dev of the portfolio.
Portfolio construction
Figure 45: Risk and return SOX components including portfolios.
0 0,1 0,2 0,3 0,4 0,5 0% 2% 4% 6% 8% 10% 12% 14% 16% 18%
Expected [R] Std.dev Sharpe Ratio Average SR
-4,0 % -2,0 % 0,0 % 2,0 % 4,0 % 6,0 % 8,0 % 10,0 % 12,0 % 0,0 % 2,0 % 4,0 % 6,0 % 8,0 % 10,0 % 12,0 % 14,0 % 16,0 % 18,0 % CML CML
Sharpe Ratio Max Portfolio Min Variance Portfolio MU stock Efficent Source: Author
18 As we can see from figure 45 the Micron stock (R: 2,5%, σ=12%) is one of the most volatile stocks. An investor which wish to hold a position in the
semiconductor industry is recommended to include several assets as it would greatly reduce the unsystematic risk. By constructing a Minimum Variance Portfolio (MVP) (R: 1,6%, σ=3,1%) of all the SOX components an investor can reduce the risk with 8,9% (and give up 0,9% potential return), compared to solely investing in the Micron stock. An investor which seeks to maximize the return given the risk would be recommended to invest in a Sharpe Ratio Maximized Portfolio (SRMP) (R: 5,3%, σ=6,3%). The SRMP asset increases the potential return with 3,1%, while simultaneously reducing the risk with 5,7% compared to solely investing in the Micron stock.
Both portfolios include a long position in the MU stock
Even though Microns stock exhibits a lot of risk, a big part of the risk can be diversified away due to the correlation between the SOX components. The MVP portfolio includes a 1% weighted long position in Micron. The SRMP includes a 5% weighted position in Micron (see Appendix: 17 for full analysis).
Limitations of using Mean Variance Theory
The assumptions for using mean variance theory is limiting the use of the model. The model assumes that all returns are normally distributed, which is rarely the case. The model assumes that all expected returns, variances and covariances are known for all investors, which is unrealistic. The model also assumes that it is no transaction costs, which we know is not true. Small input errors can cause completely wrong calculations making the model likely to be estimation biased. An investor which use MVT to construct a portfolio will need to constantly rebalance the portfolio as new daily returns change the E[R], variance and covariances of the components.
19
Appendices
20
21
22
23
24
25
26
Appendix 8: ROCE analysis
In the past Micron has achieved a considerable higher ROCE as its competitors. For 2017 and 2018 Micron realized a ROCE of 20% and 44%, while the industry on average realized 12% and 13%. The ROCE has been decomposed to identify efficiency drivers. The main ROCE drivers has been DRAM the past years. DRAM has gone from a revenue share of 58% in 2016 to 70% in 2018. The main reason is the increase in ASP for DRAM, while the ASP has stagnated for NAND. Micron also displays a better cost structure then the industry realizing a COGS/Revenue of 58% and 41% while the industry average was at 64% and 63% for 2017 and 2018. The capex declined in 2017 while heavily
increasing again in 2018 as the industry peaked in the boom-cycle. Micron also managed to sustain a higher ROA for 2017 and 2018 compared to the industry.
Capital employed model adjustments:
Capital employed/Working Capital is commonly calculated as total assets – current liabilities. The DCF model will use an adjusted capital employed = Total fixed assets + Operating Working Capital. Where operating working capital excludes non-operating items. The biggest effect of the adjustment will be the exclusion of Cash & Equivalents. The reasoning for excluding Cash & Equivalents is that the account is usually invested in fixed income products which results in a stable risk-free return. By excluding non-operating items in CE the ROCE will better reflect the return created by assets engaged in operating activities, which is the true value drivers of Micron. The implication of the adjustment is that the ROCE and in turn economic profit will be higher than if an investor used the non-adjusted working capital to calculate ROCE or economic profit. From the ratio analysis we can see that the economic profit for the fade period is positive, while the FCFF is negative. However, by using a non-adjusted ROCE the economic profit would also be negative. A positive implication is that model adjust the true value drivers of the company to a reasonable level.
27
Appendix 9: Metrics comparison between Micron and the memory market
Micron outperform the industry in most areas for 2018. However, by analyzing the data for a longer time horizon, Microns metrics are closely related to the industry averages. For 2018 micron exhibits a lower COGS, SG&A, R&D and tax rate relative to revenues. The COGS to revenue advantage can be influenced by Microns revenues which is more influenced by DRAM then other memory. Micron is also constantly improving the DRAM maturity yields, which mean that they reach cost optimization faster for each new product they start producing. Micron also used considerably less on SG&A then its competitors. For R&D Micron spent 7%, while the industry averaged at 9%. Intel and Micron had a strategic collaboration through IMFT to research and develop 3D Xpoint, resulting in R&D costs cut in half for 3D Xpoint.
For the period 2007-2018, Micron have had a slightly competitive advantage in the cost structure. Realizing a 2% advantage for COGS and SG&A compared to the rest of the industry players. Micron had an average of 10% in R&D, which is 2% over the industry average. One of the main targets of R&D expenses for Micron is to reduce the yield to maturity of new products. The higher R&D expenditures might be an explanation to why Micron today have a much better cost structure then the average.
For 2018, Microns return metrics is much better than the industry average. The ROE is 55%, which is exceptionally good considering the low leverage. Micron had leverage multiplier of 1,30x, while the industry had an average of 1,80x. By analyzing the time period 2007-2018, Microns return metrics are more related to the industry averages. However, micron still realizes a 1,52% higher return on invested capital, which is the most important factor considering the capital requirements in the industry.
28
Appendix 10: Debt schedule
The debt information is collected from the 10-k 2018 report, with the rate reflecting the effective rate for each instrument. The rest of the table shows the calculated balance for the current and long-term obligations for each loan during the explicit period. All new capital is assumed required through the new credit facility agreement which Micron entered in the end of 2018.
29
Debt schedule explicit period snapshot:
Debt schedule fade period: